This paper describes the use of a well site prioritization tool that can be used by water resource planners to identify new well sites for potable water production. The tool incorporates user-defined factors such as water quality, aquifer characteristics, and impacts on existing wells. This tool uses cell-based data layers to score and weight each of these factors for the entire region based on selected shape files. The results are displayed as color-coded values identifying the sites that best meet the criteria. New data can be incorporated and scoring criteria changed, providing a sustainable decision-making tool for water supply planners.
In Honduras, groundwater is being used increasingly to satisfy population-center requirements as streams and rivers become more heavily polluted by the influx of domestic, agricultural and industrial contamination.In addition, reliance on groundwater for municipal water supply will increase as population center growth continues in the future.During Hurricane Mitch, many of these municipal water systems throughout Honduras were severely damaged exacerbating the need for potable water supply.
In response to this need, the United States Agency for International Development (USAID) has sponsored a project to perform hydrogeologic assessments and develop sustainable groundwater management programs in five of the hardest hit municipalities in Honduras.� The main goal of this project is to develop sustainable water resource management programs that will assist the municipalities in optimizing their groundwater resources.� Components of the project include a detailed evaluation of their groundwater resource, inventory of groundwater supply wells, evaluation of water supply systems, estimates of sustainable yield, analysis of project population growth and patterns, recommendations for the development of additional water-supply resources, and development of best water-resource management practices.� This project is the first of its kind in Honduras, focusing on characterizing the available water supply and analyzing the potential growth and water supply need, then making recommendations to maintain a balanced water budget.In addition, a key component of the project is to provide knowledge transfer and training to Honduran engineers and hydrogeologists so that Honduras can sustain sound water management practices into the future.
One of the key components to support sustainable water management practices was the development of the Water Resources Management System (WRMS).The WRMS is a desktop computer application developed to store, manage, and analyze technical information gathered and generated during the analysis and characterization phases of this project.The application is a management tool that can be used by the municipalities and other decision-makers to sustain and manage their groundwater resources.� The system is composed of both a data management system and a geographic information system (GIS) linked together as one application.Through the WRMS, users can:
� Manage and generate reports for wells, storage tanks, and springs
� View well logs and well completion diagrams
� Analyze water quality and water level data
� Track statistics on water use
� View wells, water quality information, and aquifer characteristics on maps of the study area
� Identify and prioritize future well sites
The applications main components are a Microsoft Access database and an Esri ArcView 3.2 GIS.� The two components work together and function as one system through a desktop Microsoft Visual Basic application. This application is the main user interface and allows data to be shared back and fourth between the data management system and the GIS.
One of the components of the WRMS � the Well Site Prioritization Tool � is the focus of this paper.� The purpose of the well site prioritization tool is to identify and prioritize candidate locations for new wells based on a user defined set of selection criteria. This tool formalizes the approach to evaluating and selecting cost-effective well sites by using a prioritized set of criteria for ranking sites and presenting a map showing the sites that best meet the criteria provided.
The typical process for evaluating well sites is to evaluate each site against a list of specified criteria.� These criteria usually take the form of statements based on sound financial, health, or scientific principals such as:
�Look for candidate sites over aquifers that can produce high yields
with good water quality.�
�Identify locations that are close to existing water supply
infrastructure to reduce transmission cost.�
�Use land that is publicly owned to reduce acquisition cost.�
Some of these criteria are more important than others depending upon the individual situation, overall goals, and most immediate community needs. Therefore it becomes necessary to weigh the different factors in order of importance.In a community where there are chronic water quality problems selection of a site with good water quality may far outweigh transmission or acquisition factors.� Another community where water quality is not an issue, transmission or land acquisition costs may be more important criteria for selecting new well locations.
A common approach to selecting the best well site is to develop a decision matrix that evaluates a set of candidate sites against a set of criteria. An example this type matrix is shown in the table below.
Table 1.� Well site prioritization matrix.
|
|
|
Site 1 |
Site 2 |
Site 3 |
Site 4 |
||||
|
Criterion |
Multiplier |
Rank |
Value |
Rank |
Value |
Rank |
Value |
Rank |
Value |
|
Pumping
Cost |
1 |
2 |
2 |
2 |
2 |
2 |
2 |
1 |
1 |
|
Proximity
to Existing Pipelines |
1 |
3 |
3 |
3 |
3 |
2 |
2 |
2 |
2 |
|
Land
Ownership |
2 |
3 |
6 |
3 |
6 |
3 |
6 |
2 |
4 |
|
Groundwater
Quality |
3 |
4 |
12 |
4 |
12 |
4 |
12 |
3 |
9 |
|
Impacts
on Existing Wells |
4 |
1 |
4 |
1 |
4 |
1 |
4 |
0 |
0 |
|
Aquifer
Characteristics |
8 |
5 |
40 |
5 |
40 |
5 |
40 |
4 |
32 |
|
Aquifer
Thickness |
10 |
3 |
40 |
1 |
10 |
3 |
30 |
2 |
20 |
|
|
Total |
97 |
77 |
96 |
68 |
||||
The candidate sites are listed across the top of the matrix and the criteria to be scored are listed on the left.� Each criterion is assigned a weighting factor shown in the multiplier column above.� This multiplier enables the criterion that is most important to contribute the most to the final score, and thus have the most influence on the prioritization.For each criterion, each site is assigned a rank, which is multiplied by the multiplier to get an overall value for the individual criterion.� The values are then summarized to a final score for each site, which is used to determine the sites that best meet the overall criteria.� In the example above, Site 1 best meets the overall criteria specified because it scores highest overall.
The well site prioritization tool automatically performs this analysis on the entire region to be evaluated.� Each criterion in the matrix table is defined in and represented by an ArcView shapefile theme.In some cases, an item from the shapefile�s attribute table is used to develop criteria scored.In other cases it is the physical proximity of features that are used for scoring.�
The tool will process each shapefile into a grid.� Each grid is developed for the entire study area, and each cell in the grid is evaluated and scored against the criteria.The scores are then added together and the cells are categorized based on how well they meet the criterion.These categories are then displayed on the basemap.This concept is shown in Figure 1, below, where the results of two individual grid cells are compared.The areas with the highest total scores (red) are the best candidates for new well production, and the worst (lowest scores) are shown in green.
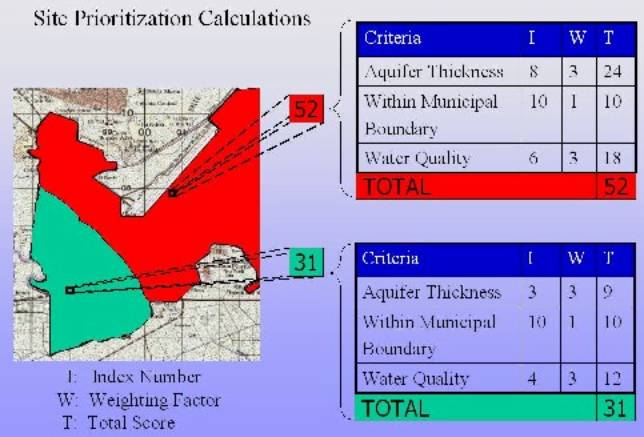
Figure 1. Site Prioritization Calculations
The calculations are based on two scoring components:
Index Numbers
� Rank how well a location meets a specific criterion (e.g. areas of high water
quality may receive a 10 and lower quality areas a 3)
Weighting Factor
� How important a criterion is in the overall selection
So, for any location:
Index Number x
Weighting Factor = Overall Criterion Score
Compute the Overall Criterion Score for each criterion and sum them to get the Total Score for the location.
Using the tool, several model runs can be performed.� By varying the indexing and weighting factors, sensitivity analyses can be performed to determine which criteria have the greatest effect on site selection options.
The typical modeling process starts with defining the criteria, index numbers, and weighting factors.� Figure 2 shows the interface for defining these criteria.
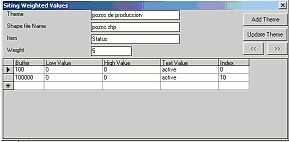
Figure 2.
Defining Model Criteria
Each criterion is defined in a shapefile and identified in the top portion of the screen. If an item in the shapefile is used to describe the criterion, then it is also identified.� Each criterion also gets a weighting factor as well.
To identify the index number assignments, three methods are provided:
1. Buffering: Using buffer tools, any locations within a certain proximity (defined using the Buffer column) of identified features receives a higher index value
2. Range: By assigning a numerical range (identified using the Low Value and High Value columns), index values can be assigned
3. Unique Value: Using the Text Value column, unique attributes values can be assigned unique index values.
An unlimited set of index assignments may be defined for each criterion.
Once the criteria have been defined, the model can be run.This process calculates the overall criterion score for each shape file (criteria) and then summarizes these scores to obtain a total score for each location in the region.� These scores are then classified into ranges and the locations with the highest ranges are identified on a map as the best candidates.Typical results are shown in Figure 3.
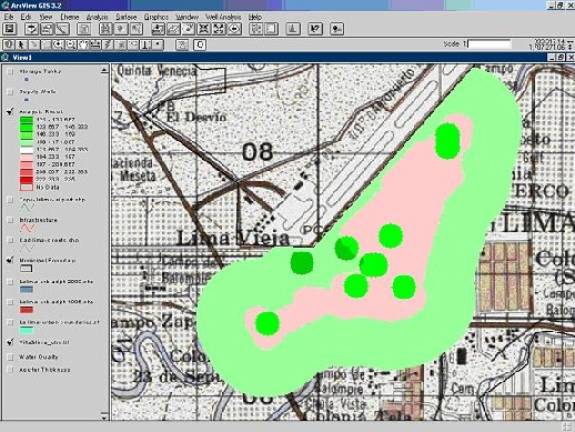
Figure 3. Modeling Results
In the example in the figure above, the areas in pink are identified as the best sites for new wells because they are a sufficient distance from existing wells, close to existing infrastructure, and over adequate water bearing aquifers.
Finally, a query tool is provided to interactively explore each location to identify the individual criterion scores.� This can be used to identify the key factors that went into deriving the overall score.� By clicking on a location, the individual criteria data and calculated scores can be viewed.
To implement the Well Site Prioritization Tool, an ArcView 3.2 project file was created to analyze the model criterion.� An avenue script is invoked via a custom graphical user interface (GUI) in the ArcView project that connects to the data management systems through an ODBC connection.� The script returns two tables for analysis by ArcView�s Spatial Analyst Extension.The first table is a list of each theme to be analyzed, the methodology to be utilized (Buffering, Range, or Unique Value Attributes), the attribute to be evaluated and finally the weighting factor applied to the total score for this theme.� The other table is a cross-reference to the individual attribute ranges and the corresponding index score for each combination in the model.
At this point a series of scripts are repeatedly called to incrementally create a grid where every value is the composite of the criteria of the model.A starting �scratch� grid is first created over the entire study area with a value of zero.� Then for each criteria specified, a new grid is created by converting the current theme to a grid and assigning the index values associated from the cross-reference table.� This intermediate result is then multiplied by the themes weighting factor to get the overall criterion score for each cell.� These are added to the scratch grid and the process is repeated for each theme in the model criteria.
The final resulting grid is a continuous surface of scores base on the model criterion.The grid is added to the view to show a clear GIS representation of the Well Site Prioritization in relation to other basemap features.� A standardized color ramp legend is added to show the range of model values from worst (green) to best (red) on the display.� Figure 3 shows the results of one such analysis.
An additional feature allows the user to point on the map and identify the items, values, and weights for every theme in the model.� This allows the user to simply point at a selected location and break down the exact values from the model selection criteria.In this manner a particular point can studied in detail to determine reasons for a high (or low) model score.
The ArcView application can process the model quite rapidly for the simulations in this project.� Run times were typically less than 30 seconds using a cell size of 10 meters and an analysis extent of the View display.� The programs can easily be altered to increase the extent of analysis (resize the View) or the cell size (change to one line of code).� This allows a somewhat course analysis of a large area and then refining the model for a detailed look at a promising area.
The Well Site Prioritization tool is an application that can be used to identify and prioritize future well locations based on a user-specified set of criteria.These criteria, such as water quality, aquifer characteristics, and impacts on existing wells can be specified using shape files in ArcView.� This tool uses cell-based data layers to score and weight each of these factors for the entire region based on selected shape files.The results are displayed as color-coded values identifying the sites that best meet the criteria.�
This tool is a sustainable decision-making tool to aid water resource planners in identifying candidate well sites for future water-supply needs.Because the criteria are formally applied using ArcView, a consistent analysis can be done across large regions, thus making the evaluation process quicker, easier, and more reliable that performing the analysis by hand.� The standard approach makes it easier to accommodate a wide range of criteria in the decision-making process, and provides a consistent mechanism for communication amongst various parties and stakeholders.� In addition, the criteria are easily modifiable, which allows the user to perform a variety of �what if� analyses or to easily make updates as the decision criteria change over time.��
Allan Scott , Regional IT Manager
Brown and Caldwell
Rancho Cordova, CA
Tel: (916) 853-5380
Fax: (916) 635-8805
ascott@brwncald.com
Bruce Rindahl, Project Manager
Brown and Caldwell
1697 Cole Blvd. Suite 200
Golden, CO 80401
Tel: (303) 239-5400
Fax: (303) 239-5454
brindahl@brwncald.com