Using
ArcGIS to Link Urban Stormwater Software (SWMM) and Economic Flood Damage
Analysis Software (HEC-FDA)
By
Thomas
G. Tri, P.E.
Skees
Engineering, Inc.
Louisville,
Kentucky
For
The
Twenty-Second Annual Esri International User Conference
San Diego, CA
July, 2002
Abstract
The U.S. Army Corps of Engineers (COE) applies the HEC-FDA software to calculate expected annual flood damages associated with existing conditions and proposed alternatives of flood control projects. The difference in expected annual damages “without” an alternative and “with” an alternative are the expected annual benefits. The expected annual benefits are then compared to the annual cost of the alternative to compute its benefit to cost ratio. Urban flood damage studies require valuation and elevation data for the structures to statistically determine the expected annual damages. In a highly urban watershed, the gathering and analysis of this data has always been tedious, time-consuming, and costly. The Southwest Louisville Flooding Study provided a special challenge because of the large number of structures in the study area (68,000), the size of the study area (32.0 sq. mi.), and the large amount of data being generated from the urban hydraulics software (SWMM), which modeled a combined sewer area with 4,800 sewer manholes.
GIS proved to be a valuable asset to facilitate the study. The Louisville COE contracted with Skees Engineering to develop GIS applications, which would provide the input for the HEC-FDA model, and to execute the model to obtain the economic impacts for the without project conditions. GIS data from the Louisville and Jefferson County Information Consortium (LOJIC) was used to develop input for the FDA model, including assessed property value, year of assessment, first floor elevation (derived from TIN points), style of structure, property use classification, parcel identifier, and address.
One particularly challenging aspect of the study was to develop a method for determining anticipated flooding depths at each structure, based on the output of the SWMM model. Because the model only provided volumes of surcharge at each node, a method was developed to translate the discharge volumes to a flood elevation for each of the 68,000 structures. Because of the extreme flat nature of the watershed, the discharge volumes spread across multiple sub-basins. A custom ArcGIS/Spatial Analyst/VBA application was developed to iteratively distribute the volumes of water over the localized sub-basins until equilibrium existed across the study area.
Introduction
The U.S. Army Corps of Engineers (COE) applies the HEC-FDA software to calculate expected annual flood damages associated with existing conditions and proposed alternatives of flood control projects. The difference in expected annual damages “without” an alternative and “with” an alternative are the expected annual benefits. The expected annual benefits are then compared to the annual cost of the alternative to compute its benefit to cost ratio. This software was designed for and is traditionally used in riverine flooding situations to determine the economic viability of a flood control project. The application of the model in a highly urbanized area, with a combined sewer system, provides a unique opportunity to use GIS techniques for data management, preparation of data for input to the economic model, and query and display of results.
Urban flood damage studies require valuation and elevation data for the structures to statistically determine the expected annual damages. In a highly urban watershed, the gathering and analysis of this data has always been tedious, time-consuming, and costly. The Southwest Louisville Flooding Study provided a special challenge because of the large number of structures in the study area (68,000), the size of the study area (32.0 sq. mi.), and the large amount of data being generated from the urban hydraulics software (SWMM), which modeled a combined sewer area with over 216 miles of pipe with a diameter of 18” or greater and over 4,800 sewer manholes.
The availability of a highly developed, mature municipal GIS system (Louisville and Jefferson County Geographic Information Consortium – LOJIC), which provided much of the base data (topographic and property valuation data) required for the economic analysis, made the use of GIS software and techniques an obvious choice. The data had to be extracted, manipulated, and formatted for input to the FDA model. This paper discusses several of the unique GIS techniques used to facilitate the development of the economic model for the without project conditions.
Study Area
The study area is located in southwest Louisville, Kentucky (see Figure 1). The area is bounded on the west and north by the Ohio River, on the east by Interstate 65, and on the south by the limits of the combined sewer service area, and excludes the central business district (the area east of Ninth Street and north of Oak Street). The area includes the University of Louisville, historic Churchill Downs, and the northern portion of the Louisville International Airport.
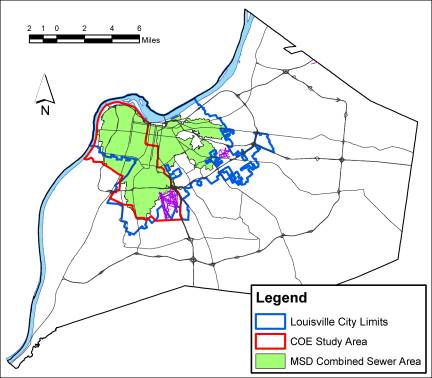
Figure 1 - Study Area
The study area includes 32.0 sq. mi. and is considered highly urbanized and fully developed for the purpose of the H&H analysis. The area includes over 68,000 structures with approximately 89.3% classified as residential, 6.0% classified as commercial or industrial, and 4.7% exempt from property tax (schools, churches, and government buildings). The study area contains approximately 216 miles of combined sewer (18” and greater) and 4,800 modeled sewer manholes.
The area is divided into 5 sewersheds for economic analysis purposes: 1) Ohio River Interceptor (ORI), 2) Northwestern Outfall, 3) Western Outfall, 4) Southern Outfall, and 5) Southwestern Outfall (see Figure 2).
Figure 2 - Sewersheds
Project History
The purpose of the overall project is to mitigate the effects of frequent and severe flooding in Southwest Louisville, which encompasses some of the most densely urbanized area in Kentucky. Recent severe storm events in 1983, 1989, 1990 and 1992 made clear the need for investigation of flood control alternatives. Pursuant to this goal, a reconnaissance level study was conducted during the early- and mid-1990s. The study determined that several alternatives had a favorable benefit-to-cost ratio, and the COE proceeded to the next stage with a feasibility study.
The feasibility study, which began in 1998, used a SWMM model that was developed by the local sewerage utility (Louisville and Jefferson County Metropolitan Sewer District – MSD). The previous model was developed using only 42” diameter pipes and larger, so it was refined to include all pipes with a diameter of 18” or greater, to more accurately model the flooding effects, particularly in the “upper” reaches of each sewershed. The refined model was recalibrated and then used to determine the elevation of the hydraulic grade line (HGL), and the volume of water surcharged from each modeled manhole for the eight events required by FDA (1-yr, 2-yr, 5-yr, 10-yr, 25-yr, 50-yr, 100-yr, and 500-yr). The SWMM model was executed based on 3 different Ohio River stages (normal, 2-yr, and 10-yr) as the pumping scenarios are different for each of these three stages. This hydrologic and hydraulic modeling effort was completed in the Spring, 2001.
The Louisville District COE then contracted with Skees Engineering of Louisville, Kentucky, to determine the flood damages for the without project conditions. The scope included developing GIS applications, and performing the required analysis, which would provide the input for the HEC-FDA model, and executing the model to calculate the damages. The damage calculations are divided into two basic categories: basement flooding and surface flooding. The damages from basement flooding are determined by using FDA to compare the basement floor elevations with the maximum water surface elevations (hydraulic grade line from SWMM). The damages from surface flooding are determined by converting the volume of surcharge from the manholes to a geographic extent with a flood stage. HEC-FDA is then used to determine the depth of flooding at each structure by comparing its first floor elevation to the determined flood stage for the surrounding area.
GIS Aspects of the Project
GIS for Data Management
Throughout
the project, Esri GIS software was used to manage the data. The FDA software
requires two fundamental data elements for each structure - the value and
elevation. The value of each structure was obtained from data provided by the
Jefferson County Property Valuation Administration (PVA) office. The PVA
maintains a database (Real Estate Master File – REMF) of each parcel in the
county with its assessed value as well as certain structure characteristics
(floor area, number of stories, type of construction, etc.). For the purposes
of this study, the assessed value was assumed to be equivalent to the
depreciated replacement value because the PVA office uses the same software
(Marshall and Swift) and data for performing assessments that is “approved” by
the COE. For those properties subject to flooding, that are not assessed for
tax purposes (schools, churches, and government buildings), Marshall and Swift
Commercial Estimator software is used to perform a basic assessment. The GIS
also provided a mechanism to determine property values for those anomaly
parcels without assessment data. This
was accomplished by comparing the values and characteristics of other homes in
the neighborhood.
The
elevation data for the project was obtained by using the elevation mass points
available from the LOJIC terrain data.
These mass points were collected from aerial photography and meet
National Map Accuracy Standards (NMAS) for 1”=100’ mapping and were used to
interpolate 2’ contours. There are no
breaklines used for constructing the DTM, although mass points are placed more
frequently along distinct changes in elevations. These mass points are assumed
to be within ½ contour interval (±1.0
feet) in elevation.
In lieu
of building a surface model for the study area, which would consist of almost 2
million mass points, an ArcView/Avenue script was developed to
semi-automatically determine the ground elevation at each structure. Ground
elevation determinations were made in a three-step process. The first step was
to select the mass elevation points within 5.0’ of a building footprint. If the difference between the highest and
lowest mass points, assuming at least 2 were selected, was less than 1.0’ (the
tolerance defined by the NMAS standard), the elevations were averaged. The second step was to repeat the process on
those buildings whose ground elevation was not determined in the first step
with a distance of 10.0’. For those
buildings remaining, a technician used an Avenue tool that would successively
select each building without an elevation, display the elevation points and
contours around the structure, and select those mass points within 10.0’ of the
building. The user was then able to
deselect mass points, which were distorting the calculation of the average
ground elevation or add additional mass points beyond the 10.0’ limit which
were more representative of the surface elevation. For example, the technician could remove several points that were
placed to define an entrance to a basement garage. The routine then recalculated the average and populated the
ground elevation attribute of the building. After a couple of days, the
operator was able to semi-automatically estimate the ground elevation for over
1,000 structures per 8-hour day using this routine. Figure 3 shows a screen
capture of the application.
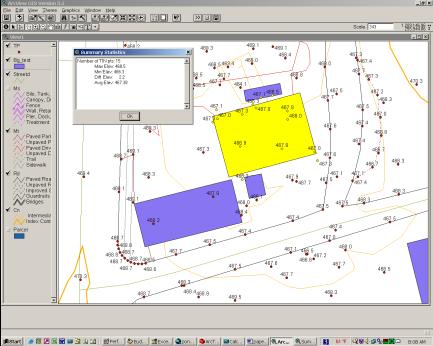
Figure 3 - Ground Elevation Determination Application
The
first floor elevation of each structure was calculated by adding the ground elevation
to the foundation height (distance from the ground to the first floor). The foundation height was determined by
using statistical distributions for various types of structures (i.e. 1-story
frame, 2-story brick, etc.). All basement floor elevations were assumed to be
8.0’ below the first floor elevation.
All
elevation and structure value data were exported to Excel, formatted, and then
imported into FDA.
Associating Structures with SWMM Modeled Manholes
To determine the depth of basement flooding, each structure needed to be associated with a SWMM-modeled manhole and its maximum water surface elevation for the 8 designated events. The maximum water surface elevation at this associated node is then used by FDA to compare with the basement floor elevation to determine depth of flooding.
Initially, using the ArcInfo “near” command created this association. This command was used to find the nearest modeled manhole to each structure. Spider diagrams were used to visualize this association (see Figure 4).
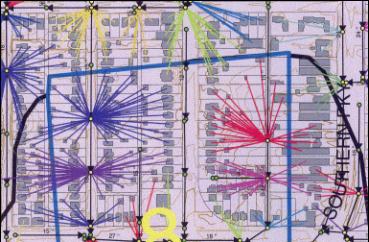
Figure 4 - Spider Diagram of "Nearest" Modeled Manholes to each structure
The light green circles represent manholes in MSD’s facility inventory and the yellow manholes are those modeled in SWMM. The multi-colored lines indicate which manhole is associated with each structure. This map illustrates that the buildings in the center of the map are incorrectly associated with those modeled manholes on adjacent streets. For example, near the top center of the map, those buildings with the light green lines are closest to a modeled manhole for which there is no connectivity with the sewer line in the street in front of the building.
An ArcInfo AML was developed to better associate a building with an appropriate modeled sewer manhole. Each building was associated with the nearest pipe segment (whether modeled in SWMM or not). The upstream and downstream nodes were checked to determine if either was modeled in SWMM. If only one node was modeled, that manhole was assumed to be associated with that structure. If both nodes were modeled, the closest to the building was associated with the structure. If neither node was modeled, the network was traced downstream until a modeled manhole was located. Figure 5 shows the modified association that is more representative of the modeled manhole to each building. The spider diagram for each area was then examined and manually adjusted for any anomalies.
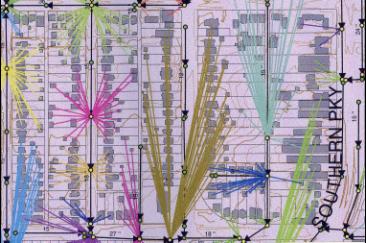
Figure 5 - Spider Diagram After Network Analysis
Determination of Surface Flooding Stages and Extents
The second major aspect of the study was to determine damages due to surface flooding from surcharging manholes. Initially this was done by isolating 15 problem areas based on customer complaints and analyzing them independently. In each problem area, the volume of water discharged was summed from adjacent manholes. The capacity of the area was calculated by determining the volume under each successively higher contour. This method worked for some of the smaller precipitation events, but as the discharge volumes increased for the less frequent events, the surcharge would not be contained within the predefined areas and would flow into adjacent areas. An automated process was developed to account for the interaction between ponding areas.
Skees developed a semi-automated procedure for determining the ponding limits and stages based on the volumes discharged from the SWMM model. This approach is based on using the GRID capabilities within ArcInfo. Following is an outline of the steps for this procedure:
- First, the LOJIC mass elevation points were converted to a Digital Elevation Model (DEM) with the ArcInfo Spatial Analyst extension for Arc8. This DEM was created using inverse-distance-weighting (IDW) and a cell size of 25' during the testing phase of the application. This cell size may be increased during the production phase of the process if the amount of execution time is excessive. Figure 6 shows the DEM created for the application development and testing phase. The white is the area of highest elevation and the yellow is the lowest. The blue pentagon delineates one of the original problem areas.
Figure 6 - DEM with 25' Cell Size
- The volumes output from each SWMM manhole are aggregated (if more than one) in each cell. The volumes divided by the cell area (25 x 25 = 625 sq. ft.) gives a depth of a column of water at each cell.
- This depth grid is added to the elevation grid yielding an elev+depth (stage) grid. A VBA function was developed to migrate these columns of water to the lowest point and then iteratively process each cell in this grid to a state of equilibrium, i.e. until each cell and its eight neighboring cells (visualize a tic-tac-toe grid, with the current cell in the center) have the same stage or the stage is equal to the elevation at that cell. (The stage can't go below the ground).
- Cells whose stage is greater than the elevation are selected, yielding the ponding limits. These limits for each stage are converted to a shape file for use in overlay analysis.
A VBA script was developed to combine the last 3 steps above as the DEM will be unchanged for each analysis. This process will be executed for each event (1yr, 2yr, ... 500yr) for each river stage (normal, 2-yr & 10-yr) so that the correct elevation will be determined along with the ponding limits for each event / stage combination. The following maps show the output for the 100-yr, normal river stage event.
Figure 7 - Depth Grid
Figure 7 shows the depth of ponding output from the automated VBA script. Darker shades of blue indicate deeper ponding. The green polygon is the elevation 464 contour, which was the next highest contour, which would contain the surcharged volume from the predefined problem area (the blue pentagon).
Figure 8 - Stage Grid
Figure 8 shows the stage grid from the same event. Darker shades of magenta indicate a higher stage.
Figure 9 - Stage Shape File
Figure 9 shows the stage grid converted to a shape file with the stages rounded to the nearest 0.1’. The results agree closely with the stages, which resulted from the analysis using volumes between contours. This method also predicts the flooding outside the assumed problem area (notice the lower right portion of the map).
This process is executed against the entire study area and is not restricted to the individual 15 problem areas. This method automatically accounts for the interaction between ponding areas as the system reaches a state of equilibrium.
Results and Conclusions
This project provides an example of analysis that would not be practical using methods other than GIS. GIS provided the ability to adeptly manipulate all the required data sets. Without GIS, sampling techniques would have been required. GIS allowed a full study of all structures in the study area.
Although this study was for mitigation of urban flooding,
some of the same techniques could be used for riverine flooding.
References
U.S. Army Corps of Engineers – Louisville District, Southwest Louisville Interim Reconnaissance Report, May 1996.
Louisville and Jefferson County Information
Consortium Online Data Documentation, LOJICDOC, http://www.lojic.org/lojicdoc/lojicdoc.pdf
Acknowledgements
Skees Engineering would like to acknowledge Michael Moore,
Project Manager with the Louisville District of the U.S. Army Corps of
Engineers, and Angela Akridge, P.E., Project Manager with the Louisville and
Jefferson County Metropolitan Sewer District for their assistance with this
project. We would also like to acknowledge Skees’ staff’s skill and patience
during some of the process development. Several methods were tried before
coming up with a satisfactory solution. The author would also like to
acknowledge the expertise of Neil J. O’Leary, who is conducting the economic
analysis portions of this project.
Without his knowledge, wisdom, and guidance in the use of HEC-FDA for
economic analysis of flood control projects, this project would not have had as
successful an outcome.
Contact Information
Thomas G. Tri, P.E.
GIS
Manager
Skees
Engineering, Inc. (http://www.skees.com/)
400
Blankenbaker Parkway, Suite 300
Louisville,
KY 40243
Voice:
502.254.2344
Fax: 502.254.3008
C. Michael Moore
Project
Manager / Civil Engineer
U.S.
Army Engineer District, Louisville (http://www.lrl.usace.army.mil/)
Planning,
Programs and Project Management Division
600
Dr. Martin Luther King Place
Louisville,
KY 40202
Voice: 502.315.6889
Fax: 502.315.6864
mailto:Michael.Moore@lrl02.usace.army.mil
Angela L. Akridge, P.E.
Wet
Weather & Water Quality Team Leader
Louisville
and Jefferson County
Metropolitan
Sewer District (http://www.msdlouky.org/)
700
West Liberty Street
Louisville,
KY 40203-1911
Voice: 502.540.6136
Fax: 502.540.6365