Cobb County, located adjacent to Atlanta Georgia, grew from a rural community in 1950 to an urban metropolitan community with a population of over 608,000. The physical expansion and growth of municipal governments has paralleled the overall growth of the county. Comprised of six cities, Marietta, Powder Springs, Acworth, Smyrna, Kennesaw and Austell, Cobb County is the third largest county in Georgia.
The six cities within the County must petition the county Board of Commissioners to annex portions of the county into their corporate boundaries. Because the county and city governments are distinct and independent bodies, each approved petition translates into an overall loss of revenue for the county government. For example, revenue from building permits and property taxes are lost to the petitioning city. The annual financial loss of county revenue could potentially add up to millions of dollars. To help Cobb County government evaluate the financial and service delivery impacts of each annexation petition, Cobb County GIS developed the County’s Municipal Annexation Model in ArcView GIS.
Cobb County’s Municipal Annexation Model is an ArcView 3.x extension that measures the economic impacts of proposed annexations. It enables the calculation of the potential loss of revenue in matter of minutes. Clear concise reports are generated to provide factual information to key decision makers.
Cobb County is faced with many issues related to city annexations of unincorporated property, which include population and housing density, impact on infrastructure, and quality of life. Annexation by six cities over a 10-year period has resulted in 4% less land (approximately 14 square miles) and 6% less population (approximately 36,000 persons) in unincorporated Cobb County.
Designed and built by Cobb County staff, Cobb County’s Municipal Annexation Model produces factual information on proposed annexations. Factual information is essential to elected officials who are considering annexation requests. This information can also be communicated, through maps and reports, to citizens and businesses impacted by proposed annexations. Some of the benefits of the model include:
Determination of potential losses of revenue due to annexation involves identification of the various sources of revenue that are likely to be affected by an annexation. Three major fund categories were identified: General Fund, Fire Fund, and E911 Fund.
The General fund category consists of business license fees, building permit fees, cable television franchise fees and miscellaneous permit fees (beer excise taxes, hotel-motel excise taxes, liquor excise taxes, wine excise taxes, beer licenses, liquor licenses, wine licenses and Sunday sales permits). The E911 Fund category consists of the E911 system fees while the Fire fund category consists of Real Property tax, Personal Property tax and Motor vehicle license fees. Building Permit fees are collected for every unit of building permitted for development in the County.
Data inspection shows that individual revenue streams generated from business licenses, miscellaneous licenses and real property tax exist in database tables containing a situs address field. Geocoding revenue sources with situs address field spatially locate them within the County and provide easy identification of their locations within an annexation area for further analysis.
Revenues generated from cable television franchise, building permits, E911 system fees and motor vehicle licenses exist in databases without a situs address field. An alternative or indirect method was needed to spatially locate and identify those within an annexation area.
A separate Building permit fee field has to be added as a part of the attributes of the annexation area data.
Four different methodologies were used to spatially locate information: geocodidng, spatial averaging, extracting information from from data attributes and avenue scripting.
Business license fees are general fees paid by establishments in order to operate. Miscellaneous licenses are individual taxes paid by beer, liquor and wine related establishments. Property tax is paid on a property and is determined by the assessed value of the property multiplied by a millage factor. Personal property funds are taxes paid on operating equipment and inventory owned by business establishments.
Losses in revenue are incurred when a businesses establishment or a property is lost to the annexing city.
The business address was used to address-match or geocode the database tables to produce a shapefile, which spatially locates the business.
Calculation of motor vehicle licenses fees, cable TV franchise fees and E911 fees is challenging because the databases containing them do not have situs address field that would allow them to be geocoded.
The 2000 Census Block Group shapefile for Cobb County is used to get the around the problem of geocoding. The essence of using this shapefile is to enable distribution of estimated values of the various fund elements within a census block group. For example, the attributes table of the census block group shapefile contains two essential fields, number of households and area of each census block group. We averaged out the population of each census block group by dividing the population by the area (in square feet) to obtain population per square foot. The distributed population within a given annexation area is easily calculated by clipping the census block group by the annexation area and multiplying the area of the clipped census block groups within the annexation shapefile by population per square foot.
The following calculations are carried out for the various revenue sources below:
Cobb County E911 department estimates 1.5 telephone lines per household. The E911 fee per phone line per month is $1.25. Four fields are added to the attributes tables of the Census Block Group Shapefile and the following calculations used.
| Field | Formula | |
| Total telephone lines | = | Projected number of households * 1.5 |
| Annual phone fees revenue | = | Total phone line * 1.25 * 12 months |
| Phone fee Per square foot | = | Annual phone fee revenue / Area |
| Potential loss of E911 revenue due to the annexation is therefore calculated as follows | ||
| Sum E911 fees | = | Area of” annexation area” * Phone fee per square foot |
The Tax Commissioner’s office for Cobb County estimates 2.56 motor vehicles per household. Cobb County Government receives $9.51 per vehicle in license fees. To arrive at the possible loss of revenue due to motor vehicle license fees in a census block group, the following fields are added to the attribute tables of the Census Block Group shapefiles and calculated as follows.
| Field | Formula | |
| Total Motor Vehicles | = | Number of Households * 2.56 |
| Total Motor Vehicles Fees | = | Total Motor Vehicles * 9.51 |
| No of Motor Vehicles Per Square foot | = | Total Motor Vehicle / Area |
| Potential loss Motor Vehicle license revenue due to an annexation is calculated as follows: | ||
| Sum Motor Vehicle Fees Loss |
= |
Size of Annexation Area * Number of Motor Vehicles Per Square foot * 9.51 |
The Cobb County’s Communications department estimates that 77 per cent of households in the County subscribe to cable television. The County charges an annual fee of $25.20 per cable TV line. To arrive at the potential loss of revenue due to loss of cable TV franchise customers, three fields are added to the attributes table of the Census Block Group shapefile and the following calculations used.
| Field | Formula | |
| Total Households Cable TV |
= |
Number of Households * 0.77 |
| Total Cable TV Fee |
= |
Total Households Cable * 25.20 |
| Cable TV Fee Per Square Foot |
= |
Total Cable TV Fee / Area |
| Potential loss of Cable TV franchise fee revenue due to an annexation is calculated as follows: | ||
| Sum Cable TV Fee Loss |
= |
Size of Annexation Area * Cable TV Fee Per Square Foot |
Each annexation petition is accompanied by an outline map of the proposed annexation area, the proposed zoning, and estimated number of housing units. The permit cost is standard and based on the type of building unit. Digitizing the annexation area using the outline map as reference creates a shapefile of the annexation area. The attributes table is then populated with the essential information including City, Area in acres, number of proposed building units, total permits cost etc.
| Field | Formula | |
| Potential Loss of Permits Revenue |
= |
Number of Units * Permit Cost per Unit |
The application is driven by a complex array of Avenue scripts. Embedded scripts are used to select, clip and summarize features within an annexation area as well as create map and write impact summaries to the layout. It is ensured that only impacts specific to the annexing city are analyzed.
Impacts are not uniform across the cities but vary depending on what service the county provides to each of the cities. For example, the county provides E911 system service to the city of Acworth but does not the city of Smyrna. Therefore, there will be no loss in the E911 system funds when the annexing city is Acworth, however there will be a loss in this fund if the annexing city is Smyrna.
To ensure the integrity of the model, impacts were therefore classified by city.
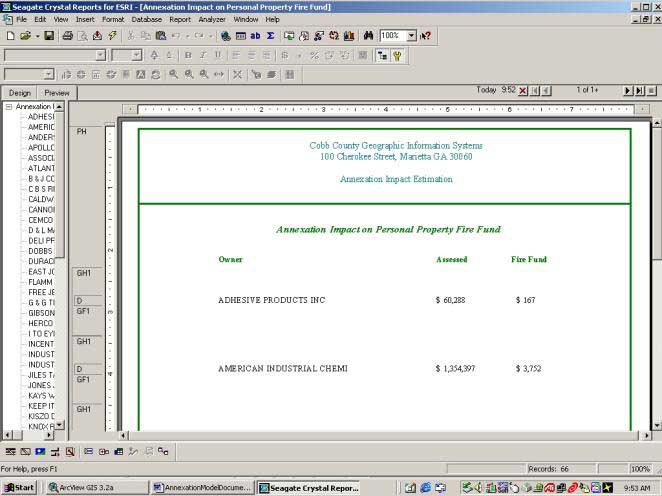
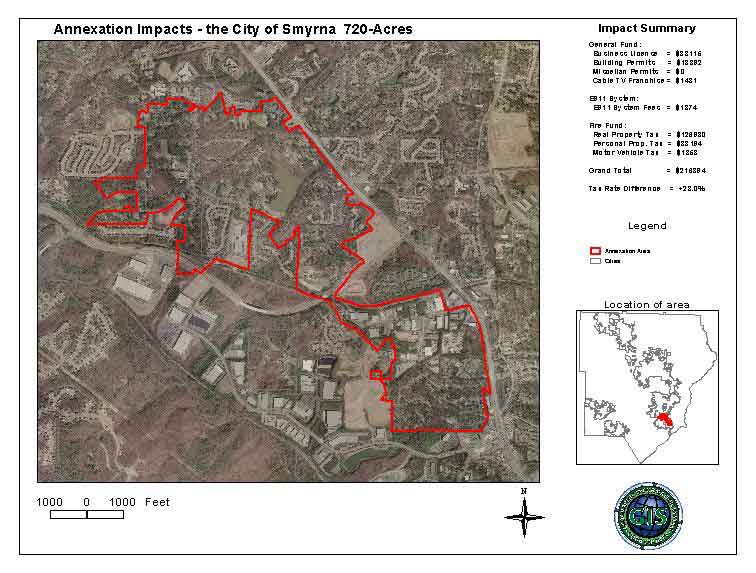
This ArcView 3.x Extension adds three dropdown menus, one button and one tool to the ArcView 3.x View interface and one drop down menu to the Layout interface. From the view interface, the model is run with an annexation area shapefile and individual reports viewed. The map created when the model is run can be opened for viewing and printing. The map layout shows the annexation area, a key map of the location of the annexation area relative to the County boundary and a summary of the potential financial impacts of the annexation. The layout also contains the tax rate difference between the County and the annexing city and reports the difference in percentage. Different reports are created on the annexation area by simply selecting Create Report from a dropdown menu. The report is generated and displayed in Crystal Reports.
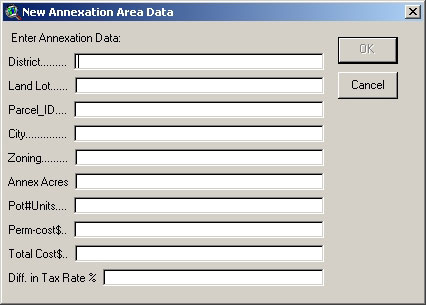
A report on an annexation area can also be run on the fly by defining the annexation area using the New Annexation Area tool. The user enters the required values into a multi-input box that opens up after which a report is created.
From the layout interface, the user views and prints individual reports, which are generated by Crystal Reports, view and print a detailed comparison of property taxes for both the annexing city and the unincorporated County, and navigates back to the annexation view. The detailed report on tax rate difference is based on a $200,000 residential property.
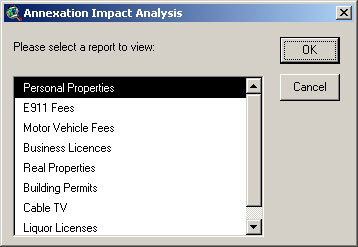
Detailed individual reports on the various revenue items can be viewed in Crystal Reports when the user selects a revenue type from a list box in ArcView.
The Municipal Annexation Model can be readily adapted for use by other organizations - its functionality can be easily adapted for specific jurisdictions. It may require the adoption of standardized naming conventions or minor changes in the embedded codes. Nevertheless, data will need to be developed for specific jurisdictions. Ideally, someone who has basic ArcView GIS training who is capable of creating maps, querying and editing data in ArcView GIS should run it.
The next phase of the model will incorporate impacts to other departments. Impacts to infrastructure of the Water System and Transportation departments will be analyzed. In Public Safety, environmental and social impacts will be analyzed including impacts on 911 response time and crime rate variations. Quality of life comparisons, such as density rates, will be made and incorporated.
Finally, the application will be ported into ArcView ArcGIS 8.x.