Abstract: Urban residential segregation is a scale-dependent phenomenon yet existing structural and spatial indices measure only certain dimensions of segregation at a single-scale. We developed a GIS-based procedure, using ArcView Spatial Analyst, of multi-scale lacunarity analysis for measuring segregation, which can effectively capture multiple dimensions of segregation patterns at multiple scales. We used this method and census tract level data to evaluate residential segregation in Houston, Texas. Our preliminary results show that segregation declined from 1980s to 1990s in traditionally more segregated races and mid to high-income classes, but increased in a traditionally less segregated race and the low-income class. Our case study in Houston calls for a revisit of the Wilson hypothesis.
Residential segregation has been a persistent multi-disciplinary research topic for several decades (Massey and Fischer, 1999; Darden and Kamel, 2000). One of the dominating themes is the controversy revolving the role of race versus class in determining residential segregation. Scholars in several different fields have reported wide-ranging results without reaching a definitive conclusion on the issue. The situation is caused in part by the complexity of the various dimensions of segregation and in part due to the methodological disarray in studies of residential segregation (Wu and Sui, 2001). A variety of methods have been developed to measure different dimensions of segregation by scholars in several different fields. While each of these measures can capture certain aspects of segregation, none of them alone is sufficiently robust to depict segregation comprehensively.
Recently, scholars have also increasingly paid attention to the importance of scale and zoning, more popularly known as the modifiable areal unit problem (MAUP), in segregation studies (Wong, 1997). The MAUP issue, put simply, refers to the fact that analytical results can vary greatly with different geographic scales and zoning schemes. Both empirical and simulation results have shown that the most frequently segregation measure � dissimilarity index (D) is sensitive to scale and zoning. Wong (1993) demonstrated that that segregating measures like D and its multigroup version would increase when the size of the enumeration unit becomes smaller and using smaller areal units produces relatively high segregation measures. The deeper implications of Wong�s work is that firm conclusions regarding segregation can not be drawn at a single scale or zoning scheme because the high sensitivity of segregation measures to scale and zoning. The MAUP effects on segregation measure mandates that segregation patterns must be examined at multiple scales or segregation measures that can capture scale should be developed. There exists, however, virtually no segregation measure that can capture segregation patterns at multiple scales. Also there exist no empirical studies to examine the race versus class from a multi-scale perspective.
In a recent study, we have developed a GIS-based procedure, using ArcView Spatial Analyst, of multi-scale lacunarity analysis for measuring segregation, which appears capable of effectively capturing multiple dimensions of segregation patterns at multiple scales (Wu and Sui, 2001). The goal of this paper is to test this new method using real world data and examine how race and class-based segregations change across spatial scales and time in the context of the Wilson hypothesis.
This paper is organized into four sections. After a brief introduction, a lacunarity-based segregation measure and its implementation in ArcView are described. Section three presents the results for the city of Houston using the 1980 and 1990 census tract level data. The last section contains summary and concluding remarks.
Lacunarity is a scale-dependent measure of spatial heterogeneity or texture of a landscape. It measures the deviation of a geometric structure from translational invariance, or �gappiness� of a geometric structure. Methods for calculating lacunarity were first developed in general terms by Mandelbrot (1983) and several different algorithms of calculating lacunarity have been developed (Gefen et al., 1983; Lin and Yang, 1986; Allain and Cloitre, 1991). A conceptually straightforward and computationally simple "gliding box" algorithm (Allain and Cloitre, 1991; Plotnick et al., 1993, 1996) was used in our calculation. This algorithm exhaustively samples a landscape to quantify contagion and self-similarity over the user-defined range of scales; here contagion refers to the degree to which a mapped attribute is clustered or clumped (O'Neill et al., 1988) and self-similarity refers to a fractal structure that repeats itself over a range of scales (Mandelbrot, 1983). The gliding box of a given size (r, side length of a square box) is first placed at one corner of a landscape, for example, a binary raster map with 1's and 0's. Then the "box mass" S, the number of occupied pixels (1's) within the box, is determined. The box is systematically moved through the landscape one pixel (cell) at a time and the box mass is determined for each of these overlapping boxes. Lacunarity for box size r is defined as: 1 + var(S)/E2(S), where E(S) is the mean and var(S) is the variance of the box mass values for box size r. We developed a straightforward procedure using ArcView Spatial Analyst extension to determine the lacunarity based on the gliding box algorithm (Figure 1) (Wu and Sui, 2001).
Greater lacunarity value (existence of larger gaps) implies less interactions between two groups, and hence the greater degree of segregation. Lacunarity analysis appeared to capture the differences in the degree of segregation between different landscapes better than the aspatial dissimilarity (D) index and its spatial variations taking into account of adjacency (Dadj), common boundary (Dw) and shape of polygon (Ds); and more importantly, it enabled comparison of the degree of segregation between different landscapes at multiple scales (Wu and Sui, 2001).
The lacunarity curve, a log-log plot of lacunarity against box size r, can be used to quantify spatial heterogeneity at different scales and the domains of scale of the spatial pattern. The lacunarity-based segregation measure has the potential to remedy the stubborn modifiable areal unit problem in segregation studies, because (1) it�s raster-based representation of urban landscape provide greater flexibility for re-aggregation and (2) it can indicate the change of segregation patterns across different scales.
Segregation is inherently multi-dimensional (Massey & Denton 1988) and the lacunarity measure can capture those multiple dimensions of residential segregation (Wu and Sui 2001). Segregation is also inherently multi-scale with patterns produced by multiple processes acting at different scales, and scale-dependent measurements such as lacunarity should be used among other measurements to represent this essential aspect of segregation.
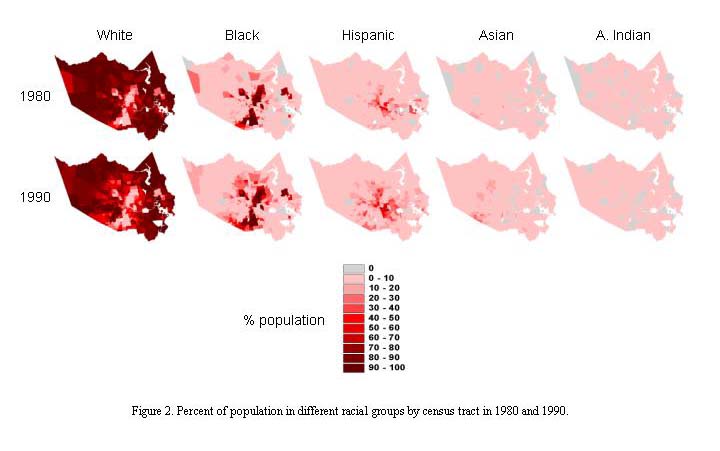
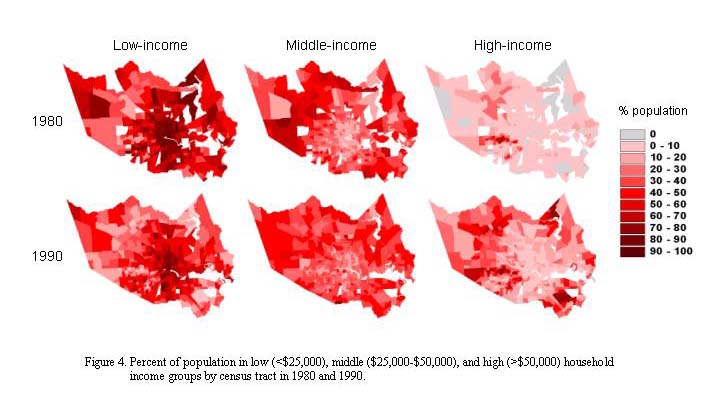
Segregation of different racial and economic groups and their dynamics were investigated using the lacunarity-based segregation measure based on 1980 and 1990 census tract-level data for the city of Houston (primarily Harris county). Vector data of the percent of the population that belongs a particular group in each of the census tracts were converted to raster data with an 1-ha (100m×100m) grid size, assuming uniform spatial distribution of different groups within census tracts. We used three economic groups, low (<$25,000), middle ($25,000-$50,000), and high (>$50,000) household incomes. Lacunarity with box size 100 m to 12,800 m were calculated using the GIS procedure (Figure 1) to develop lacunarity curves for each of the racial or economic groups in 1980 and 1990, respectively. Comparisons of the lacunarity curves were made between groups by year and between years by group to quantify the pattern and dynamics of segregation by racial and economic groups.
In both 1980 and 1990, there were distinctive segregation patterns by race (Figures. 2, 3), with blacks being the most segregated group with high concentration in areas near the urban center. There is, however, a general decline in segregation, especially among smaller scales, among racial groups except for white and Asian groups. Although still the lowest among all groups, segregation of white from other groups increased across scales from 1980 to 1990. The proportion of white in the population was low in 1980 in the census tracts near the urban center and high in areas away from the urban center; it further decreased in a larger area surrounding the urban center in 1990. Segregation of Asians from other groups decreased at small scales but increased at larger scales during the 1980�s. Segregation of Hispanics, which was second highest in 1980, had decreased during the period and became the third highest (lower than both blacks and Asians) among the racial groups. The proportion of Hispanics in the population was high in areas near the urban center and these areas expanded from 1980 to 1990. It appeared although both were in the zone near the urban center, areas with high proportion of Hispanics tended not to overlap with the areas with high proportion of blacks (Figure 3).
Residential segregation by income groups in 1980 was salient, especially between high-income group and middle/low income groups at small scales (Figures 4, 5). The level of segregation of low-income group was slightly lower but similar to that of middle-income group across all scales. Between 1980-1990, segregation of high-income group declined substantially with a decreasing rate as scale increases. Segregation among middle-income group also declined slightly whereas segregation of the low-income group increased appreciably across the scales. By 1990, the level of segregation of the middle-income group had become the lowest and that of there appeared to be a distinctive segregation pattern among three income groups across scales, although the segregation tends to decrease slightly when scale increases. The general trends appeared to be that, based on the proportion of each race in the population in census tracks, low-income group became further concentrated in areas near the urban center and more segregated form others; the middle-income group became more homogeneously distributed across the study area; and the high-income group expanded into more areas but mostly in areas away from urban center (Figure 5).
In summary, there were noticeable declines in racial segregation in Houston across scales during the 1980s, but blacks were still the most segregated group. Segregation of white remained the lowest but increasing, and Hispanics had become less segregated from other groups. Pattern of residential segregation based on economic status changed substantially from 1980 to 1990. High-income group had become considerably less segregated, but the level of segregation of low-income group had increased across scales. Middle-income group had become the least segregated from other groups.
There were significant residential segregation by both race and income in 1980 and 1990, and it appeared that race is still a dominant factor determining urban residential segregation patterns. The direction of changes in both racial and economic segregation varied between groups. Thus, our case study does not provide clear evidence supporting the Wilson Hypothesis, which asserts that residential segregation the US is increasingly defined by socio-economic status (income) rather than race. We are currently conducting our analysis using the newly release 2000 census data at the census tract level.
Wilson�s (1978) hypothesis on the declining role of race has dominated the residential segregation research for two decades since its publication in 1979. Despite the voluminous literature on the role of race versus class in shaping residential segregations, scholars have reported conflicting evidence in the literature (Wong, 1998; Darden and Kamel, 2000). We attribute this disarray in residential segregation studies partially to the lack of explicit consideration of scale in the research. In this paper, we conceive that urban residential segregation is a scale-dependent phenomenon, and yet all existing structural or spatial indices measure only certain dimensions of segregation at a single-scale. Inspired by new metrics used by landscape ecologists to measure landscape heterogeneity, we developed a multi-scale, lacunarity-based segregation measure. Using data from the Houston metropolitan area, we tested our new methodology and found that the temporal trends of residential segregation, based on both racial and economic groupings, exhibit complexity and cannot be conclusively summarized with a simple trend as suggested by the Wilson Hypothesis. This calls for a reexamination of the Wilson Hypothesis with more multi-scale and multi-dimensional research on residential segregation.
Allain, C. and M. Cloitre. 1991. Characterizing the lacunarity of random and deterministic fractal sets. Physical Review A 44: 3552-3558.
Darden, J.T. and S.M. Kamel, 2000. Black residential segregation in the city and suburbs of Detroit: Does socioeconomic status matter? Journal of Urban Affairs 22: 1-13.
Gefen, Y., Y. Meir and A. Aharony. 1983. Geometric implementation of hypercubic lattices with noninteger dimensionality by use of low lacunarity fractal lattices. Physical Review Letters 50: 145-148.
Lin, B. and Z.R. Yang. 1986. A suggested lacunarity expression for Sierpinski carpets. Journal Physics A 19: L49-L52.
Mandelbrot, B. 1983. The Fractal Geometry of Nature. Freeman, New York.
Massey, D.S. and N.A. Denton. 1988. The dimensions of residential segregation. Social Forces 67(3): 281-315.
Massey, D.S. and M.J. Fischer. 1999. Does rising income bring integration? New results for Blacks, Hispanics, and Asians in 1990. Social Science Research 28: 316-326.
O'Neill, R.V., J.R. Krummel, R.H. Gardner, G. Sugihara, B. Jackson, D.L. DeAngelis, B.T. Milne, M.G. Turner, B. Zygmunt, S.W. Christensen, V.H. Dale and R.L. Graham. 1988. Indices of landscape pattern. Landscape Ecology 1: 153-162
Plotnick, R.E., R.H. Gardner and R.V. O�Neill. 1993. Lacunarity indices as measures of landscape texture. Landscape Ecology 8: 201-211.
Plotnick, R.E., R.H. Gardner, W.W. Hargrove, K. Prestegaard and M. Perlmutter. 1996. Lacunarity analysis: A general technique for the analysis of spatial patterns. Physical Review E 53: 5461-5468.
Wilson, W.J. 1978. The Declining Significance of Race: Blacks and changing American institutions. Chicago, IL., University of Chicago Press.
Wong D.W.S. 1993. Spatial indices of segregation. Urban Studies 30(4): 559-572.
Wong, D.W.S. 1997. Spatial Dependency of Segregation Indices. The Canadian Geographer 41(2): 128-136.
Wong, D.W.S. 1998. Spatial Patterns of Ethnic Integration in the United States. The Professional Geographer 50(1): 13-20.
Wu, X.B. and D.Z. Sui. 2001. An initial exploration of a lacunarity-based segregation measure. Environment and Planning B 28(3): 433-446.