Rose Dopsovic, DynCorp & Mark D. Penton P.E., US Army Corps of Engineers
ABSTRACT
The Black Warrior and Tombigbee Rivers have been important commercial waterways since the earliest settlers moved inland and built homes along the banks of the river. Today, the navigation improvements that make these waterways among the most important in the Southeast have also stepped into the 21st century by incorporating a web-based navigation information system.
Using the state-of-the-art Geographic Information System (GIS) technology, an Internet Map Server (IMS) has been implemented to provide waterway users with channel condition information in a graphical and easily maintainable format. This system is dynamic and able to easily convey any number of geo-referenced attributes that the Tuscaloosa Site Office maintains.
This web-based interface allows the user direct access to river information and includes the capability to zoom in/out, turn on/off specific map features, perform queries based on river mile or colloquial geographic names, and print maps at several selectable scales.
Using a compilation of web technologies, such as JavaScript, XML, and ASP, a customized IMS interface has been created for this waterway mapping website. All users, regardless of skill level, have the ability to retrieve and analyze a wide variety of information all through their web browser.
INTRODUCTION
The Black Warrior and Tombigbee Rivers have been important commercial waterways since the earliest settlers moved inland and built homes along the banks of the rivers. Today, the navigation improvements that make these waterways among the most important in the Southeast have also stepped into the 21st century by incorporating a web-based navigation information system.
The Tuscaloosa, Alabama Site Office (TSO) is responsible for all site-specific administration of navigation, hydro-electric generation and recreation management activities along the Black Warrior-Tombigbee Waterway including the Locust Fork, Mulberry Branch, and the Alabama-Coosa Waterway. To assist in maintaining channel navigation over this expansive geographic area, the TSO has adopted a state-of-the-art Geographic Information System (GIS) technology that provides waterway users with channel condition information in a graphical and easily maintainable format.
This new technology of an Internet Map Server (IMS) allows individuals and organizations to create maps, integrate information, visualize scenarios, present powerful ideas, and users interactively on the Intranet or Internet. Specifically, this waterway IMS allows the user direct access to river information and includes the capability to zoom in/out, turn on/off specific map features, perform queries based on river mile or colloquial geographic names, and print maps at several selectable scales.
THE PROBLEM
|
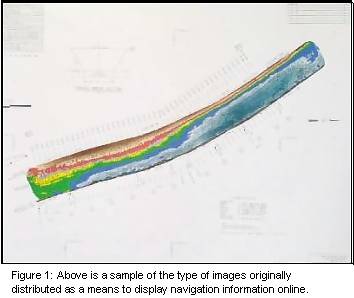
Figure 1: Above is a sample of the type of images originally distributed as a means to display navigation information online. |
The above processes were an attempt to develop a type of navigation information system. However, the problem with this type of data management was that the *.JPG files being used required multiple, time-consuming steps to complete with an end result of the public having access to images that are not interactive, dynamic, or to scale.
THE RESOLUTION
As an initial resolution to this problem, the Spatial Data Branch in the Mobile District of the US Army Corps of Engineers integrated the latest in GIS and IMS technologies. This new approach opened users to the GIS capabilities inherent in a desktop ArcGIS environment, however now these processes and tools were available through a commercial Internet web browser.
Serving maps and GIS data on the web allows the TSO to communicate with its staff and clients interactively on the Intranet or Internet. A boat captain, while connected to the Internet site, can call up the river’s IMS site, plot his location, and then view the latest bathymetric, channel depths or navigation hazards acquired for his location.
Critical to the long-term success of this effort has been the establishment of an automated procedure for updating and maintaining the Internet web information. Utilizing custom tools designed for ArcMap, users can update the bathymetric datasets with the most current survey points. And now, with the introduction of Esri’s Internet Map Server (IMS) 3.1, the TSO has the ability to directly upload the updates to any section or subset of survey data by overwriting only the newly surveyed areas and view the posted data online instantly.
THE "HOW TO"
The online mapping service for the Black Warrior/Tombigbee waterways project was originally developed with Esri’s Internet Map Server 3.0. This ArcIMS architecture has been specifically engineered to serve GIS data and services over the Internet. Through Esri’s many years of experience in providing Web-enabled GIS, ArcIMS is proves to be successful in powering large-scale Internet mapping sites.
Since project requirements extended outside the basic, out-of-the-box IMS 3.0, numerous customizations to the online mapping interface were created using a compilation of web technologies, such as JavaScript, XML, and ASP. As a result, all users, regardless of skill level, have the ability to retrieve and analyze a wide variety of information all through a simple web browser.
Real-time user interaction with waterway maps was the primary objective of this mapping project. In order to create this type of forum, a map service was created with Esri’s ArcIMS. A map service is a "live" map that is published over the Internet. The map publisher defines the map content and geographic coverage. A map service can contain one or more data layers (e.g., water bodies, street lines, city points) depending on the purpose of the map. The Black Warrior/Tombigbee waterways project has over 100 layers of vector and raster data.
One of the many benefits serving raster information over the web via an IMS format is that image compression formats, such as Lizardtech’s MrSid, are supported. The file size of raster imagery easily can exceed hundreds of megabytes, and posting a jpeg of that size will result in non-practical download times. As a resolution to this problem, the map service works behind the scenes and translates the compressed image into a basic jpeg image, which is then displayed. Each time a new pan or zoom scale is requested, the map service regenerates the map and produces another jpeg image from the compressed imagery. Over a 56K connection, the Black Warrior/Tombigbee waterways project loads all layers of information, totaling over 350 megabytes, in less than ten seconds.
THE DATA
Using an ArcIMS platform has allowed the Tuscaloosa Site Office to exchange, integrate, and analyze data all within a simple browser interface. Geographic data has been integrated from multiple sources for localized query and analysis. Users from all over have browsed the site searching for the latest navigation updates for the Black Warrior/Tombigbee and Alabama River waterways. However, before the ArcIMS site was ever established, a GIS was first put in place.
A Geographic Information System can only be as accurate as the precision of the data. All data used in this system has been taken from the latest surveys and imagery available for this region. Some data, such as the bathymetry and navigational hazards datasets, are updated on a weekly basis. This ArcIMS site was created as a navigational aid; and therefore it is imperative that, as developers, we have access to and distribute data that accurately represents near real-time river conditions.
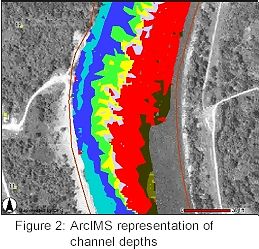
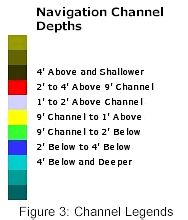
Channel navigation depths can be accessed through any bathymetric data layer. A contiguous representation of water depths is usually denoted with TINs or grid surfaces, however with the original version of ArcIMS, this type of representation was unavailable. To remedy this problem, color-filled polygons (Figure 2) were originally created in ArcView 3.2a with the use of Spatial Analysis. The individual colors of the polygons distinguish channel depths (Figure 3). To create the color-filled polygons, a grid surface was built per each bathymetric data point set. These grid surfaces were then reclassified into eleven classes, based on the Mean Surface Level for each dataset. With the advent of ArcGIS 8 the above process, which originally totaled about an hour per dataset, has now been completely automated. This update process, now under three minutes, can be executed as soon as channel depth surveys arrive and posted on the IMS site, in the correct format, in a matter of minutes. The final product delivered in the Internet browser looks very similar to the original static maps that were first published on the Internet by the Tuscaloosa Site Office (Figure 1), but now users has full interaction with the map.
|
|
|
THE INTERFACE
The initial interface screen (Figure 4) includes a map of the entire project and a query window that allows the user to query based on a specific river mile, local geographic name, shoal mapping or by a Federal Project Map. From this initial window and map, the user may elect to use any of the array of tools located in the upper left corner of the display. As mentioned before, there are over one hundred layers in this mapping project, therefore, each layer is granted a visible zoom extent. Once the user has zoomed in/out, the table of contents will expand/shrink to include all available layers for that zoom scale. These layers (see Table 1) may be toggled on/off to tailor the user’s need, however, the initial default screen is designed for barge navigation therefore, only very general layers of information are visible. River navigation layers include panchromatic imagery, color contoured water depths and adjacent land elevations, very similar to information on the existing web site (see Figure 1). Once the user has tailored the map for their use, they will have the option of printing the map to scale at a multitude of standard plot sizes.
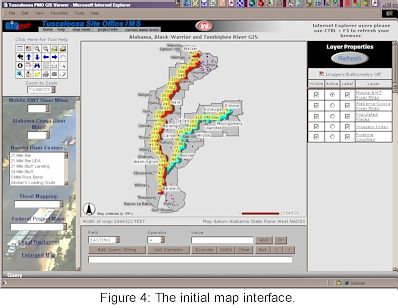
The “Query Window” allows the user to quickly find, zoom, and display multiple layers of information. These quick find tools query an external Microsoft Access database through scripts written in ASP (Active Server Pages). The Access database is populated with additional information not already in the layer’s attribute able. This data makes it possible to query and display multiple layers in only one step.
General Map Features |
|
|
Aerial imagery |
Roads, power lines, and pipe lines |
|
Navigation buoys (with automatic update) |
Laser top bank location |
|
Water depths (Color contoured water depths) |
Cultural features |
|
Land contours/lidar mapping |
Yellow Corps’ sign locations |
|
Navigation hazards (training dikes, sunken vessels, other items) |
Survey monument locations (Dredging baseline monuments) |
|
River mile identifications |
Bridges, names and locations |
|
Local geographic names |
Additional digital orthos |
|
Channel station numbers (including 100 ft. cross-section line segments) |
Lower Alabama hydro/topo composite |
|
Low water contour |
Upland Disposal Sites |
Table 1
For example, if a user needs information on “Singleton Bar”. Under the Shoal Mapping option, Singleton Bar can be selected. The viewer automatically displays and zooms to the Shoal Mapping theme for the selection, displays attribute information stored in the Access database and also gives the user the option to turn on the associated image. Else, the user would need to scroll through the many layers in the table of contents, manually zoom to active theme and scroll the table of contents for associated image.
Other customizations, to the otherwise standard IMS interface, include zoom to scale, print to scale, maximize map area, calculate polygonal area, and toggle layer labels. The “zoom to scale” option box always displays the current zoom scale of the map area. Users can use this feature to zoom to standard engineering scales. The customized printing feature has also works with the scale. Once the user selects the “print” tool from the toolbox, they are able to select a paper size and map title. However, some users do not need a printed map to view their data, only the on-screen map needs to be enlarged. For these instances, users can follow the “Enlarged Map” link to produce a full-screen sized, static, map of the display area. To provided user with some online analysis tools, the “Calculate Polygonal Area” tool has been added that allows users to drawn a polygon, and have each length of the line segment determined and total area calculated. For more detailed maps, the “toggle layer labels” feature has also been incorporated in this Internet mapping project. Selecting this option button from the table of contents and refreshing the map service, will label the layer with a pre-determined feature description.
AVAILABLE ONLINE MAPPING TOOLS
 |
A Web-enabled GIS enables users to perform many of the spatial data functions that exist in a desktop environment. Some of these functions include, but are not limited to, displaying and viewing multiple data sets, plotting maps, performing spatial data analysis, and running attribute queries. To aid users in their online mapping experience, the following set of tools is provided. (In order from left to right) |
Toggle between Legend and Layer List: Simply clicking this tool toggles between the map legend and Table of Contents (layer names) on the right side of your screen.
Toggle Overview Map: This tool opens a window that displays the full extent of the map. When a Zoom tool is used, Overview Map uses a small, red rectangle to denote the zoom location. Click on this tool again to turn off the overview map.
Zoom In: To zoom in to an area of the map, click and drag to draw a rectangle over the area of interest. You can also click once on the map to zoom in slightly.
Zoom Out: To zoom out of an area of the map, click and drag to draw a rectangle.
Full Extent: When clicked, this tool zooms to the extent of the entire map.
Zoom to Active Layer: To zoom to the extents of the active layer, first make a theme active by selecting the “Active” radio button in front of the desired theme and refresh map. Then click on the “Zoom to Active Layer” tool.
Back to Last Extent: The view is zoomed to previous extent.
Pan North: Moves the display north, without zooming.
Pan South: Moves the display south, without zooming.
Pan West: Moves the display west, without zooming.
Pan East: Moves the display east, without zooming.
Pan: Click and drag on the display to move to the desired area of the map.
Identify: To display identifying information of the Active theme, select the Identify tool then click on a feature. A popup window will display all information for the selected record within that theme. Close the popup windows when finished.
Query: The Query tool allows the user to search for particular information about the Active theme. When this tool is selected, a Query window will appear at the bottom of the screen. To execute a query, three values first need to be defined, Field, Operator and Value. Using the drop-down menu, select the desired field to query. Then select an operator (=, >, <, LIKE, >=,<=). Next, either type in your value, or to populate the Value field with attributes from the active theme, select the “Get Samples” button. Use the “Add Query String” button to write your query statement, then click the “Execute” button to run your query. All entries that meet the query statement’ s requirements will be highlighted in yellow on the map. A popup window will display the query results. To zoom to the selected entries on the map, simply click on the record hyperlink in the popup window. To refine query results, create the additional query statements and click the “Add Query String” button, then execute the query. To begin a new query, select the “Clear” button. Use the “And”, “Or”, and “Not” buttons to further customize your queries.
Find: This tool performs a quick, case-sensitive text search of the Active Theme. A Find window is displayed at the bottom of the screen. Type in a string of characters, then click, “Find String”. A popup window will open and display the search results. Click on the record number to zoom to that feature on the map.
Set Units: To change map units, click on this tool and select the desired units. Click the “Set Units” button to enforce these changes, or select the “Cancel” button.
Measure: This tool can be used to measure distances on the map. Its units can be changed by using the Set Units tool. To measure a distance, click once at the starting point, then again at the finishing point. The line segment distance will be calculated and displayed at the top of the screen. To remove line segments, click on the Clear Selection tool.
Select by Rectangle: The Select by Rectangle tool is used to select a group of features within the active theme. To use, click and drag diagonally until a box is formed. When the mouse button is released, a popup window will open and display all selected features. To zoom to a particular record, follow the hyperlink of the record number.
Select by Line/Polygon: To select items on the map in an irregular shape, the Select by Line/Polygon tool can be used. Clicking desired locations on the map will create polygons or lines. A succession of clicks will result in a polygon. Click on the “Complete… ” button to run the query. Polygons and lines can be removed by selecting the “Clear Selection” tool.
Clear Selection: This tool removes an “acetate” layers, including, selections, points, lines, buffers, polygons and labels, present on the map.
Place Coordinate Label: This tool places coordinate labels for desired locations on the map. Simply click on a map location and a marker with its accompanying label will appear.
Calculate Polygonal Area: Polygons can be drawn its area calculated when this tool is used. Click on the map to drop point locations for each polygon vertex. To complete polygon, select the “Complete Polygon” button. The area of the polygon will be displayed at the top of the screen. Polygons can be removed from the map by selecting the “Clear Selection” tool.
Buffer: This tool creates a buffered area of a customized width around selected features on the map. Use a selection tool to select features of the active theme. Click on the “Buffer” tool to set the buffer distance. The “Buffer” tool also has the ability to highlight features of an additional theme that may reside in the buffer area. To display these attributes, select the “Display Attributes” checkbox before clicking the “Create Buffer” button. Buffers can be removed from the map by selecting the “Clear Selection” tool.
Print: Clicking the “Print” tool will automatically create the layout, to scale, of the map, based on the format of the user’ s screen. User’s supply title information and the option to display the Overview Map. The map is sent to the printer when the browser’ s print button is selected.
Imagery Select/Manager: Background aerial photography of the Black Warrior, Tombigbee, and Alabama rivers can be quickly added to the map layout by selecting the “Imagery Select/Manager” tool. Use this tool to click on the area of the map where aerial photography is needed. A popup window will display the name of the selected imagery. Follow the image name hyperlink to turn on this theme. Close the popup window when finished.
CONCLUSION
ArcIMS proved to be an excellent service to incorporate into the Black Warrior/Tombigbee waterways project. It provides a diverse set of mapping, location analysis, and navigation aid for all those interested in these waterways. Within a simple browser interface, users can access, display, and interact with data generated from GIS professionals. Users of this IMS website have unlimited access to the most current river conditions, and the ability to query and analyze local geographic data from their home or work computer. This online navigation IMS can be accessed by visiting the Spatial Data Branch Map Room at http://gis.sam.usace.army.mil.
AUTHOR INFORMATION
Rose Dopsovic
GIS Developer
DynCorp/US Army Corps of Engineers, Mobile District
109 St. Joseph Street, Rm. 7029
Mobile, AL 36602-3630
(251) 690-3107
(251) 690-3464 (fax)
Rose.Dopsovic@sam.usace.army.mil
Mark D. Penton, P.E.
GIS Technical Team Leader/Developer
US Army Corps of Engineers, Mobile District
109 St. Joseph Street, Rm. 7029
Mobile, AL 36602-3630
(251) 694-4046
(251) 690-3464 (fax)
Mark.D.Penton@sam.usace.army.mil