(Click on the thumbnail images for the full maps)
This paper presents the use of GIS in Arlington Public Schools (enrollment approximately 19,000) to assess the transiency of a portion of its student population. The assessment looks at the students' addresses and ID numbers and compares them over a five-year period. The project was developed during a redistricting analysis for four elementary schools. A large low-income housing development was razed within the comparison years, and replaced with luxury units. The paper explores the issues of geocoding, joining tables, spatial joins, demographic analysis as well as cartography.
The purpose of this paper is to analyze the use of GIS for assessing the transiency of a portion of the Arlington Public School student population. The paper is divided into several sections. The first section describes the background information. The second section focuses on the task of the study. The third section is on GIS issues. The final section of the paper provides recommendations for future use of GIS for demographic analysis.
Arlington, Virginia is the smallest county in the United States. It is approximately 26 square miles, and is located across the Potomac River from Washington, D.C. The county has a population of approximately 190,000 people. There are over 200,000 jobs in Arlington with service being the majority (44%), followed by Government (29%). Arlington Public Schools (APS) has a student population of approximately 19,000 students. The Civil Rights statistics for the 2001-02 student population are .1% American Indian/Alaskan native, 10% Asian/Pacific Islander, 14.2% Black, 33.9% Hispanic, and 41.8% White. Approximately 90% of high school graduates go on to higher education.
During the 2000-01 school year, APS went through a redistricting process that involved four elementary schools in the county's southeast quadrant. The schools involved were: Hoffman-Boston, Henry, Long Branch and Oakridge Elementary. Hoffman-Boston and Oakridge Elementary schools had been sharing a boundary for many years and the former acted as an annex to the latter prior to being established as its own entity. To view a map of Arlington, Virginia showing the Elementary Boundaries go to http://www.arlington.k12.va.us/departments/facilities_operations/elementary_grid.html
After capital improvements to both Oakridge and Hoffman-Boston, bringing the capacities of each school up to approximately 600 (total 1,200), the School Board decided to undergo a process to establish boundaries unique to each school. Henry Elementary was included in the process because it had significant crowding and could be relieved by the excess capacity available by the newly renovated and expanded Hoffman-Boston Elementary. Long Branch Elementary was included in the process because there were students who were bussed to Long Branch who could walk to Hoffman-Boston.
Many options of possible boundaries were discussed from the fall of 2000 into the spring 2001. The County was divided into planning units (small geographic units that when combined formed the entire county). Students were geocoded and student attribute information from the APS Student Master File (SMF) was attached to the planning units. In addition, projections of student populations were also attached as attributes to the planning units so that what-if scenarios could be played out for both current and future (six-year) outlook.
Questions about the stability of the student population were asked, and specifically whether one of the options would mean that Hoffman-Boston Elementary would have a more transient population than Oakridge. For the purposes of this study, transiency is looked at two ways, first, as the number of students who attend a school in one year who do not return the following school year, and second as the number of students who do not finish the school year in the school they start in.
In order to understand the change in student populations from one year to the next, chart 1, below, shows the number of students attending Oakridge / Hoffman-Boston in one year as compared to a base year. Fourteen comparisons were made. The total number of students who attended in both base and comparison year is presented in the 3rd column from the left. This was determined by comparing student ID numbers from each of the Student Master Files (SMF). To demonstrate the expected change in population over a period of time, the grade level enrollment of the Base year has been included in columns 5-9. Column 10, the column farthest to the right, shows the normal change in population accounting only for grade progression without any attrition or growth. A student who was in first grade in 1995-96 would have 61 schoolmates by 2000-01 who had also attended Oakridge/Hoffman-Boston in 1995-96.
Chart 1| Base School Year | Comparison School Year | Total number of Students from Base school year also in Comparison school year | kindergarten class of Comparison school year | 5th grade of Base school year | 4th grade of Base school year | 3rd grade of Base school year | 2nd grade of Base school year | 1st grade of Base school year | Normal Change over from progression of the grades |
|---|---|---|---|---|---|---|---|---|---|
| 1995-96 | 1996-97 | 600 | 194 | 121 | 315 | ||||
| 1995-96 | 1997-98 | 410 | 178 | 121 | 142 | 441 | |||
| 1995-96 | 1998-99 | 263 | 178 | 121 | 142 | 144 | 585 | ||
| 1995-96 | 1999-00 | 134 | 170 | 121 | 142 | 144 | 146 | 723 | |
| 1995-96 | 2000-01 | 61 | 163 | 121 | 142 | 144 | 146 | 172 | 888 |
| 1996-97 | 1997-98 | 639 | 178 | 131 | 309 | ||||
| 1996-97 | 1998-99 | 425 | 178 | 131 | 143 | 452 | |||
| 1996-97 | 1999-00 | 242 | 170 | 131 | 143 | 157 | 601 | ||
| 1996-97 | 2000-01 | 142 | 163 | 131 | 143 | 157 | 168 | 762 | |
| 1997-98 | 1998-99 | 633 | 178 | 137 | 315 | ||||
| 1997-98 | 1999-00 | 377 | 170 | 137 | 143 | 450 | |||
| 1997-98 | 2000-01 | 234 | 163 | 137 | 143 | 153 | 596 | ||
| 1998-99 | 1999-00 | 561 | 170 | 143 | 313 | ||||
| 1998-99 | 2000-01 | 344 | 163 | 143 | 157 | 463 |
In order to look at transiency year to year the students were matched as follows:
1995-96 to 1996-97
1995-96 to 1997-98
1995-96 to 1998-99
1995-96 to 1999-00
1995-96 to 2000-01
In order to establish whether transiency has been consistent over this time period, the students were matched as follows:
1996-97 to 1997-98
1996-97 to 1998-99
1996-97 to 1999-01
1996-97 to 2000-01
1997-98 to 1998-99
1997-98 to 1999-00
1997-98 to 2000-01
1998-99 to 1999-00
1998-99 to 2000-01
Geocoding the student matched sets in GIS illustrated if transiency varied from area to area.
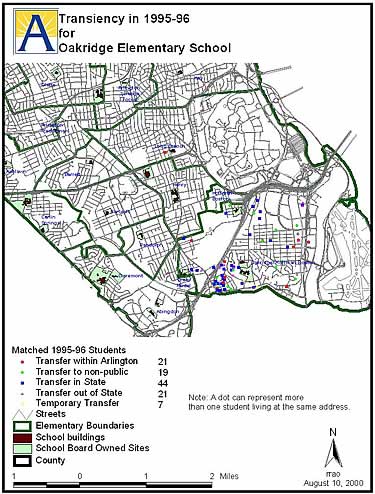
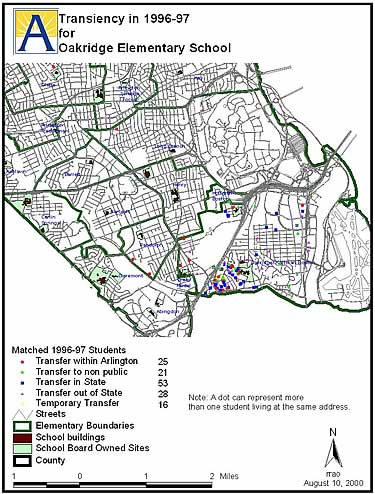
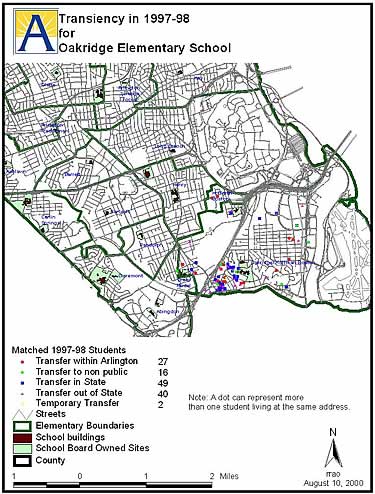
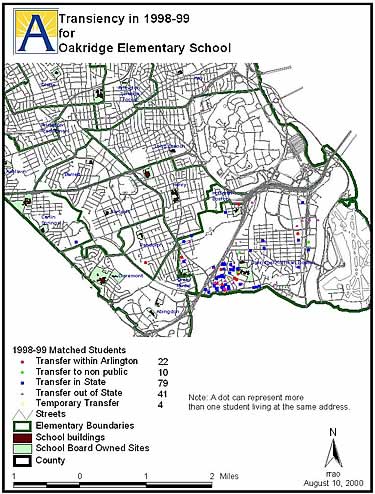
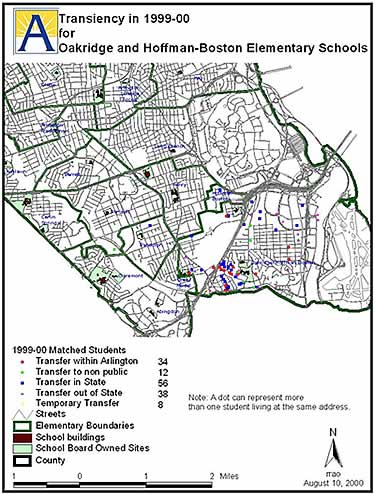
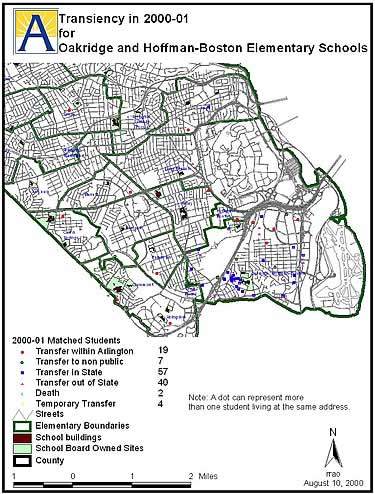
A series of 6 maps is presented below which illustrate Oakridge / Hoffman-Boston students with withdrawal codes in the SMF for 1995-96, 1996-97, 1997-98, 1998-99, 1999-00, and 2000-01. There are six different codes pertinent to these students. Red circles indicate those students who transferred within Arlington Public Schools. Green pentagons indicate those students who transferred to non-public schools. Blue squares represent transfers to other schools in State. Pink triangles represent transfers out of State. Blue stars represent death. Yellow Pins represent temporary transfers. It should be noted that a single symbol on the map could represent more that one student residing at the same address. Also note that from 1998-99 to 1999-00 the vacation of the Arna Valley properties is apparent, located southwest of Oakridge Elementary School. It is interesting that the number of transfers to non-public schools has dropped from 21 (the high in 1996-97) to 7, in 2000-01.
| Transiency for Oakridge and Hoffman-Boston Elementary Schools (Click on the thumbnail images for the full maps) | |||||
|---|---|---|---|---|---|
| 1995-96 |
1996-97 |
1997-98 |
1998-99 |
1999-2000 |
2000-01 |
A street network can be used to Geocode and approximate an address location based on a street segment having an address range, however this is not accurate enough for student populations. The process of address matching to a street network assumes that every address is equally spaced along the line segments. In other words, if the range on a line segment is 2200 to 2300 N Taylor St on the right side and 2201 to 2299 on the left, and the address you are looking for is 2250 N Taylor St, geocoding to the network will place that point exactly halfway down the line and offset it a predetermined amount to the right side of the line segment. While in some neighborhoods this may be a reasonable approximation, many properties are not exactly the same size, more importantly, not exactly the same width. Students need to be matched to as close to 100% accuracy as possible. If a student is matched in the wrong location it could appear that he is attending the wrong school, or has not transferred properly, if there is no special transfer code.
Students attend schools based on geographic boundaries; however, there are numerous reasons that students attend other schools. These reasons include but are not limited to: programs (i.e. immersion, Arlington Traditional, Drew Model, Arlington Science Focus), childcare, and other instructional transfers (APS allows neighborhood schools to accept a certain percentage out of boundary students if the school is not at or above capacity). In order to achieve the accuracy needed students are matched two ways point to point or point to polygon.
To establish student resident locations, students' addresses were geocoded to either an address point or to the centroid of a property polygon. Matching students to single-family home properties is a simple task. The student address listed in the SMF is first checked for proper and consistent spelling of street names. The address is concatenated to be in the form of Street # Direction Street Name Street Type (i.e. 2770 S Taylor St). The attribute table for the property lines file was edited to have an address field in the same format as above. The process in ArcView 3.2 was simply to highlight the right theme (in this case the one for property lines), then go to the View menu and choose Geocode Addresses…. By selecting the proper file names and fields in the dialog box the geocode process begins. Because of the number of addresses needing to be matched the Batch Match option was used.
Arlington has a significant multifamily dwelling population. These properties often have multiple addresses on a single property. This posed difficulty when matching students. In order to make accurate matches of student population a point file was created containing over 5600 points of multifamily addresses. This file is still growing as new addresses are found. The process to geocode to these points is the same as above. First the address points theme was selected then View and then Geocode Addresses….
After performing quality control of addresses, and matching 99% of the students to 100% accuracy, the multiple shape files were merged into one using the Geoprocessing Wizard. From the View pull-down choose GeoProcessing Wizard and then click on merge themes together and select the shape files created by the geocoding process.
The shape file containing Arlington County property lines initially only had limited attribute information but included the shape, size and ID number of the polygon. Tables were joined in order to attach additional property information from the real estate assessment database. To do a join, the attribute table of the property line shape file was open and the real estate data table was open. Both files contain a field with the same name. To do the join, first the field name was selected in the real estate table then the field name was selected in the shape file attribute table (standard from to selection process). Then from the Table menu join was selected.
In order to do boundary option analysis, geocoded students were then assigned planning unit information by performing a spatial join. First, the final geocoded students shape attribute file was open and the planning unit attribute table was open. The shape field name was selected in the students file and the planning unit number field name was selected in the planning unit file. Then from the Table menu join was selected. This allowed cross tab queries to be performed using Microsoft Access.
The schools involved in the boundary process have a very diverse population. When the additions and renewals of the schools took place there was a neighborhood within walking distance to Oakridge Elementary School named Arna Valley that contained the lowest income housing available in Arlington County. A year prior to this process, Arna Valley was redeveloped into Luxury apartments and Town homes (rental of town homes started at $2700/month). The loss of the Arna Valley development meant the loss of substantial student population (greater than 150 elementary students alone). The Arna Valley population was considered a very transient population, and maps1- 6 clearly show the transient nature of that community change as the development is razed and replaced by Luxury units. Interestingly, the population that replaced Arna Valley is probably also transient, however they happen to not have as many school age children.
In order to show the different reasons for withdrawals from APS, unique value symbols were used. Because a symbol on the map can represent multiple students residing at the same address, the number of students by each type of withdrawal code, were included next to the appropriate symbol in the legend. A note on the map reminding readers that a single symbol could represent multiple students, was also included on each map. These were simply typed in using the text editor in the Layout. Different symbols and colors were used so the map could be copied in both color, and in black and white.
In order to be able to use GIS as the tool it is designed to be, significant time for quality control needs to be set aside. The ability to do analysis once the data has been established to be accurate is an incredible asset. The series of maps produced for this project changed some perception that the area proposed in one of the options to be redistricted to Hoffman-Boston Elementary was highly transient, actually turned out to be less transient than the area proposed to be in the Oakridge Elementary district. The ability to query and select student populations and see their spatial distribution is invaluable in school planning. The use of the field statistics also allows for quick analysis of selected sets. When redistricting using basic principles of keeping neighborhoods together, trying to keep students who can walk to a school at that school (various measures of proximity), and alleviating crowding conditions, GIS is the perfect tool to use in order to visualize the proposals prior to them being presented to, modified, and adopted by the School Board.
I would like to thank Chris Blackstone for converting this document to meet the Esri guidelines for submission.
Arlington Public Schools Web address: http://www.arlington.k12.va.us/
Arlington County Web address: http://www.co.arlington.va.us/scripts/default.asp
Robin R. A. O'Hara
Facilities Planner/ GIS Specialist
Arlington Public Schools
2770 S. Taylor St.
Arlington, Virginia
22206
Phone: 703-228-7741
FAX: 703-228-6644
Email: rohara@arlington.k12.va.us