This paper discusses the use with 0.6m (2ft) spatial resolution, multi-spectral, digital airborne ADAR 5500 imagery for mapping illegal immigrant and smuggler trails along the U.S-Mexico border of east San Diego County. The software program Digital Image Made Easy (DIME) is used to perform image-to-base registration and to create a mosaic of more than 200 ADAR image frames in a cost-effective way. Another software program, Feature Analyst ArcView Extension, is used to efficiently extract potential trails based on both the spectral characteristics and spatial context of these features. This study tests the feasibility and efficiency of implementing the two software programs for practical, regular mapping of the trails.
Since Operation Gatekeeper, a strategy to deter illegal crossings from Mexico and divert illegal traffic away from border cities, was launched in October 1994, the illegal traffic has shifted eastward to the remote wilderness areas in east San Diego County. Since Operation Gatekeeper implementation, there has been dramatically increased number of foot trails found in the wilderness area. The trail networks continually change over time and space in response to the U.S. Border Patrol’s operations. The change of trail networks can reveal the movement of illegal traffic across the border. The Border Patrol can deploy the resources more wisely with up-to-date trail network information. The Border Patrol has sought to use Global Positioning System (GPS) and Geographic Information Systems (GIS) to survey patrol roads and migrant foot trails. However, the eastern part of the county is characterized by steep mountains, deep canyons, thick brush, and extreme temperatures, ranging from freezing cold in the winter and to burning heat in the summer. It is very labor-intensive and extremely costly to maintain an up-to-date trail network GIS database over time through ground-based GPS mapping. Remotely sensed imagery provides a viable data source for this mapping task. It is able to provide a full coverage of the operation area in a cost-effective and repetitive way. Satellite imagery has too coarse a spatial resolution to detect foot trails. Digital airborne imagery provides faster delivery time and more radiometric fidelity than the traditional scanned aerial photographs due to the fact that the images are captured directly into digital forms.
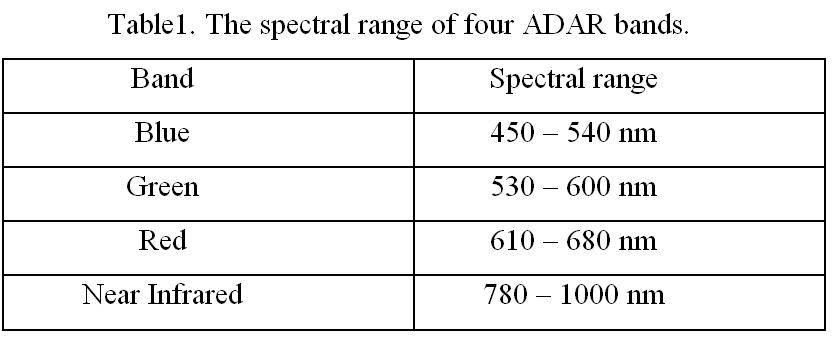
The Airborne Data Acquisition and Registration (ADAR) 5500 system manufactured by Positive Systems, Inc. is an integration of multiple digital cameras, a GPS, an in-flight computer, and custom flight planning and image acquisition software. The GPS receiver provides geographic location coordinates for the center of each image. The Charged Coupled Device (CCD) on each digital camera produces an image composed of approximately 1500 by 1000 pixels. Spatial resolutions of 0.5 to 3.0 m can be obtained from altitudes between 1200 and 6000 m above surface. The Digital Number (DN) value ranges from 0 to 255. It contains four bands, Near Infrared (NIR), red, green and blue. The spectral range for each band is shown in Table 1.
One single ADAR frame with 0.6 m spatial resolution approximately covers 1 square km of ground. To cover a 80 by 1 square km border region, at least 200 ADAR frames with 30 percent overlap need to be mosaicked together for each flight. At least 20 Ground Control Points (GCPs) need to be collected for each image. Therefore, over a total of 4000 GCPs need to be selected between the base image and ADAR images. The remote wilderness areas are distributed with rocks, bushes, and grasses. This makes it difficult to locate GCPs quickly. It is time consuming and difficult to locate accurate GCPs. Digital Image Made Easy (DIME) is a software package that contains a suite of tools to generate GCPs in a fairly automatic way.
After a seamless mosaic image was generated, trails needed to be extracted. Feature extraction from high resolution aerial and satellite imagery still relies heavily on on-screen digitization by image interpreters because humans can quickly and accurately identify such objects by integrating tone/color, shape, and context information. However, this can make feature database development an expensive and time-consuming process. The Feature Analyst extension for ArcView GIS and ArcGIS is a new tool to efficiently extract user-defined geographic features from high resolution aerial and satellite imagery.
This study explored two software packages to map smuggler trails along U.S-Mexico border. The purpose of this study was to develop methods which reduce the time and cost and turn around time necessary to prepare and maintain up-to-date transborder trail maps. Another objective was to transform this mapping task into a production environment by utilizing two software packages, DIME and Feature Analyst.
Positive Systems’ DIME® software is an application program for Windows NT which enables an unsophisticated user to compile overlapping aerial images into a single “mosaic” image.
Unlike existing, highly technical methods for compiling image mosaics (referred to as “photogrammetry” using the process called “orthorectification”), the core methodology used within the DIME™ software for creating image mosaics applies image matching algorithms coupled with tools designed specifically for efficient manipulation of imagery within a large area mosaic.
The image matching algorithms employed within DIME allow the software to automatically identify matching details between two overlapping images, thus creating a “tie point” between those images. When new imagery is processed in conjunction with an existing georeferenced image showing the same project area, the DIME software can create georeferenced imagery by matching the new imagery onto the existing georeferenced image. In this scenario, the previously georeferenced image (often created via the more technical orthorectification methods) is referred to as a ”base” image. The availability of low cost georeferenced imagery has been increasing dramatically in the last few years. Combined with the image matching tools of DIME, new imagery may be quickly and inexpensively georeferenced.
On a more technical level, the DIME software uses tie points between images to calculate a unique rectification equation for each image. An image is “rectified” when it is geometrically adjusted, such as to enlarge or reduce the size of the image, rotate the image, or to make curved lines appear straight or straight lines appear curved. In this context, the rectification equation for each image adjusts the image geometry such that each pixel represents the same amount of area on the ground, and such that the geographic coordinates (latitude and longitude) of each pixel are known, to some degree of accuracy.
Visual Learning Systems’ FA is a new powerful tool for extracting object-specific geographic features from high-resolution panchromatic and multi-spectral imagery. It contains a suite of machine-learning algorithms that learn how to classify user-defined geographic features. In addition to spectral characteristics, the FA is able to use spatial context when extracting features, which is commonly not possible with traditional classifiers. The FA provides a set of tools for removing clutter and adding more representative training samples. This is essential for accurate extraction of features in complex scenes. A learning model library allows users to exchange learning algorithms for selected classes of features and image types. The adaptive user interface hides the complexity of the underlying machine learning system, which makes the software easy to use.
The general study area is located in east San Diego County along the U.S-Mexico border, shown in green in Figure 1.The targeted area stretches from Tecate east to Campo along the border, approximately 32 km (20 mile) of the U.S-Mexico border. Most of the area is remote wilderness area, characterized by hills, canyons, boulders and shrubs.
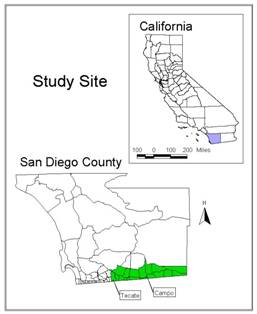
Figure 1. Study site.
ADAR image data with 0.6m spatial resolution was used for this study. Each image frame covers approximately 0.6 km by 0.9 km of ground surface. Color-Infrared (CIR) Digital Orthophoto Quad (DOQ), generated by a private firm from scanned CIR aerial photography, was used as the base image for rectifying and geo-referencing each ADAR image. The CIR DOQ imagery was acquired in August 2000 has a 0.6 m ground sampling distance.
Getting Started
The first step was to create an image mosaic project, which involves specifying various project variables, such as scales of images, image projection information, etc. The attributes of ADAR images are shown in a tabular viewer and the corresponding images are shown in an image window. (Figure 2.) The images can be sorted by a particular attribute in ascending and descending orders, such as Root Mean Square (RMS) error. The images are initially positioned using a GPS file generated when the images were captured. The images, however, were consistently offset a couple of hundred pixels in both the X and Y axises. The images were initially shifted by specifying manual correction coefficients so that the ADAR images were positioned on top of the base image. (Figure 3.)
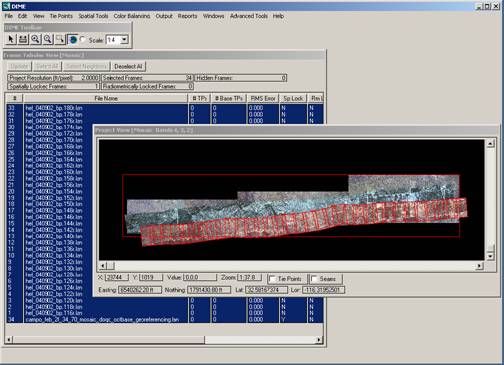
Figure 2. A DIME mosaic project.
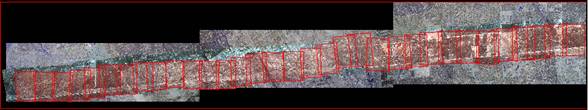
Figure 3. Align the ADAR images to the base image.
Auto GCP Search
After the images were positioned on top of the base image, an Auto Tie Points (ATPs) search was performed. The ATPs parameters selected are shown in Figure 4. A relatively large grid spacing was initially established to create the first set of GCPs so that simple warping functions could be performed. The searching radius was set relatively large because the images had not been closely aligned to the base image. Tie point variance threshold was set to a low to retain more GCPs. However, this increased the post-editing effort to manually check and eliminate false GCPs. For the first pass, only GCPs were evaluated and edited. Tie points search between ADAR frames was not performed.
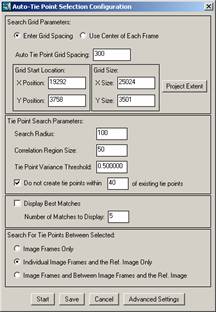
Figure 4. Auto tie points selection configuration.
Figure 5 shows the resulting GCP’s created by the DIME auto search routine. Blue GCPs were those that were within positional threshold limits. Pink GCPs were those that failed. All of the GCPs were checked both in the tabular viewer and graphic viewer. (Figure 6 and 7.) Those GCPs with high distance values in the tabular viewer or which appeared not to be at the same position after being visually inspected with the graphic viewer were deleted.
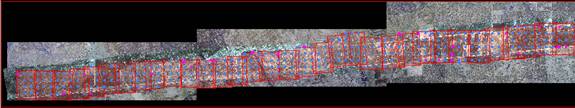
Figure 5. Initial auto GCPs search
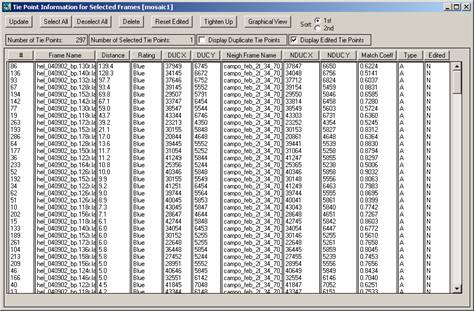
Figure 6. Editing GCPs. Large “Distance” values generally indicate erroneous GCPS.
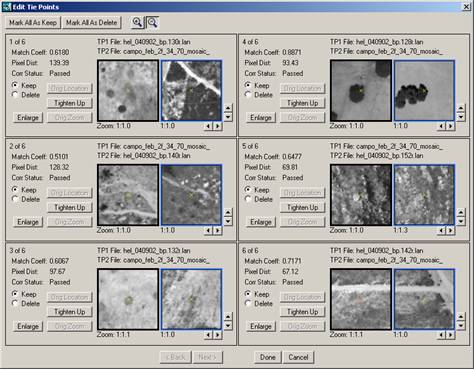
Figure 7. Inspect GCPs in graphic viewer.
After the GCPs were edited, the shift, rotate, and rescale warping functions were performed. The GCPs resulting from the procedures were shown in colors in the image viewer.(Figure 8.) The RMS error threshold values are defined by the operator so that the RMS errors can be viewed spatially by color GCP points. Red represents the GCPs with high RMS errors. Green represents the GCPs with the lowest RMS errors. Yellow represent the GCPs with error values between red and green.
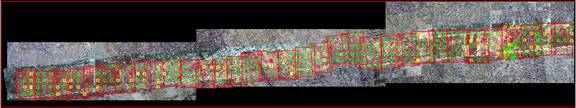
Figure 8. GCPs after warping.
With the ADAR frames more tightly aligned following the shift, rotate, and rescale warping previously, a more extensive auto GCP and tie points search was performed. Smaller grid spacing and search radius were specified. Figure 9 shows the results of the second GCP search process. Yellow dots were the interesting points according to grid spacing and were tested. Blue GCPs are those that passed the tests and pink ones are those that failed.
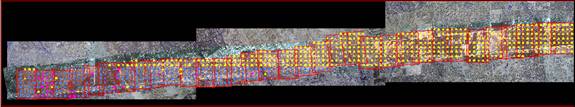
Figure 9. Extensive GCPs search.
Again, the resulting GCPs and tie points were reviewed in both tabular viewers with those points having high distance values further checked in graphic viewers. False GCPs and tie points were deleted. If all GCPs were well distributed across the scene, a second order warping function was performed. If they were not well distributed, either additional auto GCPs were found or manual input as necessary. The warping processes were then performed to improve the alignment. The above procedure is an iterative process. It was repeated until the RMS error was acceptable and GCPs were well distributed across the scene. The iterative process is shown in Figure 10.
Figure 10. DIME GCP editing process.
An independent assessment of positional accuracy was performed using the DIME “Fit to base” function. It is actually the same process as the auto tie points search. However, it locates and utilizes independent check points so that the positional RMS error is not biased. The “Fit to base” check points were visually inspected to see if they are good GCPs. False GCPs were deleted.
When a satisfactory RMS error was reached, a seamless mosaic image was output. (Figure 11.)
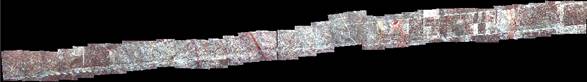
Figure 11. Output mosaic.
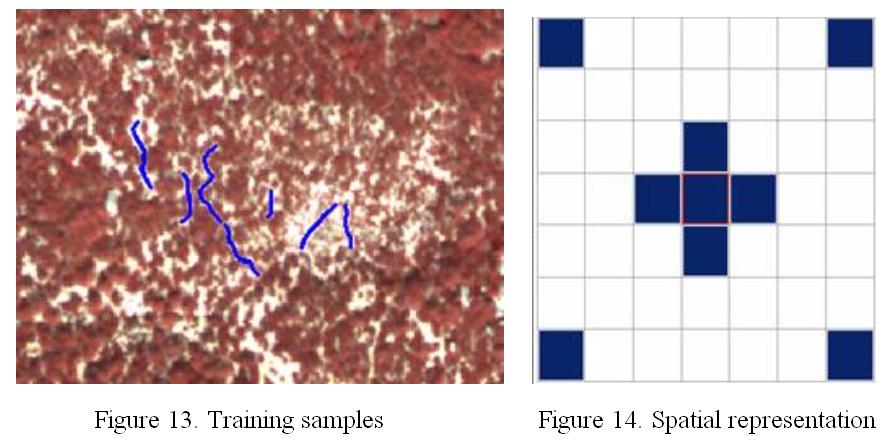
The ArcView FA extension interface is shown in Figure12. The FA extraction process is iterative and simple. First a group of sample trails were identified and digitized from the ADAR image. (Figure 13.) Next variables for the learning process were specified. They were input bands, input spatial representation, etc. All four ADAR bands were used as input. The spatial evaluation pattern is shown in Figure 14. This pattern enables FA to take the spatial context of the targeted and evaluation pixel into account during the classification process. For example, a trail pixel and a unpaved dirt road pixel may only be differentiated by examing their spatial context as their spectral characteristics are very similar. Although very similar spectrally, the trail and dirt road have different widths and shapes. Roads tend to be wide and have constant width while trails are irregularly shaped, with varying widths and frequently covered by overhanging vegetation. The presence of overhanging vegetation along narrow trails makes trail feature extraction more difficult than road feature extraction.
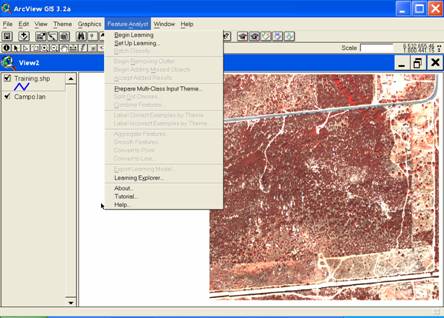
Figure 12. Feature Analyst user interface.
After the learning variables were specified, the FA Learner was trained to recognize the targeted feature pixels and then classify the image. The classification generates a Shape file. Figure 15 shows the resulting yellow polygons from the first search iteration that represent extracted trail pixels. Clutter (noise) was removed and missed examples were added by correcting the Learner through selection of correct, incorrect, and missed examples. The search and classification process was repeated until satisfactory results were obtained. A satisfactory result is shown in Figure 15.
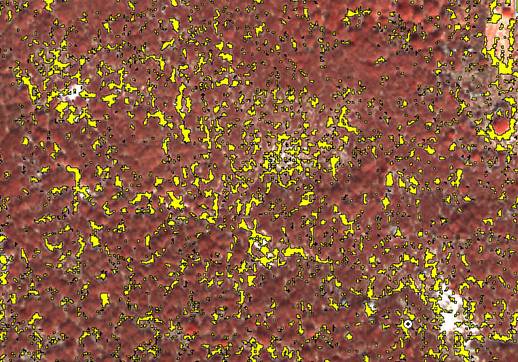
Figure 15. A polygon coverage for trails.
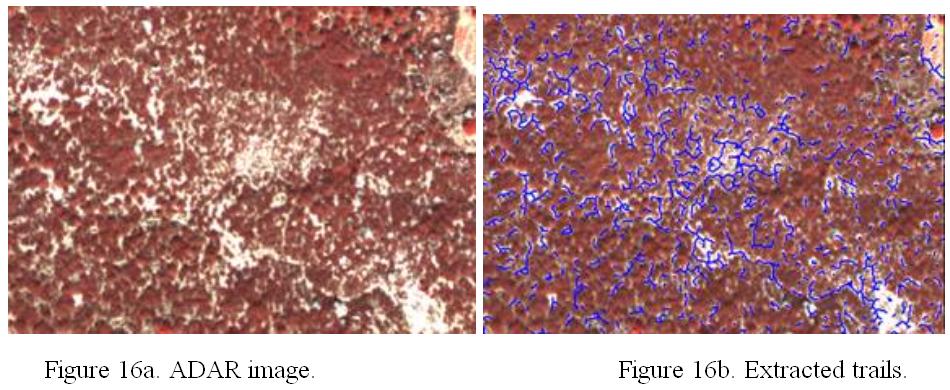
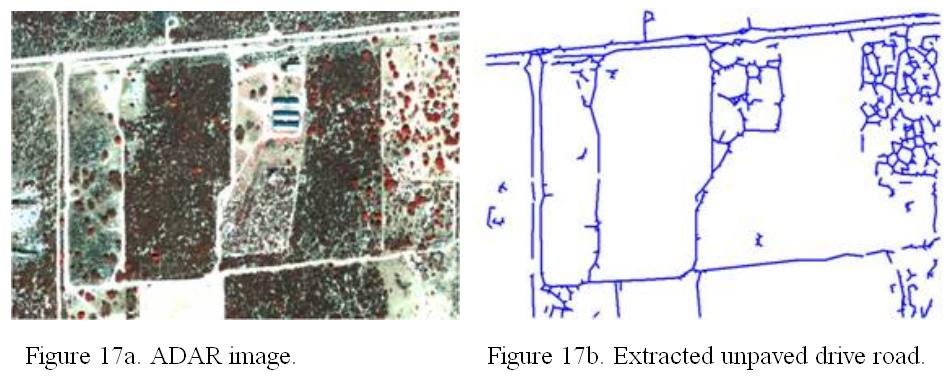
“Aggregation” and “Smooth” functions were used to clear the noise and smooth the trail features. But only a small number of pixels was specified because many trail features were very narrow and are frequently sub-pixel. Finally, “Convert to line” was performed to change polygons to lines so that the trail features can be represented as linear features. (Figure 16b.) Unpaved drive roads were also extracted using FA. The final result is shown in Figure 17b.
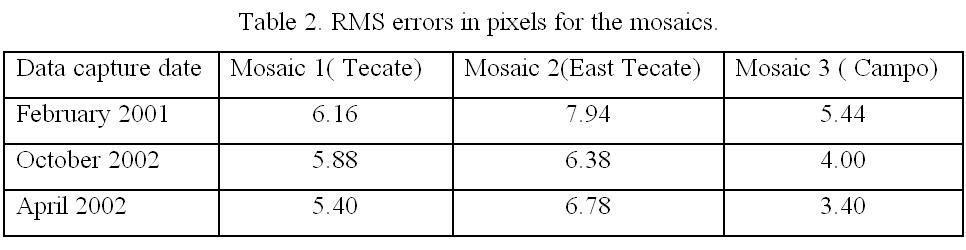
ADAR data capture was completed on February 2001, October 2001, and April 2002. A total of over 200 ADAR frames were used to generate three-date mosaic imagery for trail feature delineation and change detection. Almost all of the GCPs and tie points between adjacent ADAR frames were generated automatically. The operator only needed to quickly assess the error values of the GCPs or the tie points and their distribution across the scene. Each of the GCPs and tie points involved in the final warping was highly accurate in contrast to manually input which can contain human errors. Mosaic generation time is also significantly reduced relative to more manual approaches. Table 2 shows the average registration RMS error values of each mosaic section generated for the border segment. Mosaic 2 had the highest error among the three mosaic images. The high error was due to the rugged terrain and correspond relief displacement within this imagery. The warping model cannot resolve it unless a digital elevation model (DEM) can be incorporated. Mosaic 3 had the lowest RMS error reflecting a nearly flat terrain of the scene.
In this project, DIME has shown a tremendous ability to generate a large and complete image mosaic in a fast and cost-effective manner. Most of the study area is located in remote wilderness, having a highly homogeneous land cover. In such minimumly developed environment, manually selecting GCPs between the ADAR images and the reference image is particularly difficult and time consuming. However, DIME successfully automated GCP generation process.
The FA demonstrated an ability to extract features in an easy and efficient manner. The results of feature extraction using the FA are very encouraging. It correctly classified most of the trail segments not concealed by vegetation canopies. Although, the FA provides a function, “Jump Distance” that can be used to link the fragmented trail segments, it remained difficult to extract continuous trail features due to their poor visibility of trails in the imagery. The FA worked well for more obvious features in the imagery, like unpaved roads that have more spectral and spatial consistent characteristics. Using some enhanced or higher resolution imagery may help to detect the trails more successfully.
DIME is able to generate many GCPs easily. However, it did not help to improve the registration accuracy when using the polynomial transformation model when the number of GCPs was increased dramatically. However, rubber sheeting transformation can be utilized to align the images more tightly using numerous GCPs. This feature is expected to be contained in a future version of DIME.
Trails are changing continuously. The change information is very important for the Border Patrol decision-making. Trail change detection will be explored in future study. The FA learning model that has been used successfully for one date imagery will be applied to a second date imagery to test the replication ability of the learning model.
This study was funded by NASA Affiliated Research Center (ARC) program in collaboration with the U.S Border Patrol’s Enforcement Technology Department, San Diego, California. Significant aerial imagery support was provided by Black Hawk Helicopter, Inc., El Cajon, CA. Special thanks go to Positive System, Inc. and Visual Learning Systems, Inc., Missoula, MT. for their assistance in providing instructions and granting use of their Digital Image Made Easy (DIME) and Feature Analyst software programs for this research.
Lina Cao
M.A. Student
Department of Geography
San Diego State University,
San Diego, CA 92182
Phone: 619-594-5619
E-mail: lcao@typhoon.sdsu.edu
_______________________________
Douglas A. Stow, Professor
Department of Geography
San Diego State University,
San Diego, CA 92182-4493
Tel: (619) 594-8645
Fax: (619) 594-4938
E-mail: stow@mail.sdsu.edu
_______________________________
John Kaiser
ARC Program Coordinator
Department of Geography
San Diego State University,
San Diego, CA 92182-4493
Tel: (619) 594-8645
Fax: (619) 594-4938
E-mail: jkaiser@typhoon.sdsu.edu
http://typhoon.sdsu.edu/ARC/
_______________________________
Lloyd Coulter
Project manager
Department of Geography
San Diego State University,
San Diego, CA 92182-4493
Tel: (619) 594-6973
Fax: (619) 594-4938
E-mail: lcoulter@typhoon.sdsu.edu
_______________________________
Dale R. Johnson
Vice President
Positive Systems, Inc.
223 Baker Ave.
Whitefish, MT 59937
Phone: 406-862-7745
www.possys.com