Identifying the Image of Iowa along Interstate 80: A Method to Increase Public Participation
Christopher J. SeegerThis paper will discuss the method used to remotely collect data identifying what the public perceives as the best examples of the iconic images of Iowa that still exist along the Interstate 80 corridor in Iowa. The information is collected through an interactive Web-based graphic interface and stored in a database file that allows it to be later imported and registered with other data layers in ArcView.
Introduction
As a major east/west transcontinental route across the United States, Interstate 80 traverses 300 miles through the state of Iowa from the Mississippi River in the east to the Missouri River in the west. This corridor provides hundreds of thousands of Americans a glimpse of the "Iowa Image" that consists of the landscape fabric, culture, history and agricultural industry that Iowa is so well known for around the world. Not so long ago, as travelers drove through this corridor they would pass through a historic tallgrass prairie landscape that had been settled by homesteaders, plowed into small fields of corn and beans, and dotted by family farms with red barns, silos, shelterbelts and white houses. Today, this corridor still offers some of these same opportunities to view traditional Iowa as well as the newer agri-industrial and commercial businesses that for which Iowa is known. However much of the landscape fabric adjacent to the corridor is in danger of being destroyed by urban growth and farm consolidation.
Recognizing this opportunity for Iowa to showcase itself to travelers, Iowa State University Professor and Department of Landscape Architecture Chair Timothy J. Keller proposed to the Iowa Department of Transportation the project Maintaining The Image Of Iowa Beyond The Right-Of-Way: A Corridor Management Plan For Significant Natural, Cultural And Visual Adjacencies To Interstate-80. This project called for inventorying and analyzing the landscape: natural, cultural and historic resources within 3 miles of either side of Interstate 80, approximately 2,000 square miles (Figure 1).
 |
|
Figure 1. Interstate 80 Corridor Through
Iowa Showing Towns and Cities
|
From the start of the project in the Spring of 2001, the project team has utilized ArcView and various state and university data sets, to create models for visual quality, ecological protection, landuse and cultural and historical significance. ArcPad and Compaq PDA's are used to collect data from the field.
One aspect of the project is to collect information about what areas the public identifies as scenic or significantly contributing to the "Image of Iowa". To best utilize this information it was necessary to collect the data in a format that could be utilized in ArcView without significant time spent transferring the data to a compatible format. The remainder of this paper focuses on the development of a program that accomplishes this task.
Development of The Data Collection Tool
Tool Requirements
Several requirements for the data collection tool were defined before any solutions were researched.
- Provide cross platform compatibility.
- Store data in a format compatible with ArcView.
- Provide an easy to use interface.
- Collect and store data on computers connected to the Internet.
- Collect and store data on kiosks that do not have continuous Internet access.
- Collect point data representing site element locations.
- Collect line data representing scenic views.
- Allow comments for each line or point to be linked with the data.
- Display ArcView base map data for reference.
- Display aerial photographs or Digital Raster Graphic information such as USGS 7.5 minute quadrangles for reference.
- Georeference collected data in the same coordinate system as the base map data.
- Provide unlimited zooming capabilities.
- Provide visual feedback showing point or line placement.
Several other secondary requirements were also established.
- Allow the visibility of base map layers to be turned on/off.
- Utilize software that can be freely distributed.
- Provide options for discarding entered data.
- Allow for the review and querying of pre-existing data.
- Provide small file size overhead when downloaded from the Internet or installed from a CD.
Due to the need to be able to collect information while either connected or disconnected from the Internet it was quickly determined that ArcIMS would not work. Because ArcView can not be freely distributed and is not intuitive for the novice user that might wish to add data it was determined that another software solution needed to be developed. The use of ArcView in the office did allow for the simplification of one of the requirements. ArcView provides the capability of importing delimited data files and creating point feature shapefiles by plotting geographic coordinates stored in each record of an attribute table, thus if the data collection tool could export a delimited file it could be converted to a shapefile inside of ArcView. Because lines are derived by linking points together, the requirement for line collection was modified so that only the start and endpoints of a line were required.
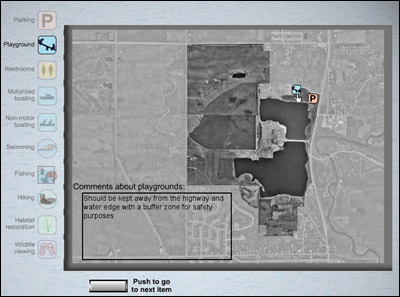
Using Macromedia Flash 5 to develop a previous prototype project called "Digital Charrette" it was demonstrated that Flash was cross platform compatible, worked inside a Web browser or as a stand alone application, could be freely distributed, provided database connectivity, could be dynamically populated with data and provided an extensive scripting language. In the Iowa River example, the public was provided an opportunity to provide the location of features (points) by placing a dot on top of an aerial photo along with a text description (Figure 2). Once placed, the information for the points were sent back to the web server where a CGI script was used to add the X,Y screen coordinate information to a database. The interface of Macromedia Flash also allowed for more complex solutions to be created as demonstrated in the Hallett's Quarry example (Figure 3). In the theoretical Hallett's Quarry project, the public participant could place site design elements such as playgrounds, picnic area, boat access, bird watching and hiking onto an aerial photo that showed the boundary limits of a new park site. Once all the data was collected, the landscape architecture design team could then compile this data and identify where the participating public thought certain features should, if at all, be located in the park.
 |
|
Figure 2. Digital Charrette: Iowa River Points
of Interest
|
 |
|
Figure 3. Digital Charrette: Hallett's Quarry
Park Feature Locations
|
Macromedia Flash Authoring Interface
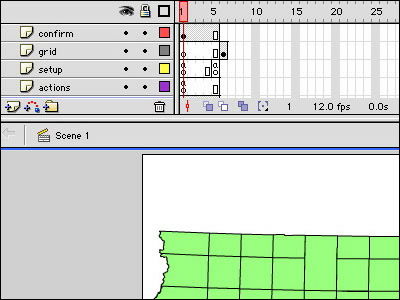
The Flash interface utilizes a timeline cell animation scheme (Figure 4) to organize how, when and where data appears on the screen. The number of frames per second (FPS) setting controls the speed at which the timeline is played. Typically, a timeline is played in a linear sequence, however with Flash's built in scripting language called ActionScripting the timeline can be controlled through user interaction. ActionScript is very similar to JavaScript as it follows the ECMA-262 Standard, the specification written by the European Computer Manufacturers Association that was derived from JavaScript. ActionScripts can be invoked when either a frame is entered by the playback head, a graphic element is selected, a key is pressed or a function is called from another script.
 |
|
Figure 4. Macromedia Flash Authoring Interface
|
The graphics used to create an interface can be either raster or vector formats. Flash can import a wide number of formats including EPS, TIF, Adobe Illustrator and JPG. Imported graphics are stored in a library that allows copies of the graphics to be used as "Instances" on the timeline. Graphics can be converted into animated buttons, tweened and scaled to meet the projects needs.
In addition to the main timeline, Flash allows additional timelines to be nested inside of the main timeline. These nested timelines are referred to as "movie clips" (MC) and are treated as any other graphic except that they can contain complex scripting and they can be controlled by scripts from other timelines that the user can interact with. Examples of MC control through scripting includes changing the scale, location and visibility of a movie clip instance.
When a project is completed it is exported as a compressed Shockwave Flash (SWF) file or as a stand-alone projector. The SWF files can be placed into an HTML page or loaded directly into any Web browser that includes the free Flash player plugin from Macromedia. SWF files may be loaded into a Web browser from the WWW or a local hard drive. Projector files are self contained executable applications and do not require that any additional files be included on the user's computer.
Menu and Display Interface
The first step in creating the interface was to import the base map information from ArcView shapefiles into Flash. Unfortunately, ArcView does not include an option for exporting files in the SWF file format. Although ArcView can export files in the Illustrator and EPS formats, data is sometimes corrupted when imported into Flash and it can be difficult to identify control points that will be required later for georeferencing.
MAPublisher for Illustrator from Avenza Software Inc. provided a simple solution for working with shapefiles from ArcView. Shapefiles were imported into Illustrator and scaled to fit within an 800 x 600 pixel rectangle drawn on "layer 1" that represented the extent of the screen window that the maps would be displayed within. The rectangle also served as a control point for georeferencing the data. The final scale of the imported shapefiles required to fit the entire State of Iowa into the 800x 600 rectangle was an unusual 1:2,267,716.535. [This scale was selected because when converted to the number of meters per pixel each pixel was equivalent to 800 meters when at 100% zoom.] Thus, the total width represented inside the window was 640,000 meters wide by 480,000 meters tall.
Once all of the vector data was scaled in Illustrator it was saved as an EPS file. This EPS file was then imported (with the 'convert layers to layers' option selected) into a new Flash file that was 800 by 600 pixels wide. [The maps were now part of the Flash timeline and located so that the reference rectangle was at position 0,0 in the top left corner of the Flash file.] It is important to note that Flash uses a semi reversed Cartesian coordinate system for graphic layout, as objects move from left to right on the screen their X value increases, however as objects move from the bottom of the screen upward their Y value decreases (Figure 5).
 |
|
Figure 5. Imported Base Maps with Geographic
and Screen Coordinates.
|
Converting the imported base data into a movie clip named "map" was the next step. Moving the data into the map movie clip allowed the layers to be controlled by ActionScripts that could pan, zoom and re-center the base data. To provide for the function of turning each based data layer on and off, each of the layers within the map movie clip were converted into a movie clip and provided with an appropriate name. To identify the location of nested movie clips, Flash uses a dot naming syntax. For example, the movie clip containing the geometry for the corridor buffer is identified as _root.map.buffer with _root representing the primary timeline.
In addition to the base data, the interface needed a menu or dialog that would contain the user interaction functions such as zoom, layer visibility, add point, add view and coordinate feedback. The menu was created using another movie clip appropriately called "menu". Since the menu movie clip covered a significant percentage of the map screen it was designed so that it could be collapsed and dragged around the screen.
Base Map Georeferencing
 |
|
Figure 6. Geographic Coordinates.
|
Georeferencing of the base map was provided by identifying the UTM Zone 15 NAD 83 X, Y coordinate for the top left corner of the rectangle surrounding the map. Again, MAPublisher provided a tool within Illustrator to easily identify the location. This information was stored in a variable as part of the Flash file. ActionScript was used to record the X, Y screen coordinates of the mouse and convert these coordinates to geographic coordinates based on the distance from the top left corner of the map. This information was updated every half second and displayed in the menu window (Figure 6).
Raster Image Import
Since placing all of the 300+ aerial photographs into the Flash file would be memory intensive, files had to be dynamically loaded into the project file when requested by the user. One of the new features of Macromedia Flash MX (Flash 6) is its ability to dynamically import JPEG image files when requested through ActionScripting. Identifying which aerials to display required a conditional script to check an index table to see if the area covered by the aerial or digital raster graphic was included within the limits of the portion of the map displayed on the screen. If an image's coordinates were within the boundaries of the viewed area a new movie clip was dynamically created and the image was loaded into the movie clip. The movie clip was then placed in the correct location on the base map. The images used for the project measured 800 x 800 pixels and displayed 10 meters per pixel. Once downloaded, raster images remained on the screen until the user cleared them using the clear raster graphic button on the menu.
 |
|
Figure 7. Aerial Photographs Displayed Within
Previously Zoomed View and Menu Interface.
|
Zooming
Zooming capability was provided by enlarging or decreasing the size of the map movie clip. Whenever the map clip was enlarged its current pixel resolution was decreased by half. For example, when at the 100% zoom each pixel measured 800 meters, when zoomed to 200% each pixel measured 400 meters. Calculating the offset between the original top left edge of the map movie clip and the new location of top left edge after it was enlarged provided a number that when multiplied by the pixel resolution value would provide the new geographic coordinate of the top left edge of the screen. From this value all other functions requiring access to the geographic location of the mouse could be utilized.
Adding Point Features
Collecting point features required that the geographic coordinates of the mouse's screen location be calculated and stored in a variable that could be placed into an array. [A dialog box provided after a point was placed allowed information about the point feature to be submitted.] Additional points could be added as soon as a point's geographic coordinates and description information was saved to the array. Once all points were added the data could be exported for use by ArcView as explained later in this paper.
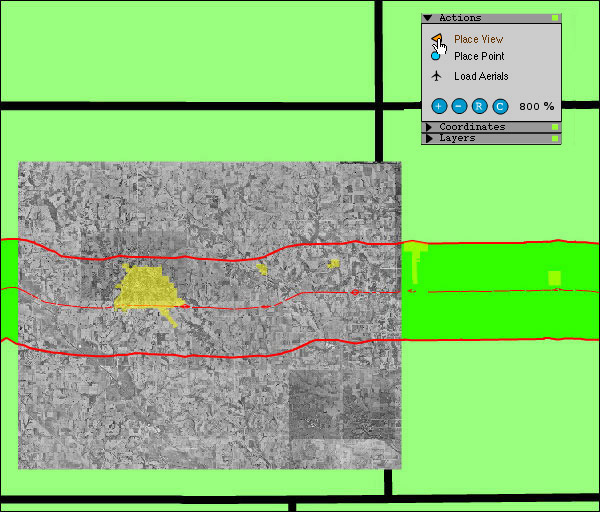
Adding View Areas
The design of the view area function required that geographic locations be collected for the start and endpoints of the view. These points are collected when the "Place View" icon from the menu interface is active and a location on the map is selected. The first point is stored in a temporary variable until the endpoint of the view is selected. After the endpoint is selected, trigonometric calculations are used to find the view direction and length. This information is then passed to a movie clip symbol that is dynamically placed from the graphic symbol library into the map movie clip. Once the view symbol has been placed, a dragable dialog box is displayed for the user to enter information about the view and to decide if the view should be recorded or discarded. If the view is kept, the temporary information about the view is placed into an array where it can be later exported. As soon as the record or discard button is selected, the program is ready to accept additional views (Figure 8). Each view symbol includes an attribute for transparency allowing the aerial image below the symbol to be visible.
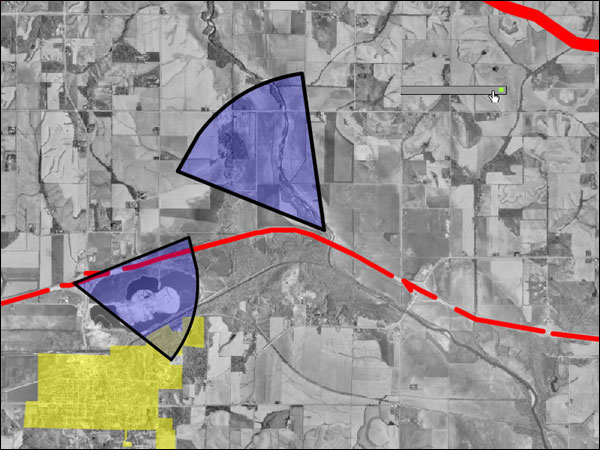 |
|
Figure 8. Display of Defined Scenic Views.
|
Data Export
Data collected from the "Point" and "View" interface is stored in the Flash file until the program is closed at which time it is deleted from memory. To keep the data for use with ArcView or to retrieve it back into the Flash file, data can either be posted to a Web server where a CGI, PHP, ASP or other server script can process the data and store it in a data file or database. For security purposes, the location that the data is posted to must be the same Web Domain that the Flash file was served from. When using the Flash file on a computer that is not connected to the Internet, data needs to be stored locally on the hard drive. Unfortunately, due to security concerns Flash is no longer capable of writing text files directly to the hard drive. Several other techniques for writing files to the hard drive have been developed by third party companies, however many of these solutions are platform dependent.
Macromedia has added a new component to Flash MX that partially addresses the issue of saving data. The new component is a Shared Object Library (SOL) that functions much like cookies for a Web browser. By saving data to an SOL when not connected to the Internet user input can be saved and posted to the server when Internet access is available again.
Data Retrieval
The option of reviewing comments and views that other users have added to the data file is accomplished by reading a comma delimited text file with ActionScript, (aerial image index shown below) and using a conditional loop to pass the data into a simulated array.
aerialspec=X,Y,Name
711279,4682194,20BQ.jpg
718879,4682194,20BR.jpg
726479,4682194,20BS.jpg
734079,4682194,20BT.jpg
Once the data is in the array it can be queried, modified, or added to and then posted back to a local text file or to the Web server for processing.
ArcView Data Import
Importing data back into ArcView from the text file requires that the text file be opened with a text editor to remove the variable= tag. Leaving the tag intact results in an inaccurate header name for the attribute table when loaded in ArcView. The first line of the text should contain the header information for each column of data.
To import the file, it must first be added as a table using the delimited text file type. Once the table is created, the "View --> Add" Event Theme menu option can be used to plot the coordinates for the X, Y points. After the points are plotted the "View --> Convert" to shapefile menu can be used to create a shapefile of the data.
Conclusion
The complexity of creating a data collection interface in Flash is directly related to one major element - the size of the base map. In this project, a landscape that stretched 300 plus miles was used so the additional function of zooming, panning and registering geographic coordinates tripled the amount of coding that was required because the data had to line up at all zoom levels. Although the design of this system included a large number of front end design time, adding additional data layers, query functions or input interfaces is just a matter of programming each component.
Because the majority of the graphics used in the project are vector images, the final size of the SWF file for WWW delivery is under 100 KB. This small file size combined with the ability to import aerials as needed meets two of the primary requirements of the project.
Future Development
The data collection tool designed for this project will undergo Beta testing in July 2002 and will be implemented into the data collection techniques for the project in August or September. Developmental work on the data collection tool will continue even after it is utilized for this project. Additional features and data layers will be added including the potential for linking to ArcIMS and image servers. To increase the quality of the display of view areas in ArcView, an Avenue script will be created to draw polygon shaped view zones from the imported data coordinates.
Currently, shapefiles can be converted into Scalable Vector Graphics (SVG) for use on the Web using tools such as Uros Preloznik's SVGMapper, however at this time there are no tools for directly converting shapefiles into the SWF format. Future research needs to be conducted to explore the possibility of creating a SWF export feature for ArcView that could include georeference information much like Geo-Tifs files do today.
Acknowledgments
Aerial Photos and DRG's provided by the Iowa Geographic Image Map Server developed by the USDA Natural Resources Conservation Service and MIT. http://ortho.gis.iastate.edu
Special thanks to landscape architecture undergraduate student Beth Carton for preparing and indexing the aerial photos and DRG files and graduate student Soo Wai-Kin for his work with preparing the GIS data.
Trademarks
Adobe Illustrator is a registered trademark of Adobe Systems Inc.
ArcView, ArcPAD and Avenue are registered trademarks of Environmental
Systems Research Institute (Esri).
LandViz•Media is a registered trademark.
Macromedia, Flash and Director are registered trademarks of Macromedia,
Inc.
MAPublisher is a registered trademark of Avenza Software Inc.
Other product names mentioned within this paper may be trademarks or registered
trademarks of other companies.
End Notes
An update to this paper along with a demo of the interface will be available at http://www.public.iastate.edu/~cjseeger/PAPERS/EsriUC02/p0687.htm after August 1st, 2002. If you visit this site please make sure to leave feedback regarding the functionality of this application.
References
Chambers, Mike. White Paper: Macromedia Flash MX Security. San Francisco.
Macromedia Inc. March 2002.
http://download.macromedia.com/pub/flash/whitepapers/security.pdf
Evans, John D. Interoperable Web-based Services for Digital Orthophoto
Imagery
Revised Jan. 28, 1999. http://tull.mit.edu/jpers/
Franklin, Derek and Jobe Makar. Macromedia Flash MX ActionScripting:
Advanced Training From The Source.
Berkeley, Macromedia Press. 2002.
Harder, Christian and Jack Dangerfield. Serving Maps on the Internet:
Geographic
Information on the World Wide Web.
Redlands, California, Esri Press. July 1998
Kraak, M.J. and A. Brown. Web Cartography. New York. Taylor & Francis. 2001
Plewe, Brandon. GIS Online: Information Retrieval, Mapping, and the Internet.
First Edition. Santa Fe, New Mexico, OnWord
Press. 1997
Razavi, Amir. ArcView GIS Developer's Guide: Programming with Avenue.
Fourth Edition. Albany, New York, OnWord
Press. 2002
Seeger, Chris and Chris Wall. Digital Charrette: Expanding Public
Participation
Through Interactive Media. American
Society of Landscape Architects Conference,
St. Louis. Conference Presentation. October
2000.
Author Biography and Contact Information
Growing up in rural North Dakota, Christopher J. Seeger's interests in the agrarian and natural landscapes lead to bachelor degrees in Landscape Architecture and Environmental Design from North Dakota State University in 1995. About this time ArcInfo 6, the free ArcView 1, and the World Wide Web were becoming popular. Chris continued his education at Iowa State University receiving a Master's of Landscape Architecture in 1997 with his thesis titled A World Wide Web Geographical Information System: Development of a Historical Photo Database for Shenandoah National Park, Virginia. After graduation Chris worked for the ISU Landscape Architecture Extension Service's Visioning Program which worked with small Iowa communities to develop designs to visually enhance their entryways and downtowns. In 1999 Chris joined the faculty at Iowa State University as a Temporary Assistant Professor to teach the Introduction to Landscape Architecture: Computer Lab. In addition to his teaching responsibilities, Chris is involved with several research projects. Through his company LandViz•Media, Chris provides landscape visualization, modeling and multimedia design services for Landscape Architects. Chris and his wife Kersten live in Roland, Iowa.| Christopher J. Seeger Temporary Assistant Professor Iowa State University Department of Landscape Architecture 146 College of Design Ames, Iowa 50011 P) 515-294-7462 F) 515-294-2348 cjseeger@iastate.edu |
LandViz•Media Attn: Chris Seeger P.O. Box 293 Roland, IA 50236 cjseeger@landvizmedia.com http://www.landvizmedia.com |