This paper presents use of GIS in the USDA's Risk Management Agency to monitor possible waste, fraud and abuse in the crop insurance program. A case study showing the usefulness of GIS information for monitoring and flagging purposes will be presented. This case study brings together multiple data sources, both spatial and relational database types. Reasons for the crop insurance claims will be screened for legitimacy, acceptable farming practices for crops, and acceptable combinations of crop, water and soils.
The Federal Crop Insurance Program was started in the Great Depression to reduce the risk of low crop pricing and to overcome the loss of planting due to natural problems. In recent times, producers have used the program for both risk reduction and income protection. A few producers, along with help from their agents and adjusters, have found ways to manipulate the program. In April 2002, the Deputy Administrator for Compliance estimated that in excess of $500 million may be attributed to fraud, waste, and abuse in the Crop Insurance Program (RMAOnline). In 2000, the Agricultural Risk Protection Act (ARPA) was passed by Congress to expand and strengthen the detection of fraud, waste and abuse of the Crop Insurance Program. This case study looks at an area that has a high occurrence of prevented planting claims due to flood and excessive moisture. Prevented planting claims are claims by producers that say they could not plant their fields with a crop due to some cause of loss that was out of their control such as flood, rain, drought, or insects.
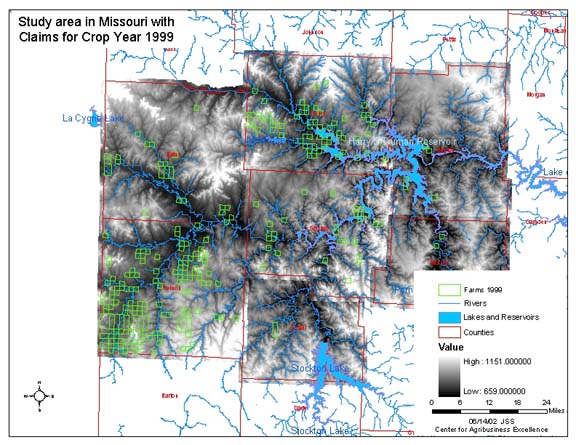
The study area was seven counties in western Missouri with a total size of 4760 sq. miles. In this area there are two lakes and three rivers and many streams that all contribute into the Missouri River outside the project area. This area has an average change of elevation of 386 ft and is on the western edge of the Ozark Mountain area. This site had a high occurrence of prevented planting claims due to flood in 1999.
Counties were used to show the location of the study area within the state. The rivers and lakes were used to show major hydrological features in the area. Counties, rivers and lakes were from the Esri data and maps media kit that came with ArcGIS 8.2. The elevation data was 7.5 minute DEM with a 30 meter resolution. This data was obtained from the Missouri Spatial Data Information Service. Land records which contain section, township and range information base on the Public land survey system where obtained from GIS Data Depot. Crop insurance data was obtained thru the Center for Agribusiness Excellence (CAE). CAE is a USDA funded project to create, manage and mine a data warehouse containing Crop Insurance data. Other considerations for data would be complete coverage of FEMA flood plains, weather and highest lake and river levels.
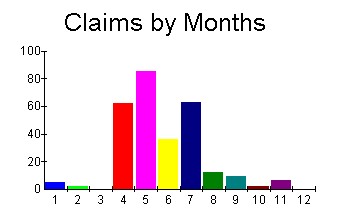
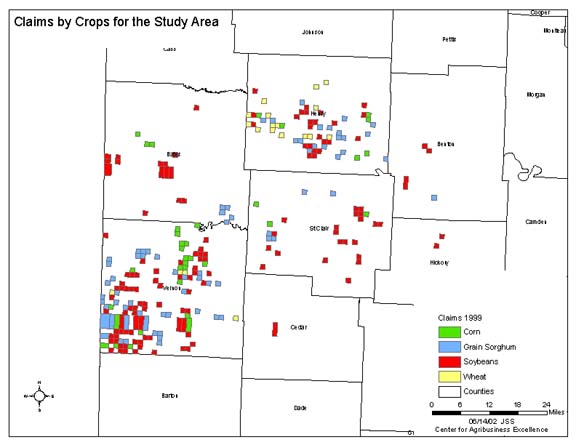
Data was pulled from the database based on a cause of loss of flood, FIPS codes, type of claim and for the year 1999. This information was looked at and compared to all policies in the area as well as by crops. In 1999, there were 282 claims on a total of 1604 policies for the area. The claims in this area amounted to more than $600,000 or almost � of the total indemnity paid out in the area. The claims only cover 15% of all the land that have crop insurance in the study area and less than 0.4% of the total study area. Based on this information, this area has a disproportionate amount of prevented planting claims. By graphing the number of claims by month, the graph show strange behavior in July where there were a large number of claims in a typically drier month. Looking at the information broken by crops the Grain Sorghum increased greatly comparing the claims to the % of the total area planted. The other crops had less than the % of the total area planted, but were distributed similar in all areas.
| Crop | % of Total Area* | % of Area with Claims** | % of Indemnity Paid*** |
|---|---|---|---|
| Corn | 20 | 15 | 19 |
| Grain Sorghum | 8 | 23 | 24 |
| Soybeans | 62 | 53 | 49 |
| Wheat | 10 | 9 | 8 |
| Totals | 100% | 100% | 100% |
* - policy acres for crop / total policy acres
** - prevented planting acres for crop / total prevented planting acres
*** - indemnity paid for that crop / total indemnity
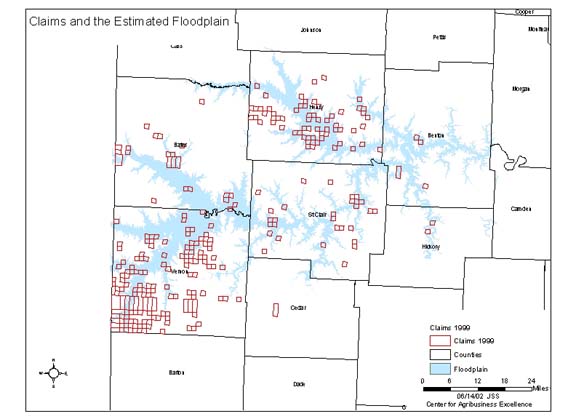
This information was then related to a table that contains legal land records for this area. The resultant dataset contain a section, township and range, cause of loss, crop, indemnity amount and acres affected. This dataset was then joined to the spatial land record data to show locations of claims in the study area. At this point, it was determined that floodplain information was needed to determine legitimacy.
An estimated flood plain was produced by using digital FEMA flood zones where available and using that information as a guide for areas where they were not available. Claims that fell in the estimated flood plain were flagged for possible bad farming practices. These are not the type of claims that are being looked for. These areas need to be reviewed for viability of this type of insurance for this area. Claims that were outside the estimated flood plain were flagged as possible bad claims. They are considered bad claims because they are outside the flood plain but they say their cause of loss was flood which is contradictory. They are at an elevation where flood should not occur. It was suggested that further research be done by RMA personnel on these bad claims. These claims could be considered wasteful, abusive or even fraudulent.
As more flood plain information becomes available in digital format, this type of analysis can be useful as a way to flag questionable claims. This can also be expanded to look at prevented planting claims for excessive heat, drought or cold causes. More GIS data will need to be gathered for these types of studies including extensive weather information as well as local agriculture knowledge.
RMA Online. www.rma.usda.gov
Missouri Spatial Data Information Service.
GIS Data Depot. www.gisdatadepot.com
Olson, Stacey A. "Using Data Mining to Detect Anomalous Producer Behavior: An Analysis of Soybean Production and the Federal Crop Insurance Program." MS Thesis, Tarleton State University, 2002.
Special thanks to Tim Conard, RMA, and CAE.