This paper presents the use of Geographic Information System (GIS) to assess human vulnerability to cyclonic storm in India. Human vulnerability is conceptualized here as the exposure to hazard by external activity (e.g. cyclones) and the coping capacity of the exposed communities to reduce the risk. The assessment looks at the potential exposure of people impacted by cyclonic activity in 32 Indian states by integrating a variety of GIS data like path of cyclone tracks, demographic distribution, and poverty data. The paper also explores how the coping capacity of the people is interrelated to vulnerability. We demonstrate the utility of GIS for measuring and characterizing the potential harm to people arising from extreme events. Through this application vulnerable populations can be identified in a geographic domain, thus enabling governments and agencies concerned with disaster mitigation to more readily respond.
Keywords: Human Vulnerability, Exposure, GIS, coping capacity
India is one of the most densely populated countries in the world with over one billion people. About half of the Indian boundary is surrounded by ocean and approximately 40% of total population lives within 100 km ocean coast (Hua et. al. 2002). This people living in the coastal regions of India are highly vulnerable to natural hazards such as cyclones and man-made hazards like water pollution. The natural hazard takes million of lives, damage properties and natural resources in coastal areas. In spite of cyclone warning systems, a recent cyclone killed over 10,000 people in Orissa states and millions of people became vulnerable (CNN, 1999).
Vulnerability to natural disasters like cyclone can be conceptualized as the exposure to hazard (Cyclone) and coping capacity of the people (e.g. early warning system, capital) to adapt and reduce adverse impacts. This coping capacity also includes defense mechanisms and the access to the resources (e.g. education, infrastructure)
This paper assesses the human vulnerability of the Indian coastal zone to cyclones. The vulnerability of the region is modeled and population is calculated through GIS tools. The paper also explores how GIS can use the coping capacity, an economic variable, which relates to vulnerability of the people.
This paper, addresses two critical geographical questions. Firstly, where is the location and extent of natural hazards such as cyclones? Secondly, what are the relationship between population, natural hazards and coping capacity?
Arc Info’s GRID based modeling techniques are used to address the critical geographic questions identified above. Data layers representing population density, natural hazards models, coping capacity were integrated in a GIS framework and resulting output surfaces were combined to identify vulnerable population exposed to significant natural hazards.
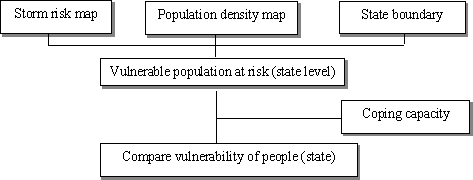
An approach has been taken to assess vulnerability due to single hazard component like cyclone. A GIS based study is applied to calculate vulnerable population in different States of India due to cyclonic storm. The following steps were used to perform the analysis.
Step one, A storm risk map is produced to identify the vulnerable zone using modeling tool, where vulnerability is grouped according to the past trend and intensity of tropical storms (Miller 2000).
Step two, A grid based (1 sq. km) population density map is created combining urban and rural population of India (Miller 2000).
Step three, Vulnerable population of each state of India is calculated by combining the storm risk map and the population density map and state boundary map in a GIS framework.
Step Four, Coping capacity factor (per capita income of each state) is introduced to compare relative vulnerability in different states of India.
The following flow chart shows the method used for cyclone vulnerability assessment
The storm risk model developed by Earth Satellite Corporation used the following methodology to calculate the storm risk zone in India
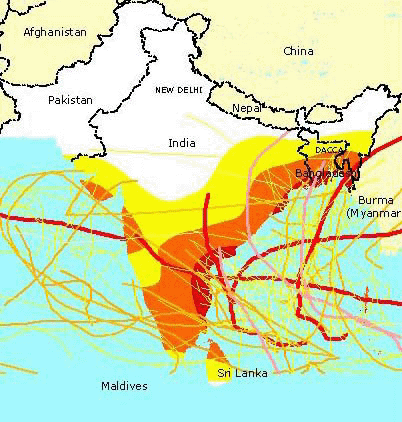
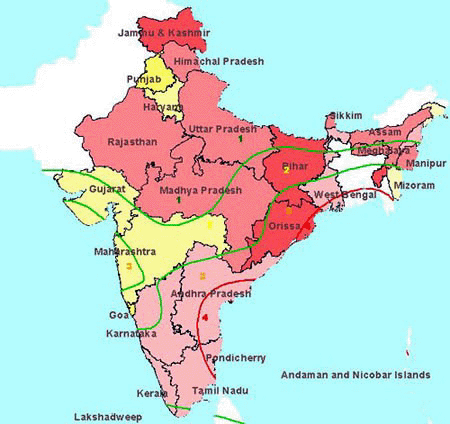
Map shows storm risk in India. Dark red are showing high risk and light yellow are showing low risk
All historical cyclonic storm and tropical depression center tracks data are recorded from 1971 to 1999, which is compiled by Global Tracks (http://www.gtracks.com/).
The storm risk model mapped the regional historical density of storm intensity from November 1971 to November 1995. The regional line density (within a 500 km distance) of cyclonic storm and tropical depression center tracks was calculated for each 1 km sq. cell in the study area using a weighting factor. The resulting weighted density surface was then categorized into low, low-moderate, high-moderate, and high-risk categories to represent variance in risk especially in costal areas of India. (Miller, 2000)
The resulting risk surface map shows the historical (1971 - 1995) risk of cyclonic storms and tropical depressions throughout the study areas. The risk surface represents the regional frequency, density, and intensity of cyclonic storm activity.
The gridded level (1 sq. km.) population density surfaces model developed by Earth Satellite Corporation was used in this study to aggregate urban and rural cell level population (Miller, 2000).
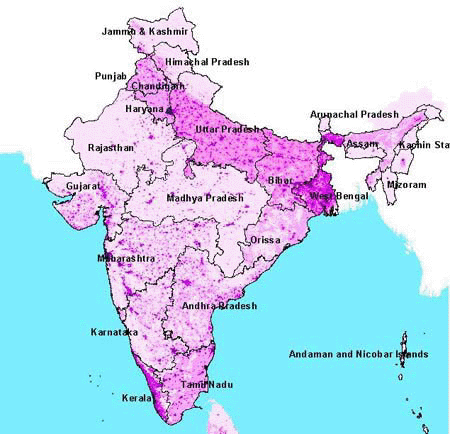
Map shows population density of India. Dark color shows high density and light color shows low density.
Publicly available data and information for urban and rural population served as the source of inputs to this analysis.
State-level urban and rural population for India was collected through the US Census Bureau International Program in the Department of Commerce. These state-level figures were allocated to 1 km sq. pixels were based on a multi-criteria suitability model (Miller, 2000).
The resulting urban and rural population density GRID surfaces were combined in a map to produce a complete population density per sq. km. surface for 1998.
Vector-based spatial data (political boundary) of Indian states was obtained from publicly available sources such as Environmental System Research Institute (Esri) database.
A composite map showing vulnerable population exposed to storm risk of India.
State level grid map is derived from state level vector based map. Vulnerable population at risk is calculated by combining the storm risk map and the population density map of India. State level population was calculated combining the above map and the state grid map. Total population for different vulnerable region is also calculated for this study. Arc Info GRID module was used for this analysis.
The GIS based analysis shows that more than half billion people are potentially affected by tropical storms in India. The following table illustrates that 20 states are affected by the tropical cyclone among 32 states and union territories (UT) in India. The table shows the vulnerable population in different states in India living in different storm risk zone.
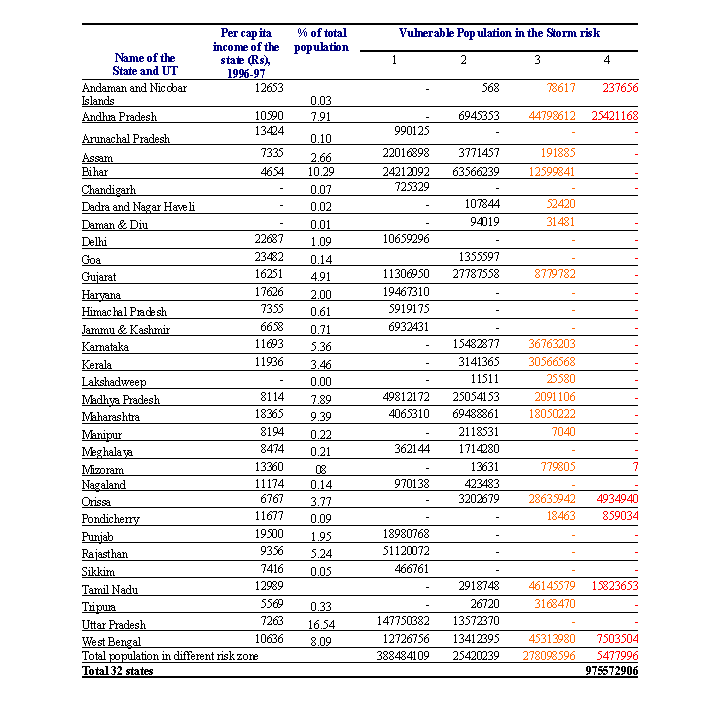
Source: Per capita income, Map of India. (Storm risk 1 represents low vulnerability and 4 represents high vulnerability)
State level vulnerable people at risk are calculated for each risk zone. An estimated 54 million people are extremely vulnerable to cyclone who live in the high risk region (Storm risk zone 4), Approximately 278 million people live in moderately high vulnerable region (Storm risk zone 3). Approximately 254 million people live in the moderately vulnerable region (Storm risk zone 2) and rest of the population live in the low risk zone one, where they are only affected by light storms. The following graph shows high risk (combining population of risk zone 3 and 4) states where people are more vulnerable.
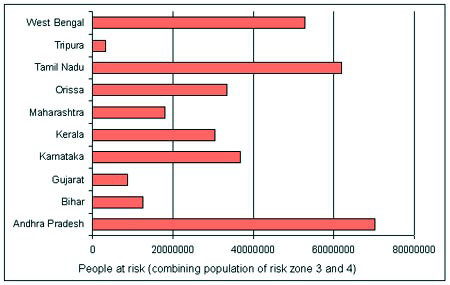
Graph shows high-risk states in India
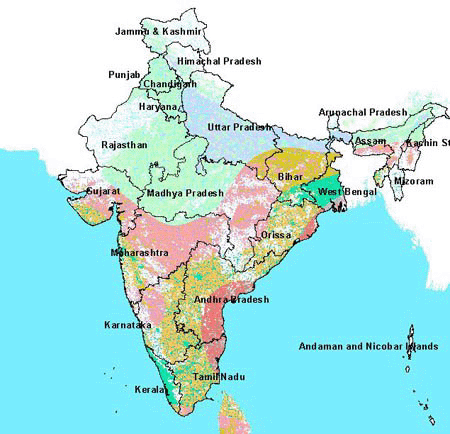
Coping means ability to withstand risks at a particular point of time. Coping could be money, deployment of technology, infrastructure or emergency response system. Coping is also the manner in which people act within existing resources and range of expectations of a situation to achieve various ends. This means how people are able to respond in unusual, abnormal, and adverse situations. Here per capita income of each states are used as the coping capacity of the states. As raster (1 sq. km. pixel) data sets are not available for per capita income, State level data (www.mapsoftindia.com) is used for this analysis. The following map shows the coping capacity of different Indian states.
The state level per capita income map below illustrates that Bihar, Tripura and Orissa are the poorest states based on their per capita income where Madhya Pradesh and Gujrat have high per capita income.
Map showing per capita income of different states in India. Dark red areas are shows low per capita income and dark yellow areas are shows high per capita income.
The results from combining storm risk and poverty map show that Orissa is the most vulnerable due to its low coping capacity (per capita 6767 Rupees ( 47.03 Rupees=1 USD) and of cyclonic vulnerability. Tamilnadu, Andhra Pradesh and West Bengal are also vulnerable because they lie in the vulnerable region and they have low per capita income as well. Maharashtra, Goa are two states which also affected by cyclone risk but it is less vulnerable to cyclone because of its good coping capacity (per capita more than 18365 Rupees.). This analysis results that in poor states, people become more vulnerable due to poverty (low per capita) and cyclonic risk.
This study reveals that vulnerability is not only depends upon the exposure to hazard but also on coping capacity of the people. The study demonstrated that poor coping capacity (per capita) of the people is the underlying cause of this vulnerability. Coping capacity of the people is generally recognized as one of the most important correlates to reduce vulnerability to hazard. Building both the social and financial capital for the poor could be the best way to increase coping capacity of the nation and reduce vulnerability.
GIS tools are used in this analysis to identify the vulnerable population with the single hazard component. These tools are used to calculate state level population affected by different type of storms. This study reveals that GIS is a unique tool to assess vulnerability and geographically locate people in a single hazard. However, calculating vulnerability by GIS with multiple hazards and coping capacity is a great challenge to decision makers.
The view expressed in this paper is only by the authors not representing their agencies. The designations employed and the presentations do not imply the expressions of any opinion concerning the legal status of the country, territory or authorities, or of the delineation of its frontiers or boundaries.
CNN. (1999). Thousands feared dead in India cyclone, October 30, 1999
Miller, J. (2000). Using GRID for Regional Population, Agriculture, and Natural Hazards Modeling, Proceedings of the Twentieth Annual Esri User Conference.
Hua et. al. (2002). The status and interconnections of selected environmental issues in the global coastal zone, Ambio, Sweden. (in press)
UNEP (2002). Assessing Human Vulnerability to Environmental Change: Concepts, Issues, Methods and Case Studies. A report on work in progress. Nairobi. (forthcoming)
"The authors gratefully acknowledge the cooperation of Jeffrey B. Miller, Earth Satellite Corporation for providing data for South Asia."
Author Information
Sheikh M. Nazmul HossainCo- Author
Dr. Ashbindu Singh