SOLVING
COMPLEX PROBLEMS WITH GIS AND METEORLOGICAL DATA
by Ronald J. Sznaider, Meteorlogix
1.0 Abstract
The use of GIS, combined with new types of advanced and localized
meteorological data sets, is now being used to solve a wide range of complex
business and safety issues. Examples include improved fleet transportation
routing efficiencies, more accurate energy industry load forecasting, precise
advance analysis of hurricane damage potential, enhanced public safety with
lightning monitoring, improved water district management and flash flood
forecasting, and more efficient emergency response to an airborne bio-terrorist
attack. The unique combination of GIS with appropriate meteorological data sets
produces intriguing synergies and possibilities for improved problem solving in
the future.
2.0
Introduction
For many years GIS has been used to
primarily static geo-referenced data sets for analysis and solution of a
multitude of complex business problems.
Unfortunately, access to, and management of, complimentary dynamic data
sets such as weather information were virtually non-existent. However, today an extensive suite of
reliable, consistent, and quality-controlled weather data sets, in Esri GIS
format, as well as software components designed to help manage this weather
data, are now available from Meteorlogix.
The ability to “weather-enable” traditional GIS applications is now a
reality and provides a host of new, wide-ranging opportunities to better solve
increasingly complex business problems.
Over the past 30 years, the Esri
data formats have become the de facto standard in the GIS industry. Due to Esri’s leadership role in the
industry, Meteorlogix, the world’s largest commercial weather service provider,
chose to convert the weather data into the Esri GIS data formats. This represents the first time that a
comprehensive suite of high-quality, commercial-grade weather information, from
worldwide sources, has been made available to GIS users, making it possible to
immediately integrate “real-time” weather information into Esri-based
applications. Established in October
2001 through the merger of three weather service leaders — business-to-business
provider DTN Weather Services, broadcast and aviation weather forecaster
Kavouras, and long-range forecaster and climate predictor Weather Services
Corporation — Meteorlogix represents more than half a century of experience and
weather information acumen. The company serves more than 22,000 customers with
a focus on the energy, public safety, broadcast media, transportation, and
aviation industries.
3.0
Applications of weather data in GIS
Combining real-time and forecast
weather information with a GIS has significant potential for developing a
weather-enabled decision support system.
GIS offers much more than a typical “display” of weather graphics; a GIS
provides the capability of combining the weather data itself with virtually any
other geographically based information and, perhaps most importantly, provides
a means to perform advanced spatial analysis capable of calculating meaningful
value-added results. Meteorlogix
quality-controlled weather data, combined with a GIS, can immediately unlock
analytical potential that was previously incomprehensible and help solve more
complex business problems.
Figure 3.0
An example
of National Weather Service watch/warning/advisory information displayed in
ArcView
3.1
Broadcast Television
Meteorlogix introduced the merging
of GIS technology and weather information to the broadcast television industry
in the form of a weather radar display and storm tracking system. Today, the Meteorlogix MxWeatherSpan
StormCommander system is an advanced GIS application built upon the Esri
MapObjects applications development toolkit.
StormCommander utilizes GIS to display weather layers in conjunction
with detailed map backgrounds that are dynamically generated while on-the-air,
give TV viewers a better understanding of the precise location of severe storms
relative to familiar landmarks. The
location of individual storm cell epicenters, combined with their movement
characteristics, allow calculation and depiction of the future storm path over
time.
Figure 3.1
The
MxWeatherSpan Meteorlogix StormCommander system is a GIS-based radar display
and storm tracking system used by television stations throughout the United
States
3.2 Water
resource management utilizing Doppler Weather Radar
Starting in the early 1990’s, the National Weather
Service (NWS) began to deploy a national network of new Doppler weather radar
systems. Code-named WSR-88D (Weather
Surveillance Radar 1988-Doppler), they have come to be commonly referred to as
the NEXRAD (Next Generation Radar) system.
With a maximum range of over 240 nautical miles (primarily limited by physical
characteristics of radar beams curving away from the earth’s surface as
distance increases), the NEXRAD network of over 150 systems can monitor most of
the United States with a contiguous 1-kilometer spatial resolution.
NEXRAD radars have two distinct advantages over older
radars. First, they are Doppler radars, which means that the radar can
calculate the velocities of raindrops within storm cells. Second, they scan the
entire volume of space above the radar (literally a cylinder 240 miles wide and
80,000 feet tall), producing one scan every five to 10 minutes, depending upon
the precipitation detected. The combination of these two characteristics allows
a NEXRAD radar to create a three-dimensional picture of precipitation, and to
discern features such as individual storm cells, and even small phenomena like
tornados and hail.
Figure 3.2 Locations of NEXRAD radar sites
While individual radars provide good local information,
often times information over a wider area is required. The establishment of an
overlapping network of NEXRAD radars provides this expanded coverage. With a
network of weather radars in place, the combination of multiple, overlapping,
and time-synchronized weather radar images, into a single image, introduces
additional value. But in order to do
this effectively, non-precipitation entities in the weather radar image also
needs to be eliminated.
The NEXRAD radars are very sensitive, so that they can
effectively detect light precipitation. Although weather radars are, by design,
most sensitive to detect particles the size of raindrops, they also sometimes
detect nearby objects such as high elevation terrain features, buildings and
other ground features that intercept the radar beam. They sometimes detect birds, insects, and suspended water vapor
particles. This "clutter" generally provides little usable
meteorological information and may in fact introduce confusion in the
interpretation of the radar display, as it is often difficult for a
non-meteorologist to differentiate between the actual precipitation and clutter
close to the radar.
To address this issue, Meteorlogix, a leading
commercial weather services provider, developed a unique technique that
utilized additional information from the NEXRAD, along with other current
meteorological information, to suppress, or eliminate clutter areas from the
precipitation areas. The overlapping
radar coverage allows adjacent radars to fill in clutter-suppressed areas if
actual precipitation is indeed present.
This innovative approach allows for the automated production of a
Doppler weather radar mosaic image, essentially clear of clutter contamination.
Considerable additional value is added by the automatic removal of radar ground
clutter and other false radar signals.
The resultant radar mosaic represents a depiction of actual
precipitation, not simply raw radar echoes – a very significant
difference.
The weather radar mosaic was
further enhanced with information on the precipitation state (liquid, frozen,
or mix) integrated into the display. Introduced to the industry by Meteorlogix,
this allows the user to determine not only the location and intensity of
precipitation, but also whether the precipitation is falling as snow, rain, or
an ice mixture. This allows the tracking of large areas of snow and/or ice
precipitation relative to service areas. This is of particular value to the
dispatch operations group as an aid in determining potential outages due to ice
accretion.
Figure 3.2.1
The Meteorlogix NEXRAD radar mosaic removes ground-clutter
and other false-radar echoes plus encodes rain/snow/sleet characteristics
The
NEXRAD radar introduced a new series of data sets making possible the automated
tracking of individual storms. A series of complex meteorological
algorithms identify individual clusters of storms, and perform a pattern
recognition correlation on recent data to determine storm movement. Additional
algorithms calculate the attributes of individual storms, including the
likelihood of the presence of hail, damaging winds, and potential developing
tornadoes. Using this information, it is now possible for utilities to pinpoint
the precise location of a storm cell, where it is moving, and what assets it
will affect, along with an Estimated Time of Arrival (ETA). Storms that are in a utility’s service area can be
monitored and tracked in near real-time since the radar data is updated every
five minutes. Utilities can monitor
speed and direction, intensity, presence and size of hail, and presence of
possible tornadic activity. The integration of mosaic weather radar (with
precipitation state information) and overlay plots of current and future storm
cell locations has been accomplished and integrated into the Meteorlogix
MxVision WeatherSentry™ and MxVision StormSentry™ PC desktop display systems.
Figure 3.2.2
The location and characteristics of individual storm cells
can be tracked
3.3
Monitoring global weather conditions
Monitoring
global surface and upper-atmospheric weather conditions within a GIS is now a
relatively easy task. Meteorlogix
provides both current weather observations and forecast information (up to 10 days
into the future), for the entire earth, in Esri point shapefile and grid format
respectively. Current observations from
over 7,000 locations are continuously received, processed, and distributed. Data from global weather prediction models
are available at least twice daily.
GIS grid tools such as Esri ArcView Spatial Analyst provide maximum
analysis potential.
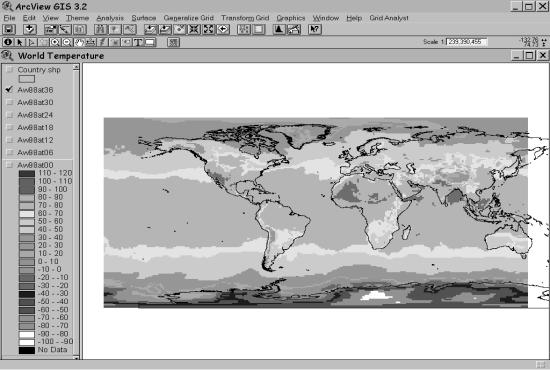
Figure 3.3
An example of global temperatures, displayed in ArcView with
Spatial Analyst. The Metwork FileServer
converts WMO GRIB format into Esri Grid format.
Note: image
size/quality is degraded in order to conform to publication guidelines
3.4 Energy
The effect that weather can have on service interruptions
and the ability of an electric utility to consistently deliver energy to its customers
is well known. The generation group is mostly concerned with forecast weather
conditions. Their requirement is to know how hot or cold it’s going to be today
and tomorrow in order to efficiently manage the production and generation of
energy. The non-regulated marketers also monitor forecast weather so they are
prepared to buy and sell power due to fluctuating demand, often driven by
weather conditions. Meanwhile, transmission operations are on the lookout for
adverse weather conditions such as lightning, severe storms and winds. If there
is weather-related damage, or potential for damage, the transmission engineer
must be prepared to re-route energy or dispatch repair crews to return the grid
to full operation. Finally, the distribution operations group monitors weather
information, such as radar and lightning data, to manage field crews. As storms
move into the service area, dispatchers need to know where to be prepared to
direct repair crews and whether or not to pull them off jobs or put off-duty crews
on standby. New storm tracking technology introduces the ability for an
electric utility to monitor dynamically developing severe weather storm cells
for much improved and more efficient decision-making.
Energy
related industries, that have historically used GIS, could gain new benefits
from using Meteorlogix supplied weather data in GIS data formats. A new GIS-based Decision Support System
from Meteorlogix — MxInsight EnergyWatch™ — can help utilities make more
informed weather-related decisions.
MxInsight EnergyWatch is an integrated suite of real-time GIS weather
data and software that provides decision-support tools for dispatch and
transmission/distribution managers of utility companies. Weather data is
collected from a variety of sources, converted to GIS format, and delivered to
a utility’s network, allowing for the integration of the weather data with the
utility’s own operational maps. The viewing and query of data can be
accomplished within a Browser via an Intranet or over the Internet. MxInsight EnergyWatch is a customized,
turnkey solution that is easy to use and tailored specifically to each utility
customer.
With this new technology, a user
can use MxInsight EnergyWatch to determine how wide a buffer between company
assets and severe weather is necessary for safe operation. Then, if lightning,
ice, heavy rains or high winds enter that “safe” area, company decision makers
will have pertinent information in advance.
Figure 3.4
Example of
weather radar and storm tracking merged with energy assets via Internet and/or
Intranet delivered browser based client
3.5
Monitoring lightning activity
Meteorlogix is now able to provide
information from GAI National Lightning Detection Network in the Esri Shapefile
format. This allows easy integration of
lightning data directly into GIS applications.
In addition to the traditional display of the location of lightning
activity on a map, a GIS provides the opportunity for precise calculations of
the proximity of lightning activity relative to golf courses, outdoor concerts,
fuel storage facilities and a multitude of lightning sensitive events for any
geographical point. The introduction of
lightning data directly into GIS applications opens up new ways to provide
solutions to weather related problems.
Figure 3.5
GAI lightning data, updated each minute, is now available in
Esri shapefile format from Meteorlogix ready for direct integration into GIS
systems
3.6
Emergency Management
Emergency management agencies, already
a user of GIS technology for advance planning purposes, can now easily
integrate real-time weather data from Meteorlogix into their operations to
improve decision making and allow faster response times during threatening
weather situations. Large-scale weather
events such as hurricanes can now be monitored directly within a GIS. Numerous smaller-scale weather events can
also be utilized with a GIS. For
example, Meteorlogix provides continuous real-time access to individual storm
cells and their corresponding meteorological characteristics including speed
and direction of movement, intensity, presence and size of hail, and presence
of possible developing tornadic activity. Emergency management agencies,
equipped with GIS tools and the appropriate weather data, can be more proactive
and responsive towards many natural disasters.
Significant large-scale weather
events, such as tropical storms and hurricanes, can now also be monitored
directly within a GIS. The combination
of weather satellite, weather radar, and forecast hurricane tracks, combined in
a GIS and cross-referenced to demographic data, can provide insight to possible
future damage to the electric utility infrastructure and what extent outages to
expect. GIS spatial analysis tools make it possible to objectively calculate
meaningful damage estimates, providing information for advanced logistics
planning. With GIS-enabled weather
information, utilities have the ability to more quickly make better decisions
that can reduce losses.
Figure 3.6
The forecast track of a
tropical storm or hurricane can be monitored within a GIS
3.7 Transportation
Many
land transportation management systems can benefit from the integration of
weather into their GIS. One example is
the railroad industry, interested in increasing overall efficiencies and
reducing costs from weather induced derailments (high winds blowing material
off rail cars and/or blowing rail cars off track). Meteorlogix recently implemented an advanced automated weather
alert system for a major railroad. The
system was based on a variety of real-time weather information, the Metwork
FileServer and Esri ArcView components.
Specific weather events, as defined by the railroad, are continuously
monitored. When a particular weather
parameter exceeds a pre-defined threshold, and threatens to affect a particular
section of railroad track, a strictly coded alert message is automatically sent
to the individual dispatcher responsible for the affected section of
track. This system allows continuous
monitoring thousands of miles of track for user specified weather conditions. The combination of GIS technology and
weather information makes possible advanced automated alert systems like this
which have the potential to save substantial money due to smoother operations
and fewer weather related disruptions of service.
Figure 3.7
GIS tools make possible automated monitoring of railroad
track segments for threatening weather.
3.8 Real-time weather for Homeland Defense
Meteorlogix
has developed the capability to integrate truly real-time weather observations
into a GIS, delivered directly from a network of weather sensors located at
customer locations, via the Internet.
This innovative use of the Internet brings essentially “live” weather
directly into a GIS. Typical sources
for surface weather observations (i.e. National Weather Service) have a nominal
update frequency of one hour. The
deployment of local sensors, at strategic locations, provides real-time weather
data, updated as often as every 3 seconds.
Figure 3.8
Real-time weather information integrated into SAIC "CATS" software
allows precise calculation of hazardous plume
Figure 3.9
An example of a typical weather sensor that can be remotely
deployed at strategic locations, providing real-time weather input to GIS applications
The weather data is streamed via the Internet and updated
every 3 seconds.
4.0 Conclusion
The merging of
GIS technology with properly formatted near real-time weather data from
Meteorlogix will make possible a new level of weather-GIS information analysis
systems and will likely supplant the attention formerly given strictly to
weather visualization. Bringing weather
data into the world of GIS can benefit users and drive new applications. This
is a new paradigm—merging high-quality, up-to-the-minute weather information
with powerful GIS analysis and visualization.
Quite simply it will give users the ability to do things that have never
before been available.
Meteorlogix
became an Esri business partner in the 1996 and the two companies continue to
work together to provide solutions to weather related problems that can benefit
from GIS technology. Meteorlogix will
continually increase the amount and variety of weather information that will be
available in GIS-ready formats.
GIS-ready weather data from Meteorlogix is available today via
high-speed communications satellite delivery in conjunction with a properly
configured Meteorlogix Metwork FileServer and also via the Internet. Please see www.meteorlogix.com for more information.
5.0 Author information
Ron
Sznaider
Vice
President – Product Management
Meteorlogix
11400
Rupp Drive
Burnsville,
MN 55337
(952)
882-4574