H.S. Bajwa and U.S. Tim
Geographic Information Systems have become increasingly valuable tools in flood modeling and play an integral role in decision-making processes for flood prediction and mitigation. A hitherto quite distinct activity has been the development of GIS driven visualization including realistic visual simulations. Typically these sciences have been undertaken on discrete, non-interactive problem-solving domains. The increasing availability of high performance visualization tools offers new opportunities to combine interactive hydrologic/environmental simulation models with emerging immersive visualization and decision support environments. This paper describes the development of such a system, with particular emphasis on exploring the role of virtual reality in enhancing the hydrologic and ecological modeling. A component of the study was to develop tools to access and display geographic data and spatially explicit outputs of overland flow predicted by the hydrologic model (HEC-HMS) in a microcomputer-based three-dimensional virtual environment using the head mounted display, hence, increasing perception and realism. This combination of the analytical approach with more subjective visual assessment offers the advantages of both worlds in terms of information transfer and decision reliability.
�Around the world, unruly rivers have long driven a hard bargain. In exchange for rich soil, irrigated land and convenient transportation, they have forced floodplain dwellers to deal with an occasional washout. Engineers have labored for thousands of years to lessen the risk, but their attempts at managing Mother Nature have been mixed -- often resulting in as much failure as success� (FEMA, 2002).
Hydrologic processes vary both in space and time as a function of the similar variation of meteorological inputs and land use, as well as of the spatial variability of topography and soil types (Fortin et. al 2002). Recently, the need to incorporate this large-scale variability and spatial heterogeneity of environmental landscapes have necessitated the use of geospatial technologies (such as GIS) and distributed databases. The use of tools such as GIS have increased remarkably because many environmental models require large amounts of spatial and non-spatial data (e.g., topography, soil, land cover, climate, and land management) for each of the interacting processes. Not only does GIS enable the user to collect, store, manipulate, analyze, and display spatially referenced data, it also provides an environment to construct models and to make the models easier to use (Goodchild et al., 1996). Recent developments in geographic information systems provide the opportunity and tools to spatially organize and effectively manage data for hydrologic modeling (Tim, 1996).
Although a traditional GIS has been able to solve some of these problems, the increasing sophistication of application areas, and the rapid growth in technologies, such as virtual reality, human-computer interaction, and multi-dimensional computer graphics offer new opportunities as well as challenges for GIS and environmental/hydrologic modeling (Tim, 1996; Wesseling et al., 1996; Shepherd, 1994; Betty et al., 1998; Heim, 1997).
This paper discusses the development of a lowly immersive desktop visualization system and a partially immersive desktop visualization system using the Head Mounted Display, which supports GIS-based hydrologic modeling. The paper begins with an introduction of various components of the visualization systems and then the integration of these individual components. At the end an example application, the development of a lowly and partially immersive virtual flood mitigation system for the City of Ames has been described. The project completed was a part of research being carried out by Dr. U. Sunday Tim and his students in the Environmental and Geographic Information Systems Laboratory (EIS Lab) in Department of Agricultural and Biosystems Engineering at Iowa State University.
One of the most common tools in any engineering analysis is an efficient and accurate model, which facilitates the simulation of desired events and the prediction of future occurrences by allowing the user to combine a series of inputs, governing factors, and physical laws into one comprehensive system. Floodplain management hinges on the use of hydrologic models and their accuracy, as floods can be caused by a vast array of circumstances and are affected by nearly every component of the natural and constructed environment. As is obvious, floods are impossible to predict with complete accuracy. However, a model that accurately describes the characteristics of the landscape, weather and precipitation patterns, hydrologic and hydraulic principles, and current regional and local conditions will significantly increase the odds of successful early prediction. Besides prediction, models permit user-specified circumstances to be simulated without actual occurrence. This feature aids in the investigation of environmental trends and the identification of potential sources of increased flood risk. The Hydrologic Modeling System forms the basis of studying the hydrology of the Squaw Creek watershed, which has been taken as example study later in this study.
HEC-GEOHMS: HEC-GeoHMS is a public-domain extension to the ArcView GIS and Spatial Analyst extension created by the US Corps of Engineers. This software is intended to serve as a geospatial hydrology toolkit for engineers and hydrologists. Geo-HMS has been developed to process the terrain and spatial information to generate expediently a number of hydrologic inputs to the HEC-HMS model. Analyzing the digital terrain information, HEC-GeoHMS transforms the drainage paths and watershed boundaries into a hydrologic data structure that represents the watershed response to precipitation (Doan et. al, 2000). It creates a background file, lumped basin model, a grid-cell parameter file, and a distributed basin model, which can be used to enhance data input into hydrologic models such as HEC-HMS (Doan et. al, 2000).
HEC-HMS: The U.S. Army Corps of Engineers Hydrologic Modeling System (USACE, 2002) is a Windows-based hydrologic model designed to convert input rainfall over a watershed into hydrographs of flow vs. time at various points within the basin. HMS has an easy-to-use graphical user interface (GUI), which allows for the manipulation of hydrologic elements such as basin and river reaches and the improved input of basin characteristics. In HEC-HMS, a project consists of three separate parts: the Basin Model, the Meteorologic Model, and the Control Specifications.
HEC-HMS contains four main components: (1) a system for storing and managing data, specifically large, time-variable data sets, (2) an analytical model to calculate overland runoff as well as channel routing, (3) an advanced graphics display illustrating hydrologic system components with interactive features, and (4) a means for displaying and reporting model outputs (USACE, 2002 - HEC-HMS User Manual).
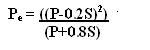
The Basin Model contains inputs for simulating sub basin runoff, losses due to soil abstraction and storage, transformation of excess precipitation into runoff, routing of runoff into and through channels, and diversions in the natural flow path. It contains the basin and routing parameters of the model, as well as connectivity data for the basin. Sub basins represent the physical areas within the basin and produce a discharge hydrograph at the outlet of their respective areas. The SCS Curve Number method was used to estimate the loss rates from the total excess precipitation for a storm as a function of cumulative precipitation, soil cover, land use, and antecedent moisture. The SCS Curve Number method estimates the total excess precipitation for a storm as a function of cumulative precipitation, soil cover, land use, and antecedent moisture based on the following equation:
where:
Pe=accumulated precipitation excess at time t;
P= accumulated rainfall depth at time t;
S= potential maximum retention
Incremental excess for a time interval is computed as the difference between accumulated excess at the end of and beginning of the period. The potential maximum retention, S, and watershed characteristics are related through an intermediate parameter, the curve number, CN, with the following equation:
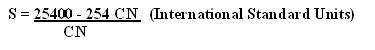
The CN values range from 100 (water bodies) to approximately 30 for permeable soils with infiltration rates. The values of CN and S were calculated in ArcView GIS. The changes in the land use/land cover reflected by the curve number, have a lot of effect on the runoff characteristics.
Transform methods, which convert the rainfall excess into surface runoff, can also be simulated using a variety of tools. The SCS Unit Hydrograph procedure used in this research, allows calculating the time of concentration and travel time in a drainage area. The time of concentration is estimated by the following equation:
where:
tc = time of concentration;
tsheet = sum of travel time in sheet flow segments over the watershed land surface;
t shallow = sum of travel time in shallow flow segments, down streets, in gutters, or in shallow rills and rivulets;
t channel = sum of travel time in channel segments
Routing techniques replicate the conveyance of the runoff from the reaches within different sub basins to the end of the river basin. The Muskinghum method was used as the hydrologic routing method for handling a variable discharge-storage relationship in this study.
The equation that rules the Muskinghum method is:
where:
S = channel storage;
I = inflow rate;
Q = outflow rate;
K = Muskinghum storage time constant (time of travel of flow wave through channel reach);
X= Muskinghum weighting factor
Precipitation values and distribution over the region are specified in the Meteorologic Model. This data can be historical or hypothetical, and future versions of the model will allow for the retrieval of storms of user-specified frequency for certain areas in the continental United States. HEC-HMS is capable of interpreting precipitation values in a variety of formats, including cell-based distribution such as utilized in NEXRAD radar readings, spatially-averaged values, and measured data from rain gages with user-inputted or model-derived associated gage weights using geographic information systems.
Control Specifications allow the user final control over the model calculations. In this component the specific variables for a given simulation, such as starting and ending dates and a calculation time interval, are established.
HEC-RAS: The Hydrologic Engineering Center�s River Analysis System (HEC-RAS) is an integrated package of hydraulic analysis programs designed for interactive use in a multi-tasking, multi-user network environment (USACE, 2002 - HEC-RAS User Manual). The system is comprised of a graphical user interface (GUI), separate hydraulic analysis components, data storage and management capabilities, graphics and reporting facilities. The HEC-RAS has been designed to perform one-dimensional hydraulic calculations for a full network of natural and constructed channels. The results of the model can be applied in floodplain management and flood insurance studies. The results obtained from the HEC-HMS, which are in the form of DSS files, can be read directly by HEC-RAS for further floodplain analysis and conversion of these files to be used by other applications for performing meaningful hydrologic data analysis.
The real strength of a geospatial data analysis system is in integration of database operations such as querying, statistical analysis, geographic analysis and visualization. The geospatial data system consists of a geographic information system (GIS), which is a computer system that manipulates geographically referenced data (i.e. data identified according to their location) by assembling, storing, manipulating, and displaying them. GIS is capable of different kinds of visualization including map displays, charts, three-dimensional views, photographic images and multimedia. Basically, GIS depicts spatially distributed data as they would be shown on a map, a two dimensional surface viewed from nadir via a high platform, with spatial objects represented by a mosaic of colors and patterns. GIS comprises of computer hardware, software modules, appropriate organizational context and spatial and non-spatial data. GIS applications support engineering analysis in very different fields, including hydrology and hydraulics.
ARCVIEW GIS: ArcView GIS is a desktop geographic information system (GIS) from Environmental System Research Institute (Esri), Redlands California. In ArcView, geographic features are stored in a database along with information describing them. By linking information to location, ArcView has proved to be a valuable tool for business and industry, government agencies, and many other types of organizations (Esri, 2002). In each case, GIS is used for pre-processing and post-processing of data. ArcView Spatial Analyst extension provides excellent capabilities for computing and visualizing the static hydrologic properties of landscapes such as flow direction, flow accumulation, and flow length for data. The Spatial Analyst forms the basis of the HEC-GeoHMS extension of ArcView GIS described earlier.
A Virtual Environment (aka virtual worlds) can be generally described as a space deliberately designed by humans to represent real or abstract space in which exist objects, which are governed by rules specified for the world they inhabit (Jacobson, 1994). Virtual Environments (VEs) that allow real-time visualization of environmental and geographic data sets have been the subjects of attention in the past few years. Several concepts and tools are associated with VEs and even a casual introduction of the subject must necessarily begin with this identification. The field of VE has been greatly influenced by developments in virtual reality technology as well as in notions such as artificial reality and cyber space. Indeed, VEs use a variety of virtual reality (VR) technologies to enable users to directly interact with modeling and simulation systems in an experiential fashion, sensing a range of visual, auditory, and tactile cues and manipulating objectives directly.
Virtual Reality has been addressed by a large number of authors in the literature for decades, many of them introducing slightly different meanings to the term. Some years ago a common definition had it that VR should be looked upon as a situation where a person was immersed into a computer generated environment that bore strong similarities with reality [Keppell et. al., 1997]. Other authors tend to define VR from the point of view of what technological tools are being used, i.e. VR happens when head mounted visual display units and motion-tracking gloves are present. One could also define VR from a psychological perspective, where it becomes nothing of a technology but rather a state produced in the users� minds that can occupy their awareness in a way similar to that of real environments [Keppell et. al., 1997].
The problems involved in finding a definition of VR that can be agreed upon has produced a host of competing terms that some authors prefer, e.g. synthetic environments, cyberspace, artificial reality, simulator technology [Isdale, 1993]. A different way of defining VR, and perhaps the best so far is to center on the user and look at the style of interaction that takes place between the user and the computer-generated environment. The users manipulate what is perceived to be �real� objects in the same manner as they would manipulate them in the real world, as opposed to the typing, pointing and clicking, one traditionally uses to manipulate objects when you interact in other computer environments. For example, to move an object in a VR environment, you may grab the object with your hands, lift it as you normally lift objects in the real world, and put it down wherever you want it inside the virtual environment.
There are basically three different kinds of VR, categorized by the quality of the immersion that is being provided [Cronin, 1997]. The first is desktop VR, which is by far the most common and least expensive form of VR there are, which typically consists of a standard desktop computer. This form of VR completely lacks any feelings of immersion on the part of the user. Second, a semi-immersive VR system attempts to give the users a feeling of being at least slightly immersed by a virtual environment, which is often achieved by different types of so called workbenches, reach-in displays and Head Mounted Displays. The third form of VR is usually referred to as being fully immersed. It typically consists of head mounted visual display units that allow users to be completely isolated from the physical world outside. Recently, a growing interest in building so-called Caves has been noted. A Cave Automated Virtual Environment (CAVE) is a room in which the walls surrounding the user produce the images, and thus deliver a sense of immersion (Cruz-Neira et. al, 1992). Not surprisingly, fully immersive VR is generally considered the best option for several reasons, including the ability to almost completely filter out interference from the outside world and thus allowing one to focus entirely on the virtual environment. However, even reasonable VR hardware and software designed to support full immersion is quite expensive and application development in this area is generally more difficult and time-consuming. Therefore, lowly immersive desktop visualization systems and partially immersive visualization systems such as the Head Mounted Displays have been used quite effectively as output of a virtual reality system.
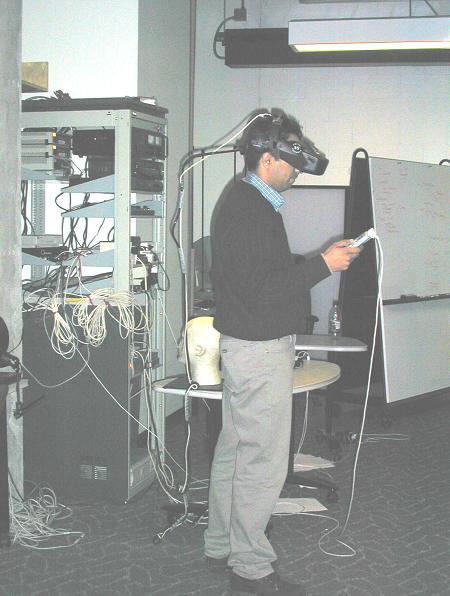
Head Mounted Displays: The head mounted display system (Figure 1), which is housed inside a helmet to be worn by a user, creates a complete visual immersion by effectively isolating the outside world from the user�s field of vision and placing the screens directly in front of the user�s eyes. The helmet effectively shields the user�s view from the outside world, which helps to create the sense of total immersion. The system displays the virtual world onto two screens that are placed directly in front of the user�s eyes inside the helmet. The Head Mounted Display (HMD) can be computer run on a variety of platforms including regular desktops and Silicon Graphics computers (SGI). Additional requirements of a head mounted display system include a high frame rate and synchronized stereo frame display. A lower frame rate and non-synchronized stereo display in a head mounted display system may promote cyber sickness in the user due to the fully covered field of view.
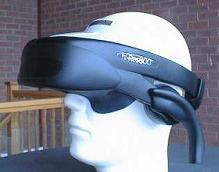
By effectively isolating the outside world from the user�s field of vision and placing the screens directly in front of the user�s eyes, the head mounted display virtual reality systems creates a complete visual immersion. This system eliminates stereoscopic frame violation by avoiding any projection surface. Since the helmet houses most of the complex hardware, there are very few other devices to set up. Therefore, the head mounted display system is easy to set up and maintain compared to other more complex virtual reality systems. The main disadvantage of the HMD is the weight of the helmet, which may cause physical discomfort and strain after prolonged use. The system creates an imposition on natural movements of the user. The system acts as a total barrier between the user and the outside world. Only a single user can use the system at a time. Therefore, it is not suitable for applications that need a group of people to interact inside a single environment.
The goal of this study was to develop a highly integrated system consisting of the hydrologic modeling system, geospatial data analysis system and virtual environment. The field of hydrologic modeling has been revolutionized with the use of geographic information systems since it provides a framework to incorporate large-scale variability and spatial heterogeneity of environmental data sets. On the other hand, there has been a marked increase the use of new technologies such as virtual reality technology to enhance the visualization capabilities of traditional GIS software. The concept of Virtual GIS (VGIS) has enjoyed increasing attention in the recent past (Koller et al., 1995; Verbree et al., 1999). A real-time 3D GIS supports the accurate depiction of buildings, and static objects, roads, and atmospheric effects, thus adding a new dimension to the simulation of real life situations. It adds a new dimension to the visualization of abstract variables (e.g., environmental variables and hydrologic data variables) by reducing the level of abstraction. The use of virtual reality tools in environmental sciences and hydrology can be in terms of engineering design and planning, visualization of the complex environmental/hydrologic data, to study the effect of management practices on the ecosystem and for spatially explicit assessment and management of natural hazards such as floods and droughts. Besides this virtual reality can be used quite effectively for education in environmental/hydrologic science.
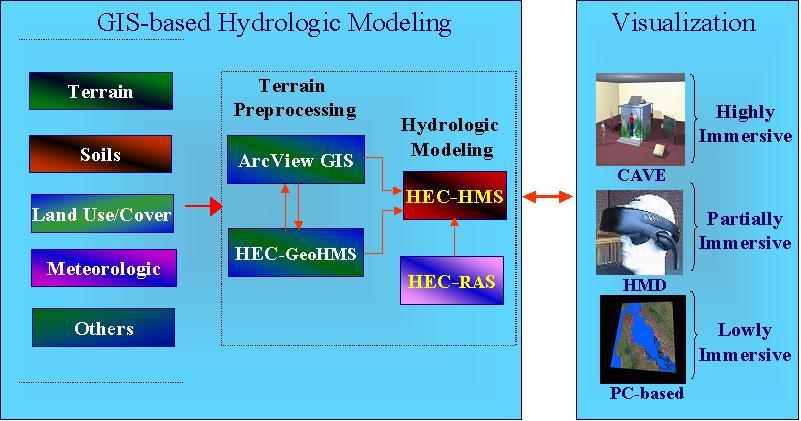
The system was developed with the vision to integrate all these powerful systems, i.e. the Geospatial Data Analysis System, Hydrologic Modeling System and Virtual Environment, and thus utilize the best of these technologies, to produce high levels of information presentation together with high levels of interactivity. A flow diagram of the processes and linkages of this system is shown below.
In order to realize the potential role of virtual reality technology in GIS-based hydrologic modeling, a flood mitigation system for the city of Ames was developed in virtual immersive environment. The city of Ames has had a history of flash flooding which has been a major cause of concern both in terms of loss of life and damage to property (Jeanne, 1999). The two basins of concern for the citizens of Ames are the Squaw Creek basin and the South Skunk River basin. Squaw Creek, which is a tributary of the South Skunk River, has a history of causing flash flooding in and around the city of Ames. During the Midwest floods of 1993, the creek caused unprecedented flooding, which resulted an estimated economic loss of $10 million (Snyder Associates, 1996). The Squaw Creek drainage area is small, covering approximately 563 km2. It has a narrow floodplain of about 0.5 km wide, which provides little storage capacity for flood waters (Snyder & Associates Inc., 1996). The main channel is about 53 km in length. Most of the area in Squaw Creek is in cultivation, with corn and soybeans being the major crops (Dideriksen, 1986). Smaller acreages of pastures, oats, hay and woodland are found as well. The predominantly agricultural landscape is due to the fact that soils are particularly fertile in this part of the state of Iowa. Due to the drainage network, the land use and the topography of the Squaw Creek basin, a flooding peak discharge response from peak precipitation usually occurs within only 12 hours (Snyder and Associates Inc., 1996). For nearly 100 years now, loss of life and considerable property damage has occurred because of flash flooding of the stream. Stream flow data from the US Geological Survey gauging station in Ames, 3.8 km upstream from the mouth of the basin, indicate that major floods have occurred several times (Glanville, 1987; Jeanne, 1998).
The main objectives defined for developing this flood mitigation system in a virtual environment, were 1) To study the hydrologic parameters of the Squaw Creek watershed area using quasi-distributed hydrologic modeling, and 2) To develop a flood mitigation system for the city of Ames in an immersive virtual environment, which supports geospatial analysis, hydrologic modeling and data visualization.
The development of the virtual environment required the collection, analysis, and manipulation of disparate data sets. The primary data sets for studying the hydrology of the Squaw Creek watershed area included the topographic data in the form of Digital Elevation model (DEM) of the area, soils data, land use/land cover data, Hydrologic Unit Code (HUC) data, rainfall data, and the stream flow data. The data sets obtained for the Squaw Creek watershed area were processed using ArcView GIS (Esri, 2002) and its extensions. A flow diagram of the processes involved in GIS-based hydrologic modeling and visualization is given in the Figure 2.
The Hydrologic Modeling System described earlier was used to achieve the first objective as a part of research being conducted by EIS Laboratory at Iowa State University. The HEC-HMS produced the flow vs. time relationships at various junctions along the stream, which were crucial for generating the dynamics of the stream and flood plain in the virtual environment. Some interesting �what-if� scenarios of land use, and land management were performed. After calibrating the model using the stream flow data for the June 1998 storm, the model was run on a Frequency Storm basis. The model was run to examine the hydrographs of 100 yr, 75 yr, 50 yr and 25 yr for the same conditions in 1998. Then the model was run for the same storm events by changing some of the sub basins to complete urban landuse, to examine the effects of urbanization on the hydrology of the Squaw Creek watershed. The results such as the hydrographs (flow vs. time) produced by the HEC-HMS for various storm events are stored in an output file (*.dss file). In order to read this file, the DSS viewer utility in HEC-RAS (River Analysis System) model was utilized. The hydrograph data was then stored in data files, which were then used to develop, visualize and analyze the hydrologic model results in the virtual environment.
After characterizing the hydrology of the Squaw Creek watershed and obtaining the modeling results from the hydrologic model, the next objective was to create the visualization environments. In order to design the visualization environment a number of issues such as the aesthetics of the visual environment, virtual reality tools and techniques to be used, costs associated with using the system, development of the terrain and other geospatial data sets, and user interactions etc. had to be taken into account.
The first task undertaken in this study was the development of the geometric primitives to be visualized in the visualization environment. This was accomplished by writing programs in C++ using OpenGL and GLUI libraries. OpenGL (Open Graphics Library) is a software interface consisting of several hundred functions and procedures for rendering high-quality 2D and 3D graphical images in the virtual environment (OpenGL, 2002). The GLUI User Interface Library is a GLUT-based (OpenGL Utility Toolkit) C++ user interface library, which provides controls such as buttons, checkboxes, radio buttons, and spinners to OpenGL applications. It is window-system independent, relying on GLUT to handle all system-dependent issues, such as window and mouse management. The basis of creating this virtual environment was that all geographic features could be represented as objects (points, lines and polygons) in this three dimensional environment. The data set of prime importance here was the topographic data in the grid format (DEM). The spatial attributes (x, y, and z) of the DEM were obtained by using the Grid2XYZ extension (Arc Scripts, Esri) in ArcView GIS, which was a part of the Geospatial Data Analysis System, described earlier. Using this extension, the spatial data was stored in a data file in a row-column order. This geo-referenced point data was then used to form adjacent triangular polygons using a simple triangulation technique of creating triangular polygonal strips in OpenGL (Figure 3). These triangular polygons can be considered as objects, which have parameters of the location of the points, elevation, and also hydrologic and environmental parameters obtained from the distributed hydrologic model, attached to it.
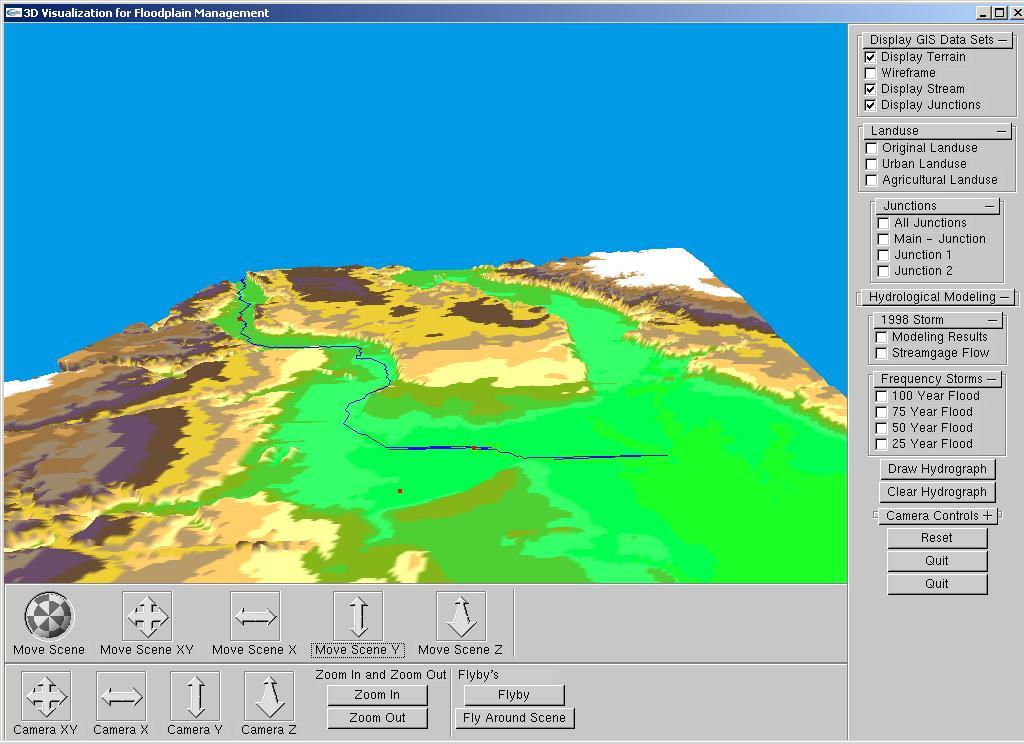
The terrain generation is an important step because it was used as a base map such that other data sets, which include the land use land, cover, soils data and the stream data from the hydrologic model could be overlaid on top of it to make intelligent environmental/hydrologic analysis. This was achieved by using texture-mapping techniques with C++ and OpenGL. The geometry of the stream network in the watershed area was obtained, by first converting the stream data (vector format) into a grid format. Then the Grid2XYZ extension in ArcView GIS was used to get the x, y, and z values. The stream geometry data file was then read and created as a line feature in the virtual environment (Figure 3). The other important feature for studying the hydrology was the junction data set, which was produced by the HEC-GeoHMS. The junctions are the points where the flow of two or more sub basins merges to form another stream channel. The hydrographs at these points give us the amount of flow contribution by the individual sub basins, which is quite important for studying the hydrology of the area under study. The junctions were created as point data sets in the desktop visualization environment and represented by small red cubes (Figure 3).
The user was given the capability to navigate through the scene by moving the observer as well as camera positions in the x, y, and z coordinate system. Also the user was given additional ability to pan, zoom in/out, and perform flyby�s of the area under study.
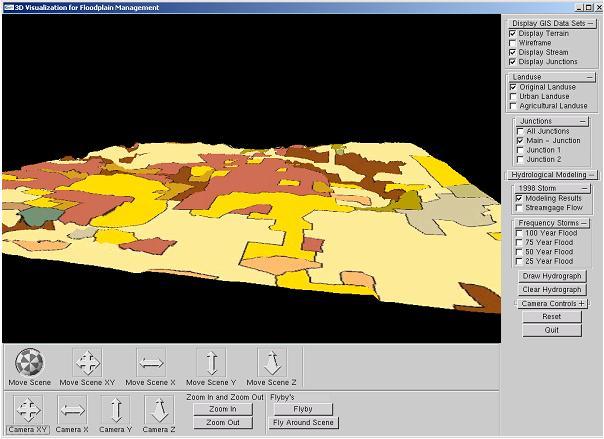
In order to study the effect of changes in land use type and their effects on the hydrology of the watershed, the user could select two types of land use types (original and urban). This was done by exporting the land use types as image files and texture-mapping them on top of the terrain using the environmental texture-mapping techniques in OpenGL (Figure 4).
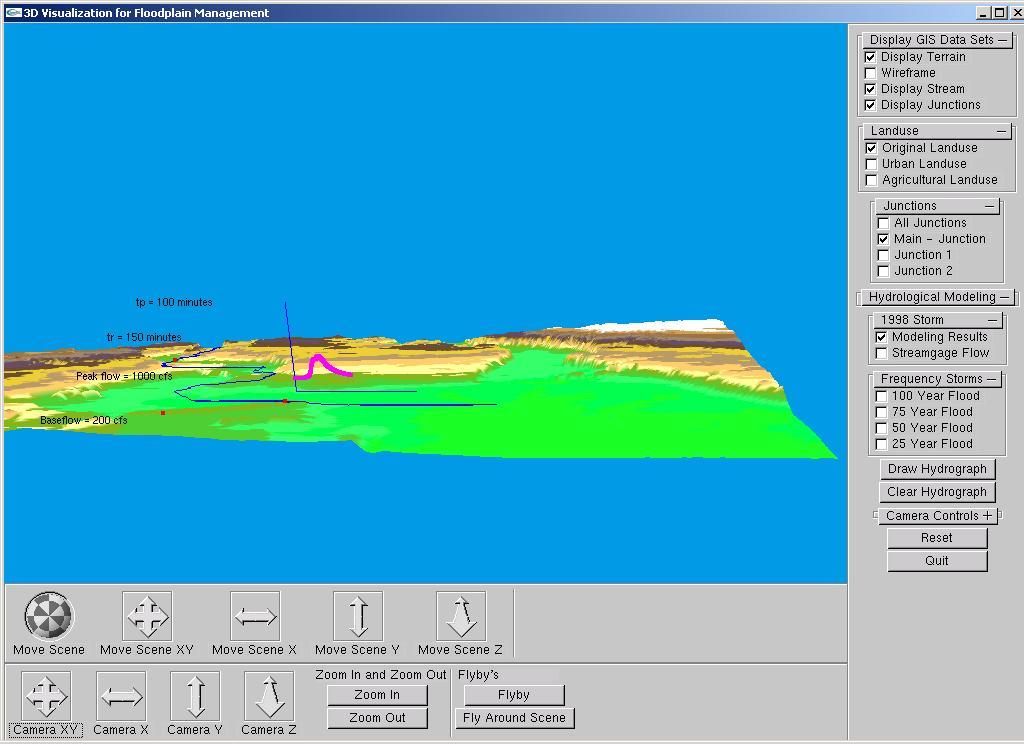
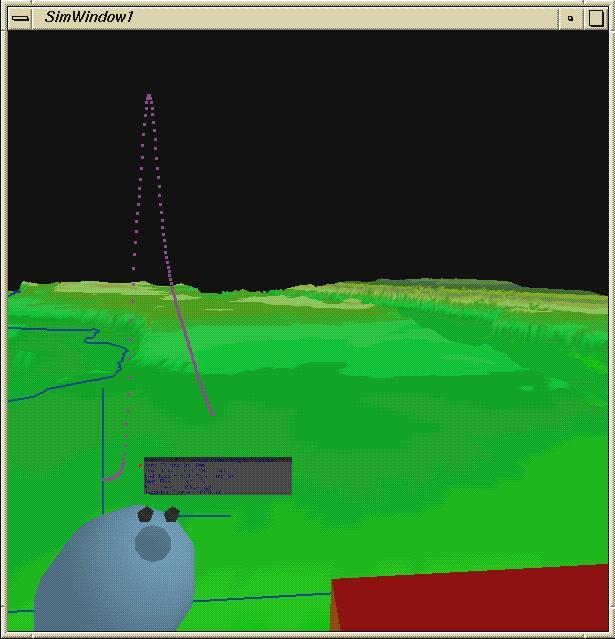
The results obtained by the HEC-HMS model for different storm events and land use types comprised basically of the hydrographs produced at various junctions. These results were converted into data files using the HEC-RAS DSS utility and Microsoft Excel. The hydrographs were created in the virtual environment from the flow vs. time data stored in these data files. The user could then display the flooding event information based on the type of land use, the junction for which the information is being sought and the storm event under consideration. After the user provided the input conditions for a particular storm event, the resulting hydrograph and information pertaining to it was displayed on the screen. For example, the user could visualize information for a 100 Yr flooding event for original land use condition at the main junction under study in an area. The user could then perform �what-ifs� land use changes and how it would impact the hydrologic response of the watershed to a particular storm event as shown in Figure 5. Some text information regarding the hydrograph such as storm event under consideration, time to peak, time to recession, flow at peak and recession, base flow, etc. was also displayed using the GLF font library and displaying the text in raster format. This information can be vital for decision makers in events of extreme flooding and reducing the response time.
In order to develop the partially immersive visualization system the geometric primitives, which included drawing and defining of the data sets obtained from the Geospatial Data Analysis System and the Hydrologic Modeling System, were drawn using the same routines as described earlier in the lowly immersive desktop visualization system. The Head Mounted Display (HMD) chosen for developing the virtual environment was the V8 Head Mounted Display (Virtual Research Systems Inc., 2002) as shown in Figure 6. The HMD was computer driven using the SGI computers. In order to transfer the application into the HMD and provide user interaction VRJuggler was used. VRJuggler is a C++ class library that is used as a framework for application development in virtual environments. VRJuggler controls the low-level aspects of the system on which the user application is executing and provides a generic interface to common input and output devices that VRJuggler can control. Besides controlling the graphics rendering, VRJuggler controls the VR devices, the graphic projection setup, multi-processing and process synchronization (VRJuggler, 2002).
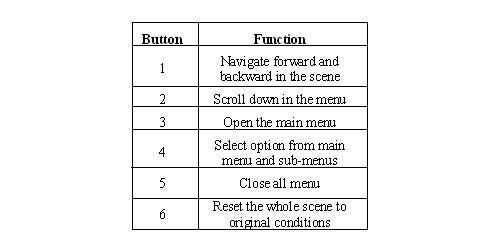
In order to provide the user with abilities to interact with the environmental and hydrologic data sets displayed in the virtual scene, the HMD wand was used (Figure 6). This wand has six buttons that can be used in order to perform different tasks in the virtual environments (Table 1). The buttons were synchronized with the application for providing input using VRJuggler. The user was given options to navigate in the three dimensional virtual environment by moving forward, backward and sideways using the wand. Also, the user had control over the speed with he or she travels in the virtual environment. For the user to perform various "what-if" analyses, a menu system was created in the virtual environment (Figure 7 and 8). The framework of the menu system used here was developed as part of the study related to design and analysis of spatial 4C mechanisms at the Virtual Reality Application Center (Dorozhkin et al., 2002). This menu system developed, was then manipulated for use in the development of the virtual flood mitigation system described here.
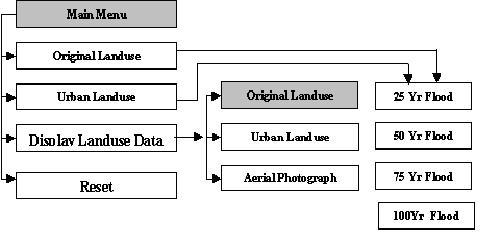
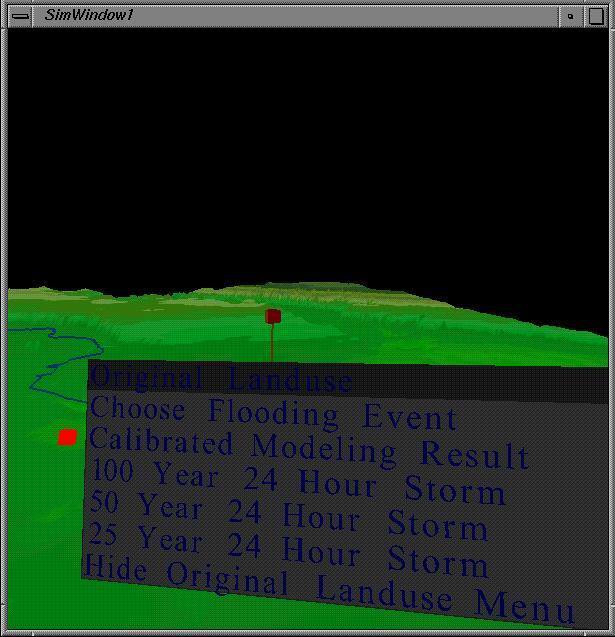
The menu system here was attached to the wand coordinate system and as soon as the user pressed Button 3, the menu system popped up about 3 feet away from the user in the HMD. The user was given the ability to choose the menu options while navigating through the scene. The user was given the ability to scroll down the menu system by pressing Button 2. The user could choose the type of land use in the main menu by pressing Button 4 and in the next menu choose the type of flood event he/she wanted to view the hydrograph for. The hydrographs were displayed in the head coordinate system and were placed about 3 feet away from the user in the HMD virtual environment. The hydrograph were always in front of the user�s head, which was tracked for its movement by a tracking device attached to the stereoscopic goggles, the user was wearing when immersed in the virtual environment. Thus the user chose different land use types and the different storm events for visualizing the results produced from the hydrologic model for the set of conditions provided. The visualization of the hydrologic modeling results in the virtual environment were based on the results already obtained from the model, run earlier based on the set of conditions provided.
The hydrographs for various flooding events could be viewed for a particular junction, if the user was within 0.5 feet of the junction in the HMD coordinate system. So, the user had to navigate to the junction, which was represented by a cube in the virtual environment and then choose various options from the menu (as described earlier) to view the results. In order to display information regarding the hydrograph, including information about the time to peak, base time, time to recession, and the corresponding flows at these times re displayed in a menu box, which was placed on the side of the hydrograph as shown in Figure 9.
In order to provide a better insight of the type of landuse type, the user was given an option in the main menu to display and visualize the different types of landuse data sets. The user was also given the options to view the aerial view of the City of Ames. This was achieved by texture mapping the aerial photographs on top of the terrain. This would help the user to have a better feel of the entire area and enhance decision-making in extreme flooding conditions.
The virtual immersive environment was developed to enhance the existing flood mitigation system for the Squaw Creek watershed and thus enhance decision-making for places, which are prone to frequent flash flooding. Additionally, the research will result in a resource that will enable hydrologists, engineers, emergency crews and city officials to determine the risks of flooding due to extreme hydrologic events, thereby avoiding potential loss of life and property, and enhancing flood mitigation strategies. City planners will have a view of the virtual scene of the actual landscape and make decision collaboratively based on the hydrologic and topographic parameters of the watershed.
The user will be able to perform all the operations of a traditional GIS in highly immersive three-dimensional virtual environment with better control and added navigational abilities of performing virtual fly-by of the terrain or zoom in to a particular area of interest and perform analysis at different levels of detail. This will enable the user to comprehend and analyze the data to address complex hydrologic/environmental issues in a virtual scene of the entire watershed under study. The user will be able to simulate a flooding situation, as is produced by the hydrologic model. By this the user will develop better understanding of the responses of the watershed area to a particular hydrologic event. This application can be used as a stepping-stone towards the realization of the applications for VR in hydrologic and environmental sciences.
There is a great opportunity for optimizing virtual reality tools and techniques in the field of hydrologic/environmental modeling in terms of increasing the level of user interaction possible with the data for enhanced decision-making and intelligent analysis. This research was focused to explore the new opportunities and promises the virtual reality technology offers for visualization of hydrologic and environmental data in a higher dimensional medium. The MoVE-Hydrology system developed was a successful move towards building an integrated system using Geographic Information Systems, Hydrologic Modeling and Virtual Reality. The results from a GIS-based hydrologic model, which was calibrated and run to study the hydrologic responses of the Squaw Creek watershed to varying intensity storm events, were taken and visualized in a lowly and partially immersive virtual environments. The system allows the user to analyze the geospatial datasets and hydrologic response of the watershed to various climatic conditions or precipitation events. The user can study the effect of land-use change on the hydrologic response of the watershed or the effect of landscape reconfiguration on hydrology. Such interactive geovisualization can be useful not only to hydrologists, but also to city planners concerned with impacts of urban sprawl.
The environment developed here was interactive in terms of the visualization but not in terms of the modeling. The results produced by the HEC-HMS hydrologic model, were run for a set of decision options as described earlier, prior to initiation of the visualization. In the longer term, a more direct link between modeling and visualization, adjustment of controls in the virtual environment and Nexrad data, should enhance real-time hydrologic modeling and flood management decisions. A real time coupling of the GIS-based hydrologic/environmental modeling system within the virtual environment would be highly desirable to increase realism, perception and real-time decision-making. This study is a move towards changing the way traditional hydrologic modeling is done by coupling geospatial data analysis along with powerful visualization techniques.
We would like to thank Denis Dorozhkin, Graduate student in the Virtual Reality Application Center (VRAC) at Iowa State University, for providing the framework of the menu system he developed as a part of his research and also for helping in the code. We would also like to thank Dr. Carolina Cruz-Neira for her able guidance regarding the development of the virtual environment.
Betty, M., M. Dodge, S. Doyle, and A. Smith. 1998. Modeling Virtual Environments. pp. 139-161. In Geocomputation: A Primer. P.A. Longley, S. M. Brooks, R. McDonnel, and B. Macmillan (eds.). New York: John Wiley & Sons Ltd.
Cronin, P. 1997 "Report on the Applications of Virtual Reality Technology to Education", HCRC, University of Edinburgh, Electronic Document: http://www.cogsci.ed.ac.uk/~paulus/vr.htm.
Cruz-Neira, C., Sandin, D. J., Defanti, T. A., Kentyon, R. V., & Hart, J. C. (1992). The CAVE �: audio visual experience automatic virtual environment. Communications of the ACM, 35(6), 64-72.
Doan, J. (2000). Geospatial Hydrologic Modeling Extension HEC-GeoHMS - User's Manual - Version 1.0. Davis, California.
Dorozhkin, D., Vance, J.M., "Implementing Speech Recognition in Virtual Reality". (in press) Proceedings of the 2002 ASME Computers and Information in Engineering Conference, DETC2002/CIE-34390, September 29-October 2, 2002 Montreal, Canada.
Didericksen, R.O., 1984. Soil survey of Story County, Iowa. US Department of Agriculture Soil Conservation Service, Washington, DC.
Esri, 2002. ArcView GIS 3.x User Documentation. (http://www.Esri.com/ software/arcview/index.html).
Glanville, T.D. 1987. Flood prediction and warning program for Squaw Creek at Ames, IA. PhD. Thesis, Iowa State University, 8 pp.
Goodchild, M. F., Steyaert, L. T., Parks, B. O., Johnston, C., Maidment, D., Crane, M. and Glendinning, S. (Eds.) (1996) GIS and Environmental Modeling: Progress and Research Issues, GIS World Books, Fort Collins, CO.
FEMA, 2002. Floodplain Management Summary.(http://www.fema.gov/mit/fldmit.htm).
Heim, M. 1997. The art of virtual reality. pp. 421-437. In Intelligent Environments: Spatial aspects of the information revolution. Amsterdam: North Holland Publishing Company.
Isdale, J. (1993) "What is Virtual Reality?", Electronic Document:(http://www.cms.dma. ac.uk/~cph/VR/whatisvr.html.
Jacobson, R. 1994, May/June. Virtual Worlds: A New Type of Design Environment. Virtual Reality World, pp. 46-52.
Jeanne, M. 1999. Weather radar-based runoff modeling for the Squaw Creek watershed in central Iowa. Master�s thesis, Iowa State University. 24 pp.
Keppell, M., Macpherson, C. 1997. "Is the Elephant Really There? - Virtual Reality in Education", Electronic Document: http://www.ddce.cqu.edu.au/ddce/ confsem/vr/present.html.
Koller, D., Lindstrom, P., Ribarsky, W., Hodges, L.F., Faust, N., and Turner, G. 1995 Virtual GIS: A Real-Time 3D Geographic Information System. In Proceedings of Visualization'95. GVU Technical Report 95-14.
OpenGL, 2002. OpenGL User Documentation. (http://www.opengl.org/)
Shepherd, I. 1994. Multi-sensory GIS: Mapping out the research frontier. In Advances in GIS research, Volume 1: 356�390. T. C. Waugh and M. Spitzer (eds.). London: Taylor & Francis.
Snyder & Associates, Inc. 1996. Final Report: Skunk River/Squaw Creek floodplain management study. Snyder & Associates, Inc., Ankeny, IA, pp. 278.
Tim, U. S. 1996. Emerging technologies for hydrologic and water quality modeling research. Transactions of the ASAE 39: 465-476.
USACE, 2002. United States Army Corps of Engineers.(http://www.usace.army.mil/who.html).
USACE, 2002. HEC-HMS (version 2.1) User Manual (http://www.hec.usace. army.mil/ software/ software_distrib/hec-hms/hechms program.html).
USACE, 2002. HEC-RAS (version 3.0) User Manual. (http://www.hec.usace.army. mil/software/software_distrib/hec-ras/hecrasprogram.html).
Verbree, E., G. van Maren, R. Germs, F. Jansen, and M.-J. Kraak, 1999. Interaction in virtual world views �Linking 3D GIS with VR. International Journal of Geographical Information Systems, 13(4): 385-396.
Virtual Research Systems, 2002. V8 Head Mounted Display Documentation. (http://www.virtualresearch.com/techV8.htm).
VRJuggler, 2002. VRJuggler User Documentation. (http://www.vrjuggler.org/).
Wesseling, C. G., D. J. Karssenberg, P. A. Burrough, and W. P. A. Van Deursen. 1996. Integrating dynamic environmental models in GIS: the development of a dynamic modeling language. Transactions in GIS 1:40 � 48.
Woo, M., Neider, J., Davis, T., and Shreiner, D., 1999. OpenGL Programming Guide � the official guide to learning OpenGL, version 1.2. Addison-Wesley Longman, Inc., Reading, MA.
Hardeep Bajwa
Graduate Research Assistant
Department of Agricultural & Biosystems Engineering
100 Davidson Hall
Iowa State University
Ames, IA 50011
Email: bajwa@iastate.edu
Phone: 515-294-3153
Fax: 515-294-4250
Dr. U. Sunday Tim
Associate Professor
Department of Agricultural & Biosystems Engineering
215 Davidson Hall
Iowa State University
Ames, IA 50011
Email: tim@iastate.edu
Phone: 515-294-4246