Abstract
LIDAR was flown over Grand Canyon in March and September of 2000 to assess its ability to provide a relatively low-cost, ecosystem-wide change detection tool. Determining the error associated with the elevation values of the LIDAR points was necessary to ensure that true change in the target resource was being recorded. This paper shall present the methods used to check the vertical accuracy of the LIDAR points, describe the results, and offer conclusions regarding the potential utility of using LIDAR as a change detection tool for monitoring downstream resources that are affected by hydropower operations.
Introduction
The Grand Canyon Monitoring and Research Center (GCMRC) of the U.S. Geological Survey studies the effects of water release from Glen Canyon Dam on the ecology of the Colorado River through Grand Canyon (from Lake Powell to Lake Mead) in order to develop release protocols that minimize any adverse effects on the river’s ecology. One way that scientists at the GCMRC monitor downstream resources is by measuring changes in sand bar size and volume that are the result of dam operations. Currently, sand bar area and volume changes are repeatedly measured using conventional ground survey techniques. This measurement method can be time-consuming, costly and intrusive, which may limit the change detection to a small percentage of the overall ecosystem. LIght Detecting and Ranging (LIDAR) technology seemed to offer a potential way to evaluate sediment changes throughout the ecosystem in a relatively short amount of time in a cost-effective and unintrusive manner. Before any change detection could be preformed using LIDAR, the vertical error of the LIDAR data needed to be assessed to ensure that LIDAR measurements were reflecting true changes in the resource and not simply vertical errors between different LIDAR flights.
LIDAR data were acquired over the eight study reaches in late March, in late August, and in middle September 2000 in order to assess changes in sandbar volume due to a spike water release by the Glen Canyon Dam in early September 2000. Topographic data were obtained simultaneously from ground surveys over the same river reaches. This paper assesses the vertical accuracy and precision of the LIDAR points to determine if LIDAR technology provides an adequate tool for monitoring changes in downstream resources.
Study Areas
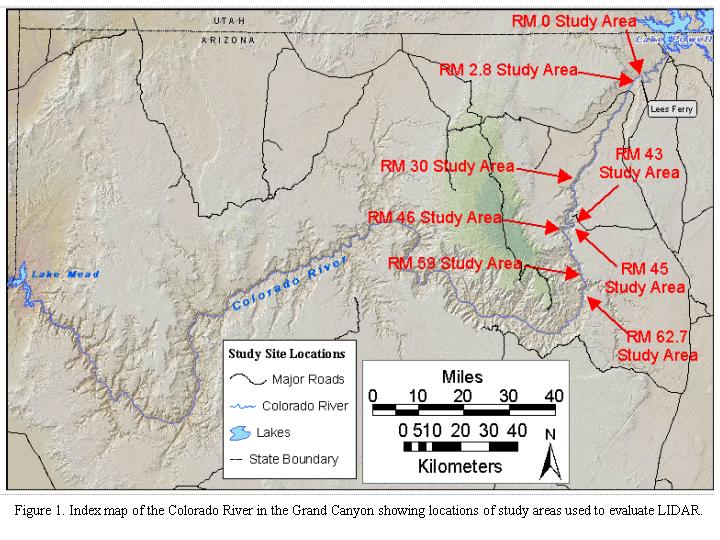
The eight areas used in our evaluations are located within the upper one-third of the Colorado River in Arizona (Figure 1). Five of these study areas are long-term monitoring sites for sediment storage (RM 2.8, RM 30, RM 43, RM 59, and RM 62.7; Figure 1). [RM refers to river mile from Lee’s Ferry, Arizona, which is designated as RM 0.] These sites were topographically mapped by ground survey crews during the LIDAR overflights in August and September 2000 and are referred to as the sandbar mapping surveys. In addition, spot elevation surveys of randomly selected LIDAR points were conducted in all eight study areas subsequent to the overflights; these ground surveys are referred to as stakeout surveys.
The five long-term monitoring sites are typically surveyed on an annual basis. With respect to sediment monitoring, a change in ground elevation at any location on a sand bar is deemed significant when the change exceeds 25 cm (either positive or negative; Schmidt et al., 1999). Thus, vertical (elevation) accuracies to identify such a change need to be at least 25 cm, preferably near the 15 cm level. Land survey methods currently employed for sediment monitoring produce vertical accuracies near 3-5 cm.
LIDAR Data Collection
LIDAR data were acquired over the Grand Canyon during three separate missions in the Spring and Fall of 2000. The Aeroscan ALMS sensor (operated by Earthdata, Maryland) was used to collect LIDAR data in late March. ALMS is a bi-directional, oscillating mirror system that operates at 1.064 µm wavelength. Data were collected at a flight altitude of 3,048 m, with a pulse rate of 15 kHz, and a scan rate of 13 Hz. This collection provided a swath width of 1,350 m, an average spot spacing of 3.75 m, and an average spot diameter of 1 m. The RAMS (Remote Airborne Mapping System, Enerquest, Colorado) sensor was used to collect LIDAR data in late August and in mid-September 2000. RAMS is also a bi-directional, oscillating mirror system that operates at 1.064 µm wavelength, using a pulse rate of 15Khz. A maximum of 5 returns could be captured for a single pulse, with multiple returns indicating canopy returns and the last return indicating, at best, the elevation of bare ground. The RAMS flight altitude was about 1,900 m, which produced a swath width of about 230 m, an average spot spacing of 1.5 m, and a spot diameter of about 0.5 m. Both the ALMS and RAMS LIDAR data used dual-frequency GPS (Global Positioning System) and IMU (Inertial Measurement Unit) information to determine the position and elevation of each data point. All LIDAR elevation data were delivered as orthometric heights (NVGD29, Geoid99) in meters above sea level (ASL).
Evaluation Mythologies
The accuracies of elevation data provided by LIDAR were evaluated using two approaches. In the first approach we visited randomly selected LIDAR point locations in the field, used a survey method called “stakeout” to move to the exact horizontal position of the LIDAR point, collected the elevation via conventional survey techniques and recorded the ground cover type, and then compared the elevation values. The advantage of this approach is that we could identify the type of ground surface at each LIDAR point location. General ground surface categories included bare sand, cobbles, boulders, talus, and rock ledges. The survey stakeout procedure was preformed through an iterative process where a rodman moves to the known LIDAR position being directed by a survey gun operator who occupies a known control point. Control points were surveyed using L1/L2 phase receivers with multiple vectors from Arizona Federal Base Network monuments. The surveyor relays the distance and direction that the rodman needs to move to get to the LIDAR point. When the rodman was within 10 cm of the LIDAR point position, the surveyor recorded the ground surface elevation using conventional survey techniques while the rodman recorded the type of ground surface. Both the ALMS and RAMS data were evaluated at each study area, except in study area RM 59 where only RAMS data were examined.
In order to obtain a larger statistical sample and representation of the elevation error at each study site, we employed a second evaluation method that compared LIDAR point elevations with the ground survey point elevations that were acquired at the five long-term monitoring areas during the LIDAR over flights.
Ground survey sandbar mapping was accomplished using Topcon electronic total stations equipped with TDS digital data collectors. Surveyed points were acquired in Arizona State Plane – Arizona Central coordinate system with atmospheric pressure, earth curvature and scale factor accounted for. Accuracy and precision of these techniques have been assessed by Kaplinski et al. [1995], who also verified all benchmark and back site relationships. Verification of horizontal position and elevation data found that ground points have a horizontal error of <0.1 m and a vertical error <0.05 m. Volume calculations derived from topographic surface models created from replicate daily surveys at one site were shown to vary less than three percent [Beus et al., 1992].
For this comparison, we only used LIDAR points that occurred within a 0.5-m radius of a ground topographic survey point. If more than one LIDAR point occurred within this radius for a particular ground survey point, then a distance-weighted average LIDAR elevation was calculated for that ground survey point. Only points occurring on non-vegetated ground were considered in this particular analysis. The LIDAR versus sandbar mapping ground survey elevation comparisons did not separate bare sand, boulder, talus, and cobble surfaces.
Any change detection analysis requires the use of a measurement technique that provides acceptable levels of reproducibility, as well as acceptable levels of accuracy. We assessed the reproducibility of LIDAR technology using the RAMS data that were acquired at the long-term monitoring sites at two separate times (in late August and in mid-September of 2000). We performed this analysis at study area RM 59 because the study area has large tracts of bare-ground and vegetated surfaces at elevations high enough to have been unaffected by the intervening (early September) spike-flow release from the Glen Canyon dam. Five separate bare-ground and vegetated-ground surfaces within study area RM 59 were selected for our analysis based on the orthorectified CIR image data of the study. The bare-ground surfaces included sand and rock debris; the vegetated-ground surfaces included mostly dense tamarisk groves and scattered mesquite trees. The shoreward border established for each bare-ground and vegetated-ground surface unit was several meters from the shoreline to minimize topographic change in the areas due to the intervening high flow levels. Within each established bare-ground and vegetated-ground unit at the five test sites, we collected all pre-spike-flow LIDAR elevation points that had at least one post-spike-flow LIDAR elevation point within a radius of 0.5 m. When more than one post-spike-flow LIDAR point occurred within 0.5 m of a pre-high-flow LIDAR point, a distance-weighted average elevation was calculated from these post-spike-flow elevation points.
Results
Stakeout Surveys
The average errors in the LIDAR elevation data are reported in Table 1 as two values: (1) the average elevation offset between the LIDAR point elevations and the surveyed ground elevations and (2) the average elevation error (accuracy) of the LIDAR data at a particular study area (determined by averaging absolute elevation difference within a study site). The stakeout spot survey data for all bare ground surfaces except rock ledges indicate that (1) the LIDAR elevations are generally higher than the ground survey elevations, (2) the RAMS elevation data are consistently more accurate than the ALMS elevation data, (3) the accuracy of the RAMS elevation data ranges from 0.12-0.23 m, except at RM 46 and RM 59 where accuracies are 0.77 m and 0.53 m, respectively, and (4) the accuracy of the ALMS elevation data ranges from 0.14-0.60 m, except at RM 45 where accuracy is 0.79 m. Both the RAMS and ALMS systems claim an absolute vertical accuracy of 15 cm. The stakeout survey showed that the RAMS met or exceeded the contract specification of 15 cm at only two sites, while the ALMS met this specification at only one site.
The cumulative elevation errors for all study areas for bare sand surfaces, boulder and cobble surfaces, and for rock ledges revealed some counterintuitive results. One would expect that the uneven boulder/cobble topographic surface would create greater vertical errors than the uniform, flat sand beaches. However, our findings show that the elevation errors for bare sand and boulder-cobble surfaces have similar ranges and similar average error values (0.35 m for bare sand and 0.31 m for boulder-cobble surfaces). The rock ledges at study area RM 59 have a higher elevation error (0.67 m) than the other bare ground surfaces, which is attributed in part to the higher elevation errors found at study area RM 59 for all types of surfaces (0.53 m for bare sand and boulder-cobble surfaces; Table 1) and in part to uncertainties in the exact horizontal location of the LIDAR pulse returns on the ledges with overhangs.
Sandbar mapping Surveys
Comparisons between sandbar mapping ground survey data and RAMS LIDAR data for the five long-term monitoring areas were made by creating x-y scatter plots and frequency distributions of elevation differences. An example is shown in Figure 2 for Site RM 2.8. The x-y scatter plots show that the RAMS LIDAR point elevations are generally parallel to the ground survey elevations, except at study areas RM 59 and RM 62.7, and that on average the RAMS LIDAR elevations are higher than the ground survey elevations (0.09-0.28 m; Table 2). The average elevation errors for the five study areas range from 0.11m to 0.28 m (Table 2), with only one site meeting the contract specification of 15 cm. Study area RM 59 has the sparsest sandbar mapping ground survey data and the highest elevation error (0.28 m), however, this elevation error is much less than that found by the stakeout spot surveys conducted in the study (0.53 m; Table 1).
The ALMS elevation data for bare ground surfaces were similarly evaluated. The point distribution in its x-y scatter plots show a more scattered distribution than that shown by the RAMS data. In addition, unlike the RAMS data, the ALMS data is not generally parallel to the ground survey data and therefore could not be corrected with a simple offset adjustment. For all study sites except one (RM 30 is offset by -0.06m; Table 2), the ALMS elevations are higher than the ground survey data (0.06-0.75m; Table 2). The average elevation errors for the five study areas range from 0.33m to 0.84 m (Table 2), with no sites meeting the contract specification of 15 cm. The ALMS elevation errors are significantly larger than the RAMS errors, which correspond to the findings of the stakeout survey.
An accuracy assessment of LIDAR data acquired over Atlantic coastal beaches also showed LIDAR data to be parallel to, but offset from, the true surface (Shrestha et al., 1999). The observed offsets ranged from +0.20 m to -0.10 m. The observed offsets were used to adjust the LIDAR data down or up to the true ground surface. This adjustment approach could be employed in the Grand Canyon, but the approach would require careful selection of the “ground truth” points to make the adjustments. The ground truth points would have to be much larger in area than the horizontal positional accuracy of LIDAR and the elevations of the ground truth points would have to be stable, similar to a topographic control network.
Assuming that elevation offsets could be accurately determined in an operational sense for LIDAR data acquired in the Grand Canyon, we applied the elevation offsets found at each study area to their respective LIDAR data and recomputed the elevation errors at each study area. The adjusted elevation errors for the RAMS LIDAR data are lower than their unadjusted elevation errors in all the study areas; the adjusted elevation errors range from 0.06 m to 0.17 m (Table 2). In contrast, the adjusted elevation errors for the ALMS LIDAR data are nearly the same as the unadjusted error values at most sites (ranging from 0.21m to 0.85m; Table 2). This disparity between the datasets reflects the fact that the RAMS LIDAR data has a consistent, parallel offset from the surface (and is therefore potentially correctable), while the ALMS LIDAR data fluctuates in an inconsistent manner that makes it impossible to apply a correction factor.
Reproducibility of LIDAR data
Table 3 summarizes the reproducibility results for each of the five study sites within study area RM 59 as two different measures of the correspondence between pre- and post-spike-flow elevations for bare-ground and vegetated surfaces. The second column in Table 3 represents the elevation offset between the two LIDAR data sets. The elevation offsets for all of the bare-ground and vegetated-ground units are relatively small (overall average of 0.13 m for bare ground and 0.12 m for vegetated surfaces; Table 3) and may be eliminated by “grounding” each LIDAR survey data set using stable ground elevation control points. The third column in Table 3 shows the precision of the RAMS LIDAR data, which averages 0.23 m for bare ground and 0.63 m for vegetated terrain. The larger disparities between pre- and post-spike-flow elevations within the vegetated terrain relative to those within bare-ground terrain are reflected in the lower precision of the LIDAR data in the vegetated terrain (Table 3). The low precisions for vegetated terrain demonstrate the random nature of LIDAR’s penetration in the canopies. The high proportion of elevation differences in the 1-2 m range in vegetated terrain will make detection of local elevation changes on vegetated sand bars at a 0.25-m level nearly impossible.
Conclusions
The vertical accuracy and precision of the LIDAR elevation data were evaluated in several river reaches within the Grand Canyon to determine if this remote-sensing technique can provide reliable data for change detection of various downstream resources. The results of these evaluations are summarized below:
1. Both LIDAR contractors claimed an absolute vertical accuracy of 15 cm. Comparison against two different ground elevation surveys at various sites throughout the river corridor showed both LIDAR datasets failed to meet this specification in most cases. Thoughtful scrutiny needs to be given to any claims of accuracy by LIDAR operators.
2. The precision of the LIDAR elevation data is 0.23 m on bare ground and 0.63 m on vegetated ground suggesting that sediment volume estimates using LIDAR data within vegetation may produce high uncertainties in temporal analyses.
3. Average LIDAR elevations are consistently higher than ground elevations at all study sites, but the elevation offset is different at each river reach. At some river reaches, the LIDAR elevation data parallels the ground surface suggesting an adjustment could be made to “ground” the data. However, the variable nature of the adjustment along the river corridor would require extensive ground control throughout the river corridor. This apparent characteristic of LIDAR data makes its application almost as limiting as photogrammetry, which also needs ground control panels.
4. The type of ground substrate, e.g. sand vs. boulder, seems to have little effect upon the accuracy of the LIDAR data.
5. The current state of LIDAR technology does not provide adequate vertical precision and accuracy to replace the current method of conventional total station topographic surveying for monitoring volume change of sediment resources affected by operations of Glen Canyon Dam.
Table 1. Comparison of elevations obtained from the RAMS and ALMS LIDAR versus stakeout surveyed elevations at various reaches of the Colorado River ecosystem between Glen Canyon Dam and just south of the Little Colorado River confluence. Geographic locations are referenced to the State Plane coordinate system, Central Arizona, FIPSZone 202.
| ALMS River Mile 0 |
||||||
| Northing (meters) |
Easting (meters) |
LIDAR (meters ASL) |
Survey (meters ASL) |
LIDAR minus Survey (meters) |
Cover Type |
|
| 649582.4 |
241338.6 |
944.42 |
944.16 |
0.26 |
bare sand |
|
| 649581.2 |
241203.0 |
952.33 |
952.08 |
0.25 |
bare sand |
|
| 649580.6 |
241210.5 |
952.07 |
951.80 |
0.27 |
bare sand |
|
| 649579.8 |
241186.5 |
953.89 |
953.67 |
0.22 |
bare sand |
|
| 649577.8 |
241195.7 |
953.17 |
952.87 |
0.30 |
bare sand |
|
| 649577.5 |
241308.9 |
946.80 |
946.49 |
0.31 |
bare sand |
|
| 649577.2 |
241202.0 |
952.25 |
952.00 |
0.25 |
bare sand |
|
| 649575.8 |
241327.6 |
945.79 |
945.20 |
0.59 |
bare sand |
|
| 649573.5 |
241319.6 |
946.35 |
945.70 |
0.65 |
bare sand |
|
| 649576.1 |
241334.4 |
944.55 |
944.14 |
0.41 |
sand - boulder |
|
| 649577.5 |
241321.3 |
946.34 |
945.83 |
0.51 |
sand - 60cm boulder |
|
| Elevation offset |
0.37 ± 0.15 |
|||||
| Elevation error |
0.37 ± 0.15 |
|||||
| RAMS River Mile 0 |
||||||
| Northing (meters) |
Easting (meters) |
LIDAR (meters ASL) |
Survey (meters ASL) |
LIDAR minus Survey (meters) |
Cover Type |
|
| 649584.3 |
241196.5 |
953.46 |
953.21 |
0.25 |
bare sand |
|
| 649584.2 |
241326.3 |
946.14 |
945.88 |
0.26 |
bare sand |
|
| 649583.9 |
241206.8 |
952.34 |
952.06 |
0.28 |
bare sand |
|
| 649584.0 |
241334.5 |
944.90 |
944.74 |
0.16 |
bare sand |
|
| 649583.9 |
241186.9 |
954.31 |
954.05 |
0.26 |
bare sand |
|
| 649584.2 |
241337.1 |
944.54 |
944.72 |
-0.18 |
boulder - 30 cm |
|
| Elevation offset |
0.17 ± 0.18 |
|||||
| Elevation error |
0.23 ± 0.05 |
|||||
| ALMS River Mile 2.8 |
||||||
| Northing (meters) |
Easting (meters) |
LIDAR (meters ASL) |
Survey (meters ASL) |
LIDAR minus Survey (meters) |
Cover Type |
|
| 648014.5 |
240109.9 |
951.35 |
951.11 |
0.24 |
bare sand - 30 cm veg |
|
| 648027.3 |
240110.9 |
950.71 |
950.57 |
0.14 |
bare sand - 30 cm veg |
|
| 648030.5 |
240108.8 |
951.61 |
951.26 |
0.35 |
veg - boulder |
|
| 648042.7 |
240107.0 |
951.68 |
950.24 |
1.44 |
sand - boulder |
|
| 648037.0 |
240104.5 |
951.93 |
952.14 |
-0.21 |
boulder |
|
| 648025.2 |
240146.4 |
956.10 |
954.90 |
1.20 |
boulder |
|
| Elevation offset |
0.53 ± 0.65 |
|||||
| Elevation error |
0.60 ± 0.57 |
|||||
| RAMS River Mile 2.8 |
||||||
| Northing (meters) |
Easting (meters) |
LIDAR (meters ASL) |
Survey (meters ASL) |
LIDAR minus Survey (meters) |
Cover Type |
|
| 648021.4 |
240135.7 |
955.97 |
956.07 |
-0.10 |
control boulder - flat surface |
|
| 648021.3 |
240137.2 |
956.25 |
956.36 |
-0.11 |
control boulder - flat surface |
|
| 648021.2 |
240138.6 |
956.60 |
956.67 |
-0.07 |
control boulder - flat surface |
|
| 648022.0 |
240141.4 |
954.44 |
954.82 |
-0.38 |
control boulder - flat surface |
|
| 648022.2 |
240139.8 |
956.91 |
956.99 |
-0.08 |
control boulder - flat surface |
|
| 648022.3 |
240136.9 |
956.38 |
956.42 |
-0.03 |
control boulder - flat surface |
|
| 648022.4 |
240135.4 |
956.07 |
956.13 |
-0.06 |
control boulder - flat surface |
|
| 648022.4 |
240134.0 |
955.76 |
955.81 |
-0.05 |
control boulder - flat surface |
|
| 648022.0 |
240142.3 |
955.09 |
954.67 |
0.42 |
boulder - 20 cm |
|
| 648021.9 |
240144.1 |
955.22 |
955.31 |
-0.09 |
boulder - 60 cm |
|
| 648021.2 |
240142.0 |
955.16 |
955.10 |
0.06 |
boulder - 60 cm |
|
| 648024.6 |
240134.5 |
956.13 |
956.21 |
-0.08 |
boulder - 100 cm |
|
| 648024.6 |
240136.0 |
956.38 |
956.47 |
-0.09 |
boulder - 100 cm |
|
| 648024.5 |
240137.4 |
956.68 |
956.76 |
-0.08 |
boulder - 100 cm |
|
| Elevation offset |
-0.05 ± 0.17 |
|||||
| Elevation error |
0.12 ± 0.12 |
|||||
ALMS River Mile 30 |
||||||
| Northing (meters) |
Easting (meters) |
LIDAR (meters ASL) |
Survey (meters ASL) |
LIDAR minus Survey (meters) |
Cover Type |
|
| 611888.1 |
219591.1 |
884.06 |
883.90 |
0.16 |
bare sand |
|
| 611894.1 |
219580.8 |
888.48 |
889.26 |
-0.77 |
bare sand |
|
| 611893.2 |
219578.9 |
888.32 |
887.65 |
0.67 |
bare sand |
|
| 611887.2 |
219589.2 |
884.40 |
884.23 |
0.17 |
bare sand |
|
| 611885.4 |
219588.8 |
883.99 |
883.48 |
0.51 |
bare sand |
|
| 611893.5 |
219575.0 |
888.73 |
888.10 |
0.63 |
bare sand |
|
| 611893.0 |
219572.4 |
887.88 |
887.08 |
0.80 |
bare sand |
|
| 611892.6 |
219569.4 |
886.99 |
886.74 |
0.25 |
bare sand |
|
| 611892.2 |
219566.1 |
886.83 |
886.07 |
0.76 |
bare sand |
|
| 611888.9 |
219567.6 |
886.31 |
885.63 |
0.68 |
bare sand |
|
| 611891.0 |
219564.2 |
886.30 |
885.81 |
0.49 |
bare sand |
|
| 611891.2 |
219559.5 |
887.41 |
887.42 |
-0.01 |
bare sand |
|
| 611889.2 |
219562.9 |
885.93 |
885.69 |
0.25 |
bare sand |
|
| 611885.1 |
219565.7 |
885.34 |
884.96 |
0.38 |
bare sand |
|
| 611888.2 |
219556.4 |
887.34 |
887.34 |
0.00 |
bare sand |
|
| 611884.1 |
219563.3 |
885.19 |
885.09 |
0.10 |
bare sand |
|
| 611885.8 |
219556.2 |
887.50 |
886.89 |
0.61 |
bare sand |
|
| 611882.4 |
219553.7 |
886.92 |
886.51 |
0.41 |
bare sand |
|
| Elevation offset |
0.34 ± 0.38 |
|||||
| Elevation error |
0.43 ± 0.27 |
|||||
RAMS River Mile 30 |
||||||
| Northing (meters) |
Easting (meters) |
LIDAR (meters ASL) |
Survey (meters ASL) |
LIDAR minus Survey (meters) |
Cover Type |
|
| 611881.21 |
219552.59 |
886.73 |
886.29 |
0.44 |
bare sand |
|
| 611880.2 |
219554.01 |
886.54 |
886.09 |
0.45 |
bare sand |
|
| 611879.89 |
219556.6 |
885.93 |
885.61 |
0.32 |
bare sand |
|
| 611880.91 |
219555.18 |
886.34 |
886.26 |
0.08 |
bare sand |
|
| 611881.93 |
219553.76 |
886.78 |
886.42 |
0.37 |
bare sand |
|
| 611882.97 |
219552.33 |
887.28 |
887.10 |
0.18 |
bare sand |
|
| 611883.25 |
219555.02 |
886.81 |
886.54 |
0.27 |
bare sand |
|
| 611882.25 |
219556.43 |
886.55 |
886.19 |
0.36 |
bare sand |
|
| 611881.24 |
219557.85 |
886.24 |
885.86 |
0.38 |
bare sand |
|
| 611882.91 |
219557.68 |
886.27 |
886.30 |
-0.03 |
bare sand |
|
| 611883.29 |
219560.25 |
886.18 |
885.82 |
0.36 |
bare sand |
|
| 611882.21 |
219582.7 |
884.46 |
884.91 |
-0.45 |
bare sand |
|
| 611882.58 |
219584.24 |
884.17 |
884.28 |
-0.11 |
bare sand |
|
| 611883.09 |
219586.55 |
883.80 |
883.60 |
0.20 |
bare sand |
|
| 611883.22 |
219588.35 |
883.34 |
883.20 |
0.14 |
bare sand |
|
| 611882.04 |
219593.06 |
882.60 |
882.19 |
0.41 |
bare sand |
|
| 611882.94 |
219593.79 |
882.84 |
882.26 |
0.58 |
bare sand |
|
| 611883.91 |
219592.41 |
882.76 |
882.50 |
0.26 |
bare sand |
|
| Elevation offset |
0.23 ± 0.24 |
|||||
| Elevation error |
0.30 ± 0.15 |
|||||
| ALMS River Mile 43 |
||||||
| Northing (meters) |
Easting (meters) |
LIDAR (meters ASL) |
Survey (meters ASL) |
LIDAR minus Survey (meters) |
Cover Type |
|
| 598575.3 |
218961.3 |
866.38 |
866.17 |
0.21 |
bare sand |
|
| 598546.9 |
218961.3 |
863.42 |
863.41 |
0.01 |
bare sand |
|
| 598543.2 |
218964.2 |
862.98 |
862.75 |
0.23 |
bare sand |
|
| 598574.0 |
218964.9 |
866.14 |
866.21 |
-0.07 |
boulder - 30 cm |
|
| 598571.6 |
218965.6 |
866.04 |
865.89 |
0.15 |
boulder - 30 cm |
|
| Elevation offset |
0.11 ± 0.13 |
|||||
| Elevation error |
0.14 ± 0.09 |
|||||
| RAMS River Mile 43 |
||||||
| Northing (meters) |
Easting (meters) |
LIDAR (meters ASL) |
Survey (meters ASL) |
LIDAR minus Survey (meters) |
Cover Type |
|
| 598575.7 |
218959.1 |
866.78 |
866.41 |
0.37 |
bare sand |
|
| 598560.4 |
218959.7 |
864.88 |
864.60 |
0.28 |
bare sand |
|
| 598558.6 |
218959.3 |
864.65 |
864.49 |
0.16 |
bare sand |
|
| 598556.8 |
218958.9 |
864.57 |
864.50 |
0.07 |
bare sand |
|
| 598547.7 |
218958.9 |
863.78 |
863.66 |
0.12 |
bare sand |
|
| 598546.0 |
218958.5 |
863.48 |
863.30 |
0.19 |
bare sand |
|
| 598544.3 |
218959.0 |
863.31 |
863.13 |
0.18 |
bare sand |
|
| 598576.8 |
218963.6 |
866.26 |
866.19 |
0.07 |
cobbles |
|
| 598542.5 |
218958.6 |
862.96 |
862.81 |
0.15 |
cobbles |
|
| 598565.4 |
218958.7 |
865.80 |
865.63 |
0.17 |
boulder - 10 cm |
|
| 598561.1 |
218958.6 |
865.18 |
865.04 |
0.14 |
boulder - 10 cm |
|
| 598577.7 |
218962.6 |
866.31 |
866.26 |
0.05 |
boulder - 15 cm |
|
| 598577.6 |
218964.7 |
866.23 |
866.32 |
-0.09 |
boulder - 30 cm |
|
| 598569.9 |
218958.7 |
866.40 |
866.46 |
-0.06 |
boulder - 90 cm/veg - 300 cm |
|
| Elevation offset |
0.13 ± 0.12 |
|||||
| Elevation error |
0.15 ± 0.09 |
|||||
| ALMS River Mile 45 |
||||||
| Northing (meters) |
Easting (meters) |
LIDAR (meters ASL) |
Survey (meters ASL) |
LIDAR minus Survey (meters) |
Cover Type |
|
| 597041.0 |
218407.9 |
860.30 |
859.13 |
1.17 |
bare sand |
|
| 597036.2 |
218408.4 |
860.18 |
859.64 |
0.54 |
bare sand |
|
| 597041.3 |
218408.8 |
860.30 |
859.49 |
0.81 |
bare sand |
|
| 597041.6 |
218410.3 |
860.28 |
859.71 |
0.57 |
bare sand |
|
| 597041.3 |
218411.2 |
860.77 |
859.92 |
0.85 |
bare sand |
|
| Elevation offset |
0.79 ± 0.25 |
|||||
| Elevation error |
0.79 ± 0.25 |
|||||
| RAMS River Mile 46 |
||||||
| Northing (meters) |
Easting (meters) |
LIDAR (meters ASL) |
Survey (meters ASL) |
LIDAR minus Survey (meters) |
Cover Type |
|
| 596964.2 |
217753.1 |
864.19 |
863.47 |
0.72 |
boulder - 30 cm - cliff |
|
| 596944.0 |
217715.0 |
867.60 |
866.68 |
0.92 |
boulder - 50 cm |
|
| 596938.0 |
217718.0 |
864.69 |
863.42 |
1.27 |
boulder - 100 cm |
|
| 596942.2 |
217713.8 |
866.21 |
867.03 |
-0.82 |
boulder - 150 cm |
|
| 596961.9 |
217749.1 |
865.55 |
865.70 |
-0.15 |
boulder - 200 cm |
|
| Elevation offset |
0.39 ± 0.85 |
|||||
| Elevation error |
0.77 ± 0.41 |
|||||
| RAMS River Mile 59 |
||||||
| Northing (meters) |
Easting (meters) |
LIDAR (meters ASL) |
Survey (meters ASL) |
LIDAR minus Survey (meters) |
Cover Type |
|
| 578606.8 |
222918.3 |
835.21 |
834.63 |
0.58 |
bare sand |
|
| 578605.3 |
222918.4 |
834.97 |
834.51 |
0.46 |
bare sand |
|
| 578604.0 |
222918.2 |
834.65 |
834.39 |
0.26 |
bare sand |
|
| 578597.8 |
222919.5 |
835.19 |
834.50 |
0.69 |
bare sand |
|
| 578590.4 |
222917.9 |
833.69 |
832.64 |
1.05 |
bare sand |
|
| 578580.0 |
222931.2 |
837.87 |
837.87 |
0.00 |
talus |
|
| 578579.3 |
222931.8 |
838.10 |
837.50 |
0.60 |
talus |
|
| 578609.5 |
222921.4 |
836.40 |
835.78 |
0.62 |
boulder - 50 cm |
|
| 578577.9 |
222932.0 |
837.75 |
837.22 |
0.53 |
boulder - 50 cm |
|
| 578577.0 |
222932.5 |
837.75 |
837.21 |
0.54 |
boulder - 100 cm |
|
| Elevation offset |
0.53 ± 0.27 |
|||||
| Elevation error |
0.53 ± 0.27 |
|||||
| RAMS River Mile 59 |
||||||
| Northing (meters) |
Easting (meters) |
LIDAR (meters ASL) |
Survey (meters ASL) |
LIDAR minus Survey (meters) |
Cover Type |
|
| 578607.6 |
222920.1 |
835.91 |
835.15 |
0.76 |
tapeats ledge |
|
| 578603.5 |
222920.1 |
835.55 |
835.08 |
0.47 |
tapeats ledge |
|
| 578603.8 |
222923.4 |
838.32 |
836.71 |
1.61 |
tapeats ledge |
|
| 578602.7 |
222924.0 |
838.62 |
836.92 |
1.70 |
tapeats ledge |
|
| 578601.1 |
222923.5 |
837.76 |
836.89 |
0.87 |
tapeats ledge |
|
| 578600.2 |
222924.6 |
839.18 |
837.78 |
1.40 |
tapeats ledge |
|
| 578598.1 |
222925.4 |
839.41 |
838.08 |
1.33 |
tapeats ledge |
|
| 578597.2 |
222923.8 |
837.76 |
836.92 |
0.84 |
tapeats ledge |
|
| 578596.1 |
222924.2 |
837.92 |
837.50 |
0.42 |
tapeats ledge |
|
| 578596.9 |
222925.8 |
839.54 |
837.81 |
1.73 |
tapeats ledge |
|
| 578589.7 |
222919.1 |
834.36 |
834.00 |
0.36 |
tapeats ledge |
|
| 578588.4 |
222921.8 |
835.79 |
834.27 |
1.52 |
tapeats ledge |
|
| 578587.6 |
222920.2 |
834.44 |
834.11 |
0.33 |
tapeats ledge |
|
| 578586.8 |
222921.3 |
834.60 |
834.14 |
0.46 |
tapeats ledge |
|
| 578587.8 |
222923.1 |
835.47 |
834.65 |
0.82 |
tapeats ledge |
|
| 578587.0 |
222924.5 |
837.27 |
836.95 |
0.32 |
tapeats ledge |
|
| 578585.5 |
222921.1 |
834.44 |
834.10 |
0.34 |
tapeats ledge |
|
| 578584.6 |
222921.9 |
834.47 |
834.17 |
0.30 |
tapeats ledge |
|
| 578586.3 |
222925.3 |
837.24 |
837.00 |
0.24 |
tapeats ledge |
|
| 578585.0 |
222925.5 |
837.30 |
836.98 |
0.32 |
tapeats ledge |
|
| 578583.2 |
222922.1 |
834.26 |
834.06 |
0.20 |
tapeats ledge |
|
| 578583.8 |
222925.7 |
837.26 |
837.00 |
0.26 |
tapeats ledge |
|
| 578582.6 |
222926.1 |
837.32 |
837.01 |
0.31 |
tapeats ledge |
|
| 578581.9 |
222924.5 |
837.08 |
836.78 |
0.30 |
tapeats ledge |
|
| 578580.6 |
222927.1 |
837.21 |
837.04 |
0.17 |
tapeats ledge |
|
| 578579.8 |
222925.3 |
836.76 |
836.67 |
0.09 |
tapeats ledge |
|
| Elevation offset |
0.67 ± 0.53 |
|||||
| Elevation error |
0.67 ± 0.53 |
|||||
| ALMS River Mile 62.7 |
||||||
| Northing (meters) |
Easting (meters) |
LIDAR (meters ASL) |
Survey (meters ASL) |
LIDAR minus Survey (meters) |
Cover Type |
|
| 574738.1 |
222589.4 |
825.48 |
826.21 |
-0.73 |
bare sand |
|
| 574770.9 |
222608.8 |
832.89 |
833.16 |
-0.27 |
bare sand |
|
| 574757.5 |
222594.1 |
831.22 |
831.66 |
-0.44 |
bare sand |
|
| 574756.1 |
222605.2 |
831.71 |
831.84 |
-0.13 |
bare sand |
|
| 574746.0 |
222589.0 |
827.44 |
827.29 |
0.15 |
bare sand |
|
| 574743.3 |
222587.9 |
826.76 |
826.90 |
-0.14 |
bare sand |
|
| 574756.6 |
222601.4 |
832.00 |
831.74 |
0.26 |
cobbles |
|
| 574755.8 |
222591.3 |
830.33 |
830.55 |
-0.22 |
cobbles- 10 cm |
|
| 574761.3 |
222603.8 |
832.30 |
832.39 |
-0.09 |
boulder - 10 cm |
|
| 574759.2 |
222603.8 |
832.16 |
832.26 |
-0.10 |
boulder - 10 cm |
|
| 574771.3 |
222605.1 |
833.24 |
833.50 |
-0.26 |
boulder - 25 cm |
|
| 574769.6 |
222603.1 |
833.72 |
833.54 |
0.18 |
boulder - 25 cm |
|
| 574766.5 |
222602.4 |
832.47 |
833.45 |
-0.98 |
boulder - 25 cm |
|
| 574757.0 |
222597.7 |
831.01 |
831.43 |
-0.42 |
boulder - 30 cm |
|
| 574753.2 |
222588.3 |
829.09 |
829.63 |
-0.54 |
flat boulder - 30 cm |
|
| 574741.3 |
222588.4 |
827.22 |
827.02 |
0.20 |
flat boulder - 30 cm |
|
| 574770.3 |
222612.6 |
832.04 |
832.61 |
-0.57 |
boulder - 80 cm |
|
| 574764.7 |
222601.4 |
833.05 |
833.20 |
-0.15 |
boulder - 100 cm |
|
| Elevation offset |
-0.24 ± 0.34 |
|||||
| Elevation error |
0.32 ± 0.24 |
|||||
| RAMS River Mile 62.7 |
||||||
| Northing (meters) |
Easting (meters) |
LIDAR (meters ASL) |
Survey (meters ASL) |
LIDAR minus Survey (meters) |
Cover Type |
|
| 574753.2 |
222609.4 |
831.27 |
831.19 |
0.08 |
bare sand |
|
| 574747.0 |
222608.3 |
830.46 |
830.30 |
0.16 |
bare sand |
|
| 574739.2 |
222608.2 |
827.24 |
826.92 |
0.32 |
bare sand |
|
| 574750.0 |
222607.8 |
831.10 |
830.85 |
0.25 |
boulder - 10 cm |
|
| 574748.5 |
222609.0 |
830.63 |
830.56 |
0.07 |
boulder - 25 cm |
|
| 574755.6 |
222609.6 |
831.64 |
831.75 |
-0.11 |
boulder - 40 cm |
|
| 574742.8 |
222607.6 |
828.82 |
828.90 |
-0.08 |
boulder - 40 cm |
|
| 574751.2 |
222609.0 |
831.38 |
831.30 |
0.08 |
boulder - 45 cm |
|
| 574745.4 |
222609.5 |
830.42 |
830.36 |
0.06 |
boulder - 45 cm |
|
| 574735.6 |
222609.2 |
826.67 |
826.22 |
0.45 |
boulder - 55 cm |
|
| Elevation offset |
0.13 ± 0.17 |
|||||
| Elevation error |
0.17 ± 0.13 |
|||||
Table 2. Comparison of elevations obtained from the RAMS and ALMS LIDAR versus sandbar mapping surveyed elevations at various reaches of the Colorado River ecosystem between Glen Canyon Dam and just south of the Little Colorado River confluence. Geographic locations are referenced to the State Plane coordinate system, Central Arizona, FIPSZone 202.
RAMS LIDAR |
ALMS LIDAR |
|||||||||||||
| River Mile of Site |
Num. of Survey Points |
Elevation Offiset |
Elevation Error without Adjustment |
Elevation Error With Adjustment |
Num. of Survey Points |
Elevation Offiset |
Elevation Error without Adjustment |
Elevation Error With Adjustment |
||||||
| 2.8 |
139 |
+0.21 m |
0.22 m |
0.07 m |
137 |
+0.36 m |
0.37 m |
0.21 m |
||||||
| 30 |
391 |
+0.09 m |
0.11 m |
0.06 m |
313 |
-0.06 m |
0.84 m |
0.85 m |
||||||
| 43 |
1098 |
+0.20 m |
0.22 m |
0.15 m |
752 |
+0.06 m |
0.33 m |
0.33 m |
||||||
| 59 |
33 |
+0.28 m |
0.28 m |
0.17 m |
18 |
+0.25 m |
0.63 m |
0.60 m |
||||||
| 62.7 |
457 |
+0.18 m |
0.19 m |
0.13 m |
134 |
+0.75 m |
0.77 m |
0.44 m |
||||||
Table 3. Comparison of pre-spike-flow and post-spike-flow RAMS LIDAR elevations for bare-ground and vegetated surfaces within study area RM 59.
| Study Site Within RM 59 Study Area |
Average Elevation Offset Between Pre- and Post-spike-flow RAMS LIDAR Elevations (meters) |
Average Elevation Error Between Pre- and Post-spike-flow RAMS LIDAR Elevations (meters) |
Bare-Ground Surfaces |
||
| Site A - 13,318 points |
+0.10 ± 0.13 |
0.16 ± 0.12 |
| Site B - 3,307 points |
+0.19 ± 0.26 |
0.32 ± 0.23 |
| Site C - 2,828 points |
+0.14 ± 0.32 |
0.52 ± 0.45 |
| Site D - 1,876 points |
+0.09 ± 0.18 |
0.34 ± 0.26 |
| Site E - 3,664 points |
+0.16 ± 0.30 |
0.19 ± 0.15 |
| All Sites - 24,993 points |
+0.13 ± 0.37 |
0.23 ± 0.32 |
| Vegetated Surfaces |
||
| Site A - 1,753 points |
+0.06 ± 0.59 |
0.60 ± 0.44 |
| Site B - 1,091 points |
+0.12 ± 0.56 |
0.58 ± 0.45 |
| Site C - 895 points |
+0.20 ± 0.67 |
0.69 ± 0.50 |
| Site D - 137 points |
+0.08 ± 0.55 |
0.56 ± 0.39 |
| Site E - 257 points |
+0.22 ± 0.86 |
0.87 ± 0.60 |
| All Sites - 4,133 points |
+0.12 ± 0.88 |
0.63 ± 0.63 |
References Cited
Beus, S. S., C. C. Avery, L. E. Stevens, M. A. Kaplinski, and B. L. Cluer, 1992, The influence of variable discharge regimes on Colorado River sand bars below Glen Canyon Dam, in The Influence of Variable Discharge Regimes on Colorado River Sand Bars below Glen Canyon Dam, edited by S.S. Beus and C.C. Avery, Final Report to Glen Canyon Environmental Studies, Northern Arizona Univ., Flagstaff, Arizona.
Kaplinski, M., J. E. Hazel Jr., and S. S. Beus, 1995, Monitoring the effects of Interim Flows from Glen Canyon Dam on sand bars in the Colorado River Corridor, Grand Canyon National Park, Arizona, Final Report to Glen Canyon Environmental Studies, N. Ariz. Univ., Flagstaff, AZ, p. 62.
Schmidt, J. C., Grams, P. E., and Leschin, M. F., 1999, Variation in the magnitude and style of deposition and erosion on three long (8-12 km) reaches as determined by photographic analysis, in The Controlled Flood in Grand Canyon (Webb, R. H., Schmidt, J. C., Marzolf, G. R., and Valdez, R. A., eds.), Geophysical Monograph Series, v. 110, p.185-204.
Shrestha, R. L., Carter, W. E., Lee, M., Finer, P., and Sartori, M., 1999, Airborne laser swath mapping: Accuracy assessment for surveying and mapping applications, Journal of American Congress on Surveying and Mapping 59, p. 83-94.