Francis Henderson
The lower east coast area of the Everglades ecosystem is a highly urbanized area that is dependent on a complex system of canals, culverts, and structures for water management. With restoration of the Everglades, urban water managers will be challenged to conserve more and make the most of what water falls directly on this area. A GIS has been developed that provides for improvement in the coordination of water management among the 23 districts and 30 cities within Broward County. The GIS data and ArcView and ArcIMS applications that support and enhance an integrated water management plan are discussed.
The urban,lower-east coastal area of the Everglades Basin is within the eastern portions of Palm Beach, Broward, and Miami-Dade Counties, Florida, Figure 1.

Figure 1. Map of South Florida showing location of Broward County, Florida.
Two-thirds of Broward County is in Conservation as Water Conservations
areas WCD2 & WCD3. The urban area is approximately 437 square miles. This
urban area is dependent upon a complex system of canals, culverts and
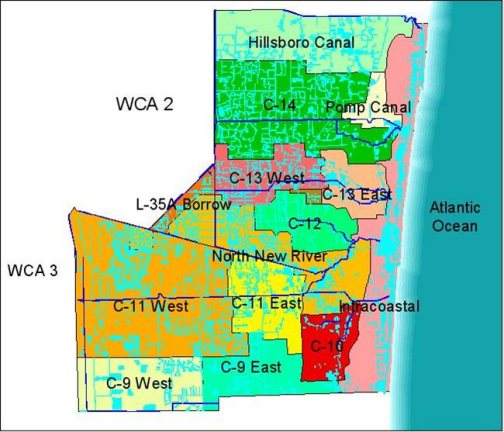
structures for water management. There are nine surface water management basins
of eastern Broward County first delineated in the 1950s by the Army Corp of
Engineers, Figure 2(Cooper and Lane, 1987.)
Figure 2. Urban Broward County showing the nine drainage basins.
While the South Florida Water Management District (SFWMD) has primary authority over water management in these basins, there are more than 23 water control districts and several municipalities that actively manage surface water in these nine basins. In Figure 3, the jurisdiction of the 23 water control districts is overlayed as a red outline over the cities' boundaries.

Figure 3. Urban Broward County showing the overlap of water control districts (in red) on the cities.
Each district and city is unique in terms of its jurisdictional area, enabling legislation, infrastructure, operations and interaction with each other and with SFWMD.
Historically the primary functions of these organizations have been flood control and drainage. Also, their operations were more or less independent of one another. Today more of these agencies work together and include aquifer recharge for public water supply wellfields; and enhancement and mitigation of wetland as management objectives.
The Water Preserve Areas (WPA) and the Broward County Secondary Canal Recharge components of the Comprehensive Everglades Restoration Plan (CERP) will actively involve and affect these operations. Over the next 35 to 50 years of implementation of the CERP, urban water management will be challenged to conserve more and make the most of what water falls directly upon this portion of the system. This will require greater cooperation and coordinated management among the various managing agencies.
An integrated geographical information system (GIS) can provide for improvement in overall efficiency and effectiveness in each of the districts and cities and for better cooperation in operations of all surface water management organizations towards a set of unified goals that augment the restoration of the Everglades. The purpose of this paper is to describe the underlying GIS data, the Broward County Office of Environmental Services Water Management Division's (OES/WMD) projects that have been developed and future projects that are to be developed and how they will relate to the Everglades Restoration. A main feature of this project is the integration of water level and rainfall monitoring data to support operational decision-making and long term planning.
The hydrography and related data that were collected for the program consists of drainage basins, sub-basins, canal networks, control structures and culverts. Hydrographic surveys of primary canals and representative lakes were conducted to collect critical cross-sectional data and lake depths, ground and surface water level monitoring networks were designed and installed, a rainfall monitoring network was also designed and installed, and aquifer recharge projects throughout the County have been identified and characterized. The surface water management areas of the County are captured in a polygon coverage of basins and sub-basin. Control structures have been captured as point features in a point coverage that along with the polygon coverage of the surface water management areas detail surface water management within the County. These coverages provide for operational and structural characteristics of the structures and sub-basins. These coverages are being maintained by OES/WMD and another County Agency, the Water Resources Division of the Department of Planning and Environmental Protection (DPEP/WRD) with input and further refinement and enhancement being done as individual portions of the county are modeled by various organizations and by annual updates by the Staff.
The program also includes existing GIS data consisting of the public water supply and irrigation wells, wetlands & mitigation areas, and political boundaries. SFWMD and Florida Department of Transportation (FDOT) GIS data for control structures and culverts were also included. Existing Broward County digital orthophotography and a digital elevation model (DEM) base upon Lidar surveys and digitized USGS topography maps are also used in the program.
An existing drainage district coverage was updated and significantly enhanced and expanded to include sub-basins to define surface water management areas in Broward County. Also, cities that maintain drainage infrastructure and operate surface water management systems were added. The sub-basins that were delineated in this coverage correspond to both controlled and uncontrolled sub-basins. This coverage was verified, edited and updated to 1999 data and information and as much attribute information verified as possible. This coverage augments both the surface water feature and the control structure coverage, Figure 4.

Figure 4. Map showing The Basins & Sub-basins within the Water Management Districts & Cities in Broward County.
An existing 1995-based canal coverage was update to 1998 using the digital orthophotos of the County. A scale ranging from 1:600 to 1:1200 was used to identify surface water features. An arc-centerline for both canals and lakes was updated. Major discrepancies between the 1995 arcs and the 1998 images were edited. Minor discrepancies such as arcs not centered on the canal were not edited. A polygon-coverage of surface water features was also created. This coverage includes water features ten feet or wider represented as polygons, Figure 5.

Figure 5. Surface Water Features in Urban Broward County.
Surface water features (canal) coverage, which include canals, lakes, rivers and waterways; culverts and other connectors. This coverage is actually represented by two coverages, a centerline (arc) coverage, and an area (polygon) coverage. The arc coverage includes culverts and other connectors. These coverages were recently completed by the DPEP/WRD in cooperation with SFWMD and OES/WMD Staff. These coverages are used for many applications and the maintenance is shared by DPEP/WRD and OES/WMD Staff. The maintenance is not totally assignable to this project as it serves as base coverage for most of our work. OES/WMD staff will be working on conversion and enhancement of the attribute data associated with these surface water features to conform to the National Hydrography Data in cooperation with other State and local "water-interested" organizations and agencies.
All known water control structures in Broward County were inventoried location determined using GPS (See below.) The coordinates were then used for horizontal positioning in the creation of a coverage and map of the structures. In addition, a digital photograph of each was taken. The physical and operational attributes were entered into a dBase table and joined to the structures locational file. Any other structures with no GPS coordinates were verified using master plans provided by the individual districts utilizing varying scales. One or more control structure will be associated with a basin or sub-basin. The SFWMD's control structures were added to this coverage. Control structures help to define basins and sub-basins, Figure 6.
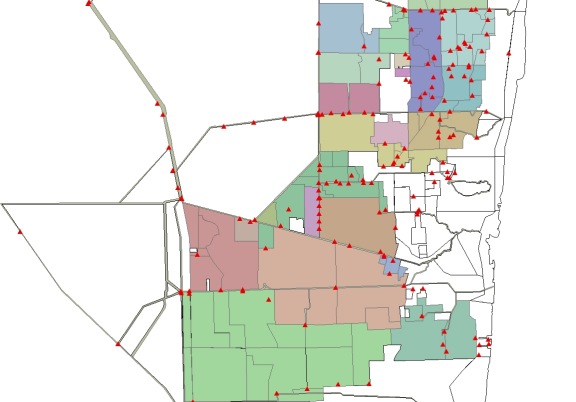
Figure 6. Control Structures Associated with Basins and Sub-basins in Broward County.
The locations of culverts were digitized on the screen in an ArcView project. Initially, the 1998 digital orthophotos of the County were used to locate culverts as a point feature between two bodies of water. A scale of 1:600 was used to identify surface water features and culverts indicated on hard copy source documents. This coverage was later replaced by a arc-coverage of culverts that complimented the updated canal coverage. Figure 7 shows the location of the culverts in the County as red arcs.

Figure 7. Culverts in Urban Broward County.
Data and information were collected from the various drainage districts, cities, and county, SFWMD, engineering consulting firms, and Florida Atlantic University, Department of Geography and Geology. Either key staff of these organizations was interviewed or master plans and/or other pertinent documents were obtained from them. All sources of data and information are documented in metadata files. These data and information were transcribed to coding sheets for data input. All source documents and notes have been indexed and cataloged for future reference. This data collection effort will be conducted annual in order to maintain the currency of data.
All known water control structures in Broward County were surveyed for northing and easting coordinates using a Trimble Pathfinder ProXL 8-channel receiver with a Corvallis Micro Technology MC-V data logger. Five satellites were used and a minimum of seventy different readings or points was recorded per control station. A Trimble ProBeacon DGPS receiver was used for real time differential correction of the points. Trimble's Pathfinder Office version 2.10 software was then used to process the data and calculate an average coordinate value for each control structure. Using this collection and processing technique, spatial accuracies of up to one to three meters were attained. Digital photos were taken of each control structure with the exception of the SFWMD's structures located in the Water Conservations Areas. These photos have been "hot-linked" to their locations in an ArcView Project that shows the structure on a digital orthophotos. This provides additional information, beyond the attribute tables, about each structure. These photos may be useful for storm damage assessments and documentation. An example is shown in Figure 8.

Figure 8. Example of a digital photograph of a control structure.
Location of culverts were verified in the field and additional data collected in first annual update. Hydrography surveys of selected major canals and lakes were conducted by Florida Atlantic University Department of Geography and Geology under a contract with Broward County (Hindle & Resptro, 1999.) "The object of the project was to obtain a more accurate groundwater flow MODFLOW model for Broward County, Florida by incorporating field collected hydrography. Specifically, the purpose of this study is to obtain bottom profile data for at least 20 significant lakes and 40 detailed cross sections for significant canals to include in the Broward County Regional Flow MODFLOW model (MODEL.)", (pg 1. Hindle & Resptro, 1999) The Broward County Property Appraiser provides the County with annual updated digital orthophotography with a horizontal accuracy of approximately +/- fifteen feet.
Existing surface and ground water level monitoring networks were enhanced and a rainfall-monitoring network designed and installed to better support operations and modeling of this system. Specifically, surface water levels are now monitored at a higher frequency with continuous recorders to support operations of a northern county secondary canal aquifer recharge project. Additional ground water level monitoring was added in specific areas of the County to fill in voids in the network. These network provides both a more spatially and temporally accurate database for future surface water modeling and to support day-to-day operations of the local and regional water management systems. In this program we made enhancements to surface and ground water level monitoring networks, designed a network of continuous recording rain gages, and start implementation of data collection programs.
Existing wells were added to the existing groundwater level continuous recorder-monitoring network are shown in Figure 9. This network is primarily operated and maintained by the USGS in cooperation with various government entities in Broward County. OES/WMD is a cooperating agency with the USGS and supports data collection at 17 of the 49 identified wells. In addition OES/WMD maintains a network of eight water level recording wells for the County's North Regional Well field and 3 additional recorders. The new recorders are operated and maintained by Staff.
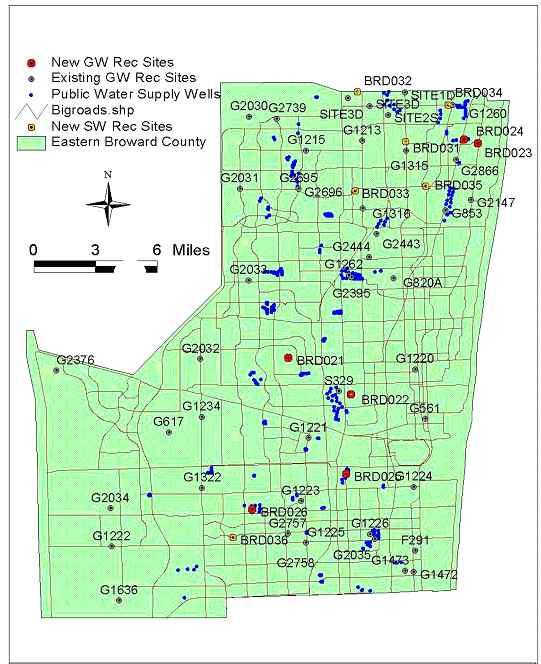
Figure 9. Groundwater Level Monitoring Network in Broward County.
The rationale for selection of these wells was to fill in holes in the spatial coverage of the network and better monitor water levels east of coastal well fields. These wells address a host of problems including better monitoring of saltwater intrusion in vicinity of County wellfields, aquifer recharge projects, and changes in water management practices relating to implementation of CERP components.
In Figure 9, the locations of surface water level monitoring sites are shown in relation to the sub-basins. The rationale for monitoring surface water levels is to support water management decision making concerning aquifer recharge and flood protection in the northeastern portion of the County. The current location of three temporary recorders is also shown in Figure 9. These recorders are being used to better understand surface and ground water level relationships in specific areas of the water control districts. These recorders augment the network of five recorders.
The In-Situ Troll 4000 data logger was selected because our division already has had several deployed in the field for more than two years, and some are also being used by SFWMD. The Troll 4000s were installed in existing wells and new shelters were constructed for surface water recording stations.
County staff visited each site and selected and characterized the exact location for the rain gages and recorders. The network is composed of eleven recording gages, shown in Figure 10 as red symbols. The SFWMD has a rain gage at each of its water control structures and shown in this figure as blue symbols. The polygons are Thiessen polygons that show the area represented by each rain gage.

Figure 10. Rainfall Monitoring Network in Broward County.
The rain gage consists of a Sutron rain gage (tipping bucket in an 8" diameter pan) and a CR 510 data logger. Data from the data logger are downloaded to a notebook computer. The network of rain gage was installed according to established SFWMD's protocols and specifications. In Figures 11 the clear area is shown as a circle with the radius of this circle given. The nearest vertical obstruction (e.g., building or tree) was to be no more than twice the radius of the circle shown in these photos. Also, in this example figure an inset photo is shown. The criteria that was used for siting was that the site was secure, no irrigation, a 45 degree clear area above the rain gage, and the gages were set at 6 feet above grade.

Figure 11. Example of Rain gage siting criteria and documentation of site selection.
The programs and projects that use the GIS data developed in this project and future projects that are to be developed and how they will relate to the Everglades Restoration are discussed below. These include water management decision support system including water management operations, emergency operations center support, NPDES municipal stormwater outfall program, aquatic weed control management, and water management public information web-based systems.
Most of our water managementfunctions are supported by the GIS data developed in this project. Below is a description of these programs.
The project GIS data are used to provide water managers with up-to-date data throughout the County. In addition, basins and sub-basin specific data have been constructed for the entire County including areas not within a specific drainage district or municipal jurisdiction. These GIS data are also included in a ArcView application called "Manager GIS" that is used by Division water managers. Current efforts are focused on integrating surface and ground water level data and rainfall data with these other water management data in near real time. Our ultimate goal is to upgrade our continuous recording water level and rainfall monitoring networks with telemetry so that water managers will have real time data for operational decision making, especially during extreme events.
This program focuses on the infrastructure of the water management districts and County-owned municipal storm water sewers that the OES/WMD is responsible. The infrastructure consists of open-channel canals, lakes, control structures, culverts, pumps, storm sewers, best management practices, drainage basins, outfalls, canal right-of-ways, fences, and boat ramps. This program is used by our water managers to facilitate management of the infrastructure. This program is primarily in maintenance mode. A major revision is underway to address the consolidation of several dependent drainage districts into the Northeastern Broward Water Management District. Modifications to the databases were also made this past year to provide support for the Government Accounting Standards Board Statement 34 (GASB34) requirements for an inventory of government owned infrastructure. Complying with the GASB34 requirements was substantially easier because the Division had most of the data already in GIS. Additional attributes are being considered to allow tracking of the "condition" and status of the infrastructure. This will be developed in the current fiscal year. This will allow water managers to better track the condition and status of drainage system.
An EOC Water Management GIS application has been developed and implemented by OES/WMD staff at the EOC. This application is a powerful, customized ArcView application that allows for detailed analysis of drainage problems throughout the County and not limited to just OES/WMD jurisdictions. Specifically, the project allows expert water managers to provide insight and background information and data on both simple and complex drainage related questions throughout the County during activations of the EOC.
All municipal-owned outfalls and drainage systems have been inventoried and GIS coverages constructed. This inventory and characterization is required by an EPA permit. Information on the major land use drained, pipe size, major/minor designation, and structure type is included in the coverage. FDOT's outfalls are also included. This inventory is maintained as part of the permit conditions. Currently, tracking of all SFWMD, DPEP permits and those issued by the Engineering Division for work associated with County roads is done. This application is currently in development with drainage system details still to be added. This next year an existing conditions module will be added so that the conditions of the infrastructure can be tracked and used for prioritizing replacements and repairs.
The purpose of this program is to track aquatic weeds and changes of species within jurisdictional canals and lakes along with incidents of treatments with herbicides or bio control agents. This program provides estimates of costs for maintenance of the canal systems within a given area and analysis of the maintenance cost. The amounts of herbicide sprayed per location, plant species, labor-hours and hourly rate, herbicide cost are retrieved from the agency's billing database once-a-month for analysis. The program provides for temporal and spatial analysis of the occurrence and distribution of aquatic weeds, use of herbicides, and other aquatic weed control related information to provide detailed analyses in support of management of aquatic weed control.
Web-based Systems The project GIS data have been used on our web page to support various applications. The URL for web page is http://www.broward.org/oes/wmi00500.htm. These data are made available via the web for other water management districts, district residents, consultants, cooperative government agencies, and for OES/WMD Staff. Data and information, query modes and displays of spatial and temporal data are possible.
Our goal is to provide spatial analysis capabilities to include address matching, specified distance from, buffers, district boundaries, project area boundaries, municipal boundaries, and specific overlays. Temporal analysis will include specific time-periods and project time-lines periods. Also we provide data and information downloads of thematic maps and tabular data in selected formats.
With 23 drainage districts and 30 municipalities it is a little confusing to the public on who has jurisdictional and who to call about the canal or lake in their development. We have developed a complex overlay image map of drainage districts and city boundaries that allows the user to find out who to call (http://www.broward.org/oes/wmi04000/index.html.) We have added water and sewer services area to drainage jurdicistions in an ARCIMS application. In this application you enter your address and the application displays who to call and phone numbers for each. The url for this application is http://lsta.co.broward.fl.us/website/dws/viewer.htm?Title=
During droughts we also provide a special watch report, Broward County Watch On Water online. The purpose of this Watch is to provide timely information on water levels for use by the public, government officials and water managers during the current water shortage.
Data collected by Broward County OES Water Management Division has been combined with data and information from the US Geological Survey, Army Corps of Engineers, and South Florida Water Management District to provide water level information specific to Broward County. For this report the surface water and groundwater elevation and rainfall monitoring networks supply data that allows for spatial analysis of surface and ground water levels. These data are published on the Division's web page to show how droughts are progressing throughout the County. This project, as well as the jurisdictional determination application, is done using Imagemapper software by ALT4 that runs as an extension of Arcview to generate an image map of monitoring sites. Hydrographs for each station are accessed from hyperlinked symbols for the monitoring sites. The url for this application is http://www.broward.org/oes/wmi04210.htm. This program will be ported over to an ArcIMS application in the near future. Our long term goal is to be able to serve up real-time data via the ArcIMS application. This would be especially important during emergency operations for extreme events such as hurricanes and tropical storms. These GIS data have also been made available to the public and other organizations through an internet application (ArcIMS based) for water management in Broward County. ArcIMS applications have also been created for the rainfall monitoring data and for the drainage jurisdictional determination. We will be developing an ArcIMS application for the water level monitoring data this year. These ArcIMS applications are currently available on the web at http://lsta.co.broward.fl.us/website/.
Support The primary purpose of this project was to support the development and implementation of a countywide integrated water resources plan (IWRP). Broward County Department of Planning and Environmental Protection (DPEP) and the Office of Environmental Services Water Management Division (OES/ WMD) staff began development of the IWRP, June 1997. "The goal of the plan is to maximize and protect the beneficial uses of the water resources throughout Broward County." (IWRP, 1997.) The IWRP is a local plan directed towards the implementation of The Lower East Coast (LEC) Regional Water Supply Plan adopted by the SFWMD in June, 2000. The project GIS data was used in the MODFLOW water supply model used in the LEC Plan. These data were also used in the models being used in Comprehensive Everglades Restoration Plan components in proximity to Broward County. These CERP components are the Water Preserve Areas and Broward County Secondary Canal System Components. The project GIS data are being used in IWRP projects such as the North Aquifer Recharge Assessment Study and the Central Aquifer Recharge Assessment Study. The results of these studies will be used in the CERP and Broward County Secondary Canal System project. OES/WMD staff also uses the project GIS data to assist in evaluation of the LEC and CERP modeling results.
The hydrographical GIS data developed in this project have been a very important to our agency and others. It has provided for an understanding of how water is managed in the many individual water management districts and municipalities in Broward County. The programs and projects that have been developed and implemented based upon these data provide a wide range of support to water management in Broward County and to long term water resources planning of the LEC and CERP.
BCDPEP, 1997. Broward County Integrated Water Resource Plan. Water Resources Divison, Broward County Department of Planning and Environmental Protection, Fort Lauderdale, Fl.
Cooper, Jim and Jim Lane, 1987. An Atlas of Eastern Broward County Surface Water Management Basins. Technical Memorandum. Water Resources Division, Resources Planning Department, South Florida Water Management District, West Palm Beach Fl.
Hindle, Tobin and Jorge Restrepo ( June 1, 1999) BROWARD COUNTY HYDROGRAPHIC SURVEY REPORT. Department of Geography and Geology, Florida Atlantic University, Boca Raton, Fl.
SFWMD. 2000. Lower East Coast Water Supply Plan. Water Supply Department, Water Resources Management, South Florida Water Management Distric, West Palm Beach, Fl.
USACE and SFWMD. 1999. Central and Southern Florida Flood Control Project Comprehensive Review Study Final Integrated Feasibility Report and Programmatic Environmental Impact Statement. U.S. Army Corps of Engineers, Jacksonville District, Jacksonville, FL, and South Florida Water Management District, West Palm Beach, FL.
The author would like to acknowledge the following Broward County Staff for their valuable contributions to this project: Noah Bell, Don Charlton, Barbara Chow, Darrell Dunn, Nancy Gassman, Lorraine Guise, John Horne, Brian Kelly, Dave Lee, Katie Lelis, Eric Myers, Don Perron, and Roy Reynolds. Tobin Hindle and Jorge Restropo of the Florida Atlantic University, Department of Geography and Geology provide valuable collaboration on data collection and interpretation. In addition Jose Valdez, Jeff Giddings, and Kurt Sarri of the South Florida Water Management District provide technical support and project guidance.
Francis Henderson
Water Resources Manager
Broward County OES Water
Management Division
2555 West Copans Road
Pompano Beach, Florida
33069
954-831-0760
fhenderson@broward.org