Title:
A River Runs Through the WebAuthor: Anthony Gareau
Organization: National Park Service
ABSTRACT
The Cuyahoga Valley National Park is the focal point of an ambitious three-year project called "A River Runs Through It." The objective of this project is to develop a pilot Web-based application that incorporates GIS technology into the new curriculum that is being developed for the Cuyahoga Valley Environmental Education Center (CVEEC). At Cuyahoga Valley, the common thread that runs through the CVEEC curriculum is the Cuyahoga River Watershed. The watershed will be the focus of the GIS web application.
BACKGROUND AND HISTORY
Cuyahoga Valley National Park's stewardship encompasses 33,000 acres within the Cuyahoga River Watershed between Cleveland and Akron, Ohio. The park is surrounded by a fragmented, rapidly developing landscape of secondary growth forest, agriculture, and urban developments. The Cuyahoga Valley Environmental Education Center is a residential learning facility located in the heart of the Cuyahoga Valley. The Cuyahoga Valley National Park Association a non-profit organization that works in partnership with the National Park Service (NPS) to serve area schools, individuals and organizations, administers the CVEEC.
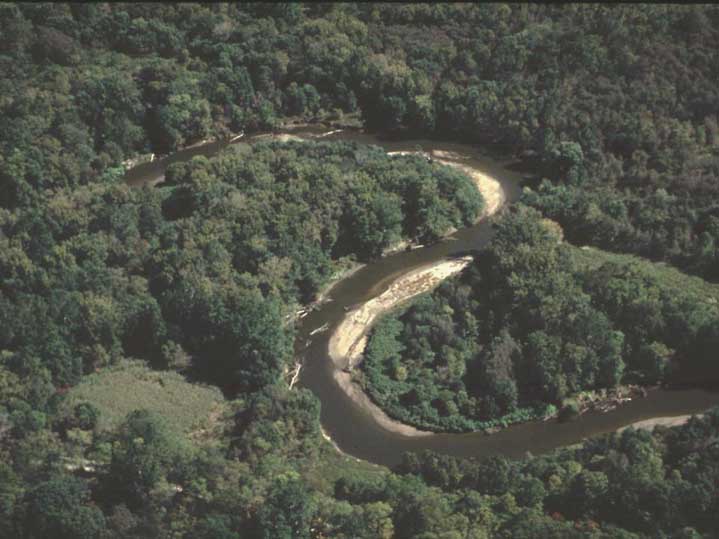
Figure 1. Cuyahoga River, named by Indians whose word
for it was "ka-io-ogh-ha", meaning crooked.
Cuyahoga Valley has a strong history of implementing geographic information system technology (GIS) in park operations and beyond the park's borders. In recent years, GIS has become more "user friendly" as people using it concentrate on it as a tool, rather than as a technology. This has resulted in GIS integration within many disciplines that use it to analyze and visualize geographic information. For users, GIS has become an integral part of the decision making and public service process. As a next logical step in the development of the park's GIS program, we are building Internet and Intranet-based applications that can provide access to the park's GIS data.
A RIVER RUNS THROUGH IT
Cuyahoga Valley National Park and its surrounding watershed are currently the focal point of a three-year project intended to redesign the curricula of the CVEEC using web-based and interactive electronic learning resources. The "River Runs Through It" project will develop ways for people of all ages to experience and learn about the beauty and natural treasures of the Cuyahoga Valley National Park. It will also support the creation of a cadre of master teachers dedicated to supporting the teaching of environmental sciences across the curriculum using technology-based learning resources. The new curriculum is being developed by the Center for Educational Technologies (CET) and NASA's Classroom of the Future at Wheeling Jesuit University in cooperation with CVEEC and Cuyahoga Valley. The backbone of CET product development efforts are to create curriculum that combines technology tools, innovative teaching methods, and solutions to real-world problems.
Central to the CVEEC curriculum is the concept of a Problem-Based Learning (PBL) unit. The PBL technique is based on real-world challenges that drive students to conduct in-depth investigations. The Challenges contain complex issues, conflicts, puzzles, decisions, or circumstances that offer just enough information to provoke an investigation. The PBL concept can help students and teachers engage in studies that require and promote critical thinking. Maps are essential to successfully implementing a PBL curriculum unit.
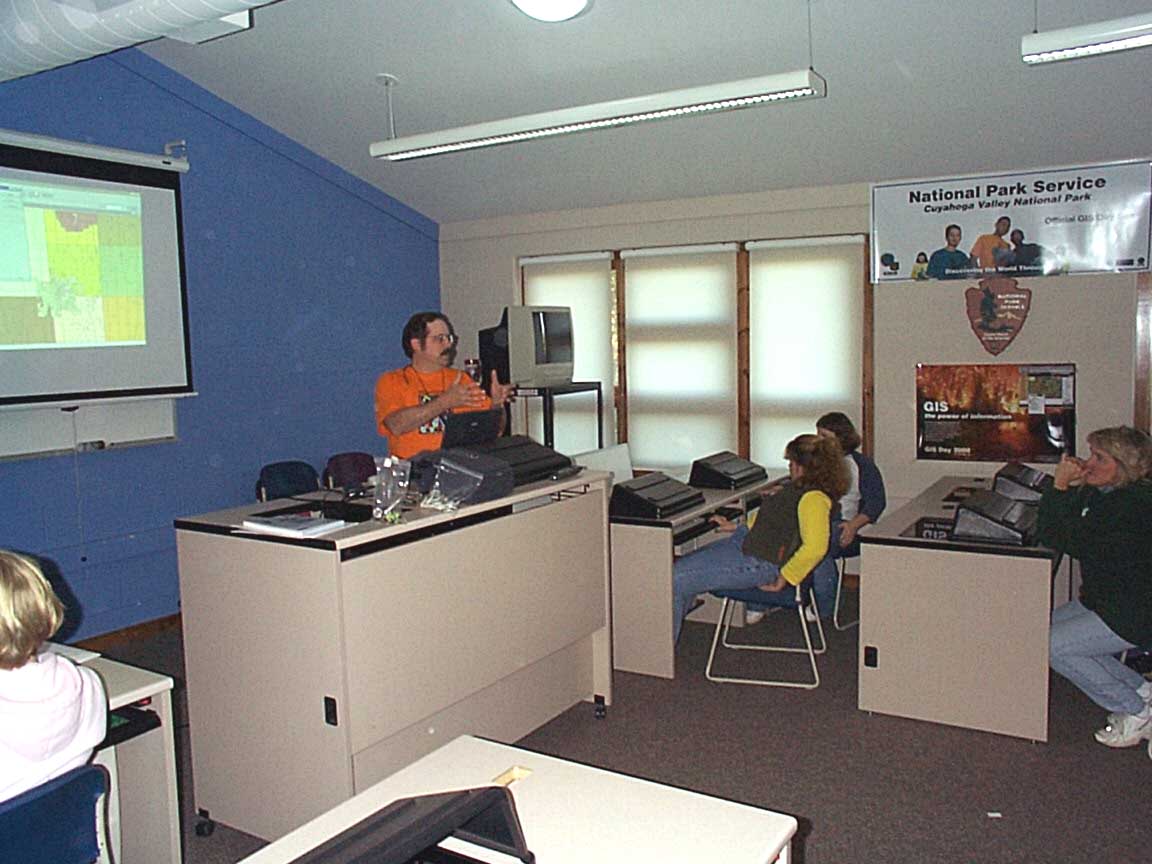
Figure 2. Utilizing GIS in the classroom.
GIS technology is the perfect tool to enhance the PBL approach and has been an essential component of the River Runs Through It project from the beginning. The consensus of those involved in the development of the new curriculum was that Esri's ArcIMS software would be the best choice for our web-based mapping solution. ArcIMS is Esri's newest technology for Internet mapping and distributed GIS capabilities. We are currently in the process of publishing the park's local and regional GIS data that correspond to the new curriculum utilizing ArcIMS applications.
The implementation of ArcIMS web-based GIS should be a smooth transition. CVEEC's staff has been using Esri's Arcview software over the past 3 years in conjunction with its partnerships with the NPS and the Global Learning and Observations to Benefit the Environment (GLOBE) Program. Previously, the park's GIS data have been incorporated into several Arcview applications at the CVEEC. These and other GIS applications will serve as a blueprint for future ArcIMS web-based mapping applications.
CUYAHOGA RIVER WATERSHED - A TOOL FOR ENVIRONMENTAL EDUCATION
Most everyone has heard of the Cuyahoga River. It burst into national prominence in April, 1970, when Cleveland Major Carl Stokes testified before a Congressional hearing on the Clean Water Act that "the Cuyahoga was on fire just a year ago." Cleveland's "burning river" immediately caught the attention of the nation. Comics joked about it and environmentalist grieved. The image was readily adapted as a rallying symbol for the Clean Water Act, and afterwards, the environmental movement. When the Clean Water Act passed, friends and foes alike would look to the Cuyahoga River for evidence of improvement - it would become America's barometer of change
The story of the Cuyahoga River is similar to many American rivers. It has played a central role in the succession of community development and served numerous community needs. The modern day story of the Cuyahoga is a story of community reinvestment towards a goal of reinstating the importance of the Cuyahoga River as a source for recreation, education, entertainment, and industry.
Many educators use rivers as their main topic when discussing watersheds. Rivers link our communities with the lands that surround them, with our history and culture, and with our neighbors living downstream. Rivers are among the most disturbed ecosystems on earth. Since we all live in a watershed, we all are part of the problem and the solution. What we do to our rivers determines the ultimate health of our water supply. Worldwide, most humans still depend on rivers for drinking water, commerce, and waste disposal. This alone should give us an incentive to encourage scrutiny of river dynamics and water quality.
At Cuyahoga Valley, the essential thread that runs through the CVEEC curriculum is the Cuyahoga River Watershed. The watershed is the focus of our GIS/ArcIMS site. When fully operational the site will enable students, teachers and the public to visualize a living watershed. Our goal is to give teachers and students the ability to analyze geographically, the relationship of the Cuyahoga River and its tributaries to their own neighborhoods. Users will be able to study river dynamics from their classrooms and the web by monitoring water quality indexes and comparing each other's data. Analyses will include evaluating the health of the river through chemical tests and macro-invertebrate inventories.
The CVEEC's water quality PBL curriculum unit is the central driving force behind our ArcIMS application development. This unit introduces students to the concept of water quality. Currently,
students measure water quality along the Cuyahoga River and its tributaries twice a week. Tests are done near the CVEEC. They use low-tech wet chemistry kits. The kits show chemical reactions in the water. Students measure phosphate, nitrate, dissolved oxygen, turbidity, pH, temperature, fecal coliform, and will eventually check stream water conductivity.Students will input their findings into an
on-line water quality database. Other students will also be collecting data at sites throughout the watershed.Students are challenged to consider these questions:
To answer these and other relevant questions, the students and teachers will need to see all the data collected on watershed water quality.
These data will be displayed in maps using ArcIMS. The students can be challenged to decide for themselves if the river is healthy, and if not, they can determine the sources of the "unhealthiness". Finally, students can start asking questions what could be done to improve the water quality in the watershed.
The Environmental Education (EE) staff is excited about empowering students with tools to visualize their watershed. This new curriculum approach will hopefully generate a cadre of in-service teachers with skills to assist their students in performing the same water quality tests in their local streams throughout the watershed.
ArcIMS APPLICATION DEVELOPMENT
Overview
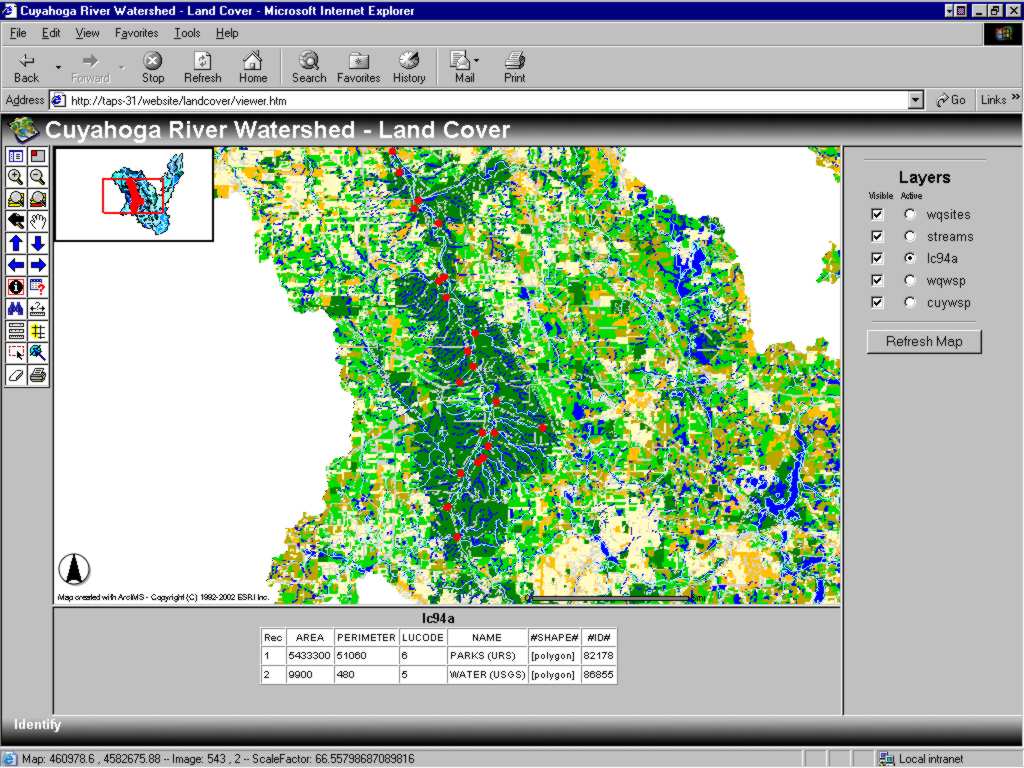
Esri's ArcIMS software is being utilized by CVEEC to publish GIS data over the Internet. The overall implementation process consists of five tasks: (1) system evaluation, (2) installation, (3) data preparation, (4) data integration and (5) data publishing. These tasks will pave the way for serving existing GIS data to end-users through their desktop web browser software. Once ArcIMS is installed and configured, the existing GIS data will be incorporated into a standard "out-of-the-box" ArcIMS application based upon the "HTML Viewer" template.
Students will have several applications to work on based on the following scenarios:
First Scenario
Students locate their local stream or water quality monitoring sites. Students will be prompted to choose their school from a list of schools. Choice of school will use an image of a mascot or other identifying symbol.
Second Scenario
Once data are collected the students can compare existing water quality conditions with other sites in the watershed. For example, "...Our stream shows high turbidity, while this other watershed has low turbidity. Why?"
Third Scenario
Students will compare land cover throughout the watershed and begin to identify point and non-point sources of pollution. Data requirements are: (1) Watershed boundaries with streams, (2) Political boundaries (city, county, township, etc., (3) NPDES - National Pollution Discharge Elimination System permit database, (point map based on addresses), (4) TIGER files (roads with updated addresses), and (5) 1994 & 1999 Land Cover data.
Fourth Scenario
Predictive modeling - What does the data tell us about river water quality? Produce a time series based on various water quality parameters collected. For example, high turbidity might be associated with recent storm events. Soil types upstream and adjacent to the monitoring site might cause high pH levels. For weather data, the application would link to the National Weather Service or the local television station's weather web sites. For soils, ArcIMS would display a general soil map that identifies alkaline versus acidic soil types.
Fifth Scenario
Map the hydrologic cycle within the Cuyahoga River watershed.
The students would build a series of models with inputs and output of anthropogenic impacts, natural impacts, runoff from increased development (i.e., parking lots and driveways), wetlands, built-up lands, farmed lands, residential and shopping centers. Other features that may contribute/alter the hydrologic cycle would include geology, soils, topography, slope and aspect (i.e., rolling slopes versus flat areas or hard rocky lands). The models would be in the form of ArcIMS map layers where each layer would depict stages of the hydrologic cycle.
Implementation
Until recently, the major limitation for implementing an Internet GIS application at the CVEEC has been a lack of suitable network communication bandwidth. Fortunately, T1 communication technology (1.5 megabytes per second) has been installed with appropriate Routers and Bridges to communicate locally on an Intranet and publicly on the Internet. Furthermore, the CVEEC has the necessary hardware and local GIS expertise through their partnership with the National Park Service. Once installed and operational, the ArcIMS web server will be maintained by the park's GIS Specialist and the CVEEC's Network Administrator.
The ArcIMS implementation consists of five tasks. The following is a summary as of the writing of this paper:
Task 1 - Evaluate System Environment
NPS staff met with CVEEC staff to determine the system logistics at the CVEEC. Information was collected on the existing network and server set-up. Based upon the information collected, a target web server was selected and with an appropriate ArcIMS configuration. The web server has a 1.8 GHZ CPU with one Gigabyte of RAM running on Windows 2000 Server software. The internal disk storage is 80 Gigabyte with a 160 Gigabyte RAID array for additional hard drive space.
Task two - Install ArcIMS software
ArcIMS and all related component software have been installed on the web server. The web server is configured with web server software (i.e., Microsoft's IIS), and will have a default web site configured that is addressable via URL. The software installed included:
The software was configured and tested to ensure that installation was successful.
Task three - Analyze & Prepare GIS Data
All GIS data that will be served through the ArcIMS-based web application was collected and analyzed to determine the data's structure and to identify fields to be used for labeling and table joins. All data are in Esri shapefile format. Any associated external database tables that need to be joined to the GIS data was also assembled and analyzed to determine the steps necessary for inclusion.
Task four - Incorporate GIS Data into ArcIMS
An ArcXML file (.AXL) was built to facilitate serving the data through ArcIMS. The ArcIMS Author tool was used initially to establish the basic data framework in the AXL file, and to assign appropriate thematic symbolization to the map features. Any map symbols that are too complex to be set up through ArcIMS Author will be performed through a text editor. An Image MapService will be created using the .AXL file in ArcIMS Administrator.
Task five - Publish ArcIMS Web Application
A web application will be published using ArcIMS Designer. The application will be implemented using the "HTML Viewer" template (HTML/DHTML frame-based site). All standard out-of-the-box functionality will be made available (zoom in/out, pan, measure, buffer, identify, query, print). Simple modifications to incorporate logos and preferred color scheme will be made.
Note: In order for an HTML Viewer implementation to function correctly, all end-user's web browsers must be configured to allow client-side scripting (JavaScript).
CONCLUSION
The National Park Service and Northeast Ohio will gain significant prestige, as the CVEEC will serve as a test bed and proof of concept for future environmental education initiatives undertaken by the National Park Service around the country. In addition, CVEEC staff is networking with other National Park Service education staff and there is potential for CVEEC to become a training center for web-based learning in National Parks around the country.
Our goals in this project are to extend to people of all ages opportunities to experience and learn about the beauty and natural treasures of the Cuyahoga Valley National Park. These efforts are intended to support educators in teaching the concepts of geographical and environmental sciences in innovative and creative ways, assisted with state-of-the-art technology tools, resources and applications. And, for young minds we hope our efforts will ignite a love for learning empowering students with interactive, hands-on educational applications designed to equip them with the core skills and thinking competencies to succeed in the 21st century.
Ultimately, the scope of this project will include web-based environmental learning opportunities for virtual visitors to Cuyahoga Valley as we develop interactive, Internet-based environmental learning opportunities for students and teachers via the new web-based services of the CVEEC and Cuyahoga Valley. In cooperation with other National Parks, one of the potential outcomes of this project is to geographically connect students and teachers with classrooms that using the web-based resources of the CVEEC. Students whose local park is Yellowstone National Park can communicate about their park with students in the Cuyahoga Valley. As other National Parks begin to develop distance-learning opportunities, students from northeast Ohio may virtually visit parks representing our nation's natural and cultural heritage.
ACKNOWLEDGEMENTS
The author wishes to thank his colleagues Ralph Wagnitz, NPS and Ryan Pulis of Brown and Caldwell for their assistance in preparing this paper.