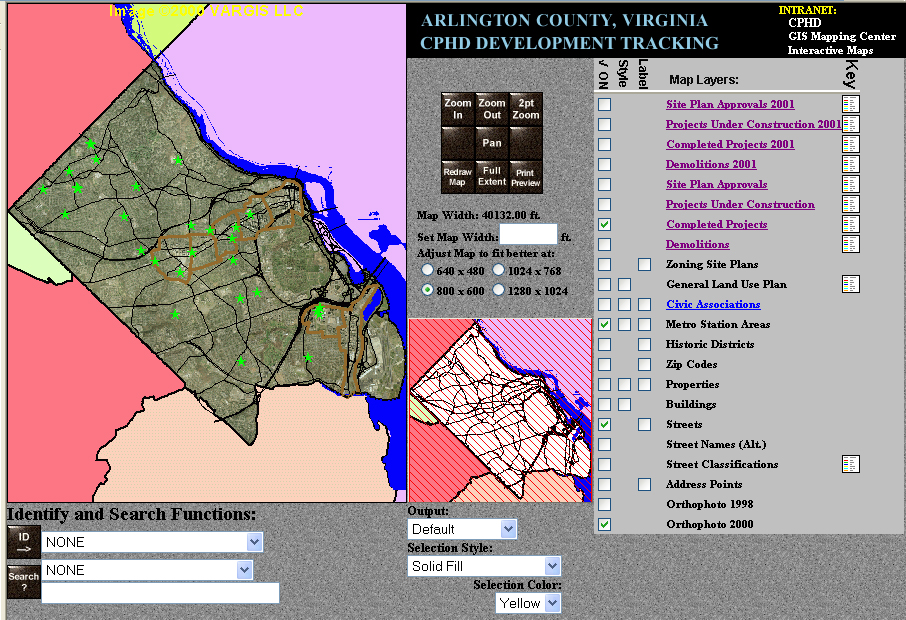
Arlington County Virginia has worked with ArcView, ArcGIS and ArcIMS to bring its periodic publication, Development in the Metro Corridors, to the Internet creating an interactive map of all buildings built within the county's intensively developed metro rail corridors. The goal of this project is to share geographic development data, traditionally stored in the planning offices, throughout the county and with the public as an additional component of Arlington's local "geography network." Interdepartmental work teams have been organized to maintain this important source of information for site plan review, economic development, citizen input and even three dimensional modeling projects.
County planning staff use Esri's ArcView 3.2 software on Windows XP workstations. An upgrade to ArcGIS 8x is anticipated in the coming months. Database management is performed using Microsoft Office programs; Access and Excel with data sets from the Real Estate CAMA database system and Permits Plus system (tracking building permits). GIS data layer maintenance for the County is provided by staff in the Department of Public Works (DPW) who operate a GIS Mapping Center that runs ArcGIS software packages on Windows NT workstations.
For this project, data was aggregated and geocoded by the Planning Research and Analysis Team (PRAT) in the Department of Community Planning, Housing and Development. Internet mapping was done by the DPW Mapping Center staff using Esri's Map Objects and Internet Map Server applications.
Arlington County is an urban area of nearly 26 square miles separated from the District of Columbia by the Potomac River. Arlington's mix of federal and private employment centers, established residential neighborhoods, and a successful heavy rail transit system called "Metro," have created a thriving community. In 2002 Arlington has an estimated population of 193,600 and over 200,000 jobs.
Arlington's successful integration of desirable residential communities and attractive office locations close to Washington D.C. is largely due to planning efforts commenced more than 40 years ago when plans for the Metro system were drafted. At that time, Arlington decided to create nodes of development along the new transit corridor and changed its land use plans to allow for intense development within a confined region around each new transit station. Together, these development-centers effectively form two "metro corridors" of intense development within the County.
Development and redevelopment of the areas around each of the seven metro stations that comprise the Rosslyn-Ballston and Jefferson Davis metro corridors continues today. The Arlington County General Land Use Plan provides for what has become known as a "bull's-eye" approach to development. Highest densities (up to around 10 FAR - Floor to Area Ratio) are planned for those areas directly adjacent to, or immediately surrounding the Metro station entrances. Densities have been designed to taper from high-rise residential and office towers to garden and town house style residential units with three and four story commercial spaces to single family neighborhoods within about one quarter mile from each metro station.
Although the County's land is largely "built-out," (i.e., all available land has been developed in some manner) there remains significant undeveloped density around several of the metro stations. As commercial and residential buildings age, redevelopment opportunities continue to emerge. Along with its other duties throughout the County, planning staff and elected officials spend a great deal of time reviewing and considering proposals for development in the Metro Station Areas.
In order to keep up with the new development, the planning staff in Arlington has taken on the task of following, or tracking, the progress of development. In this process, particular attention is paid to remaining density for redevelopment of land. Over the years, development statistics generated by tracking analysis has become more and more important to a broad group of interested parties including developers, transportation planners, land use planners, and civic groups. Development Tracking has also played a significant role in the forecasting of population, housing units, and employment for the County.
For roughly 20 years, the County staff has prepared paper reports that detail development trends and remaining capacity in a variety of charts and tables. A recent update of the complete list of development in the metro corridors from 1960 through 2000 (a report called, the Development in the Metro Corridors 2000, or DMC 2000) proved to be a monumental task. Despite advancements in Development Tracking, changes in database management systems, expanded information requests by staff (including figures for affordable housing, parking spaces, etc associated with new development), and staff turnover have yielded historically spotty record keeping from year to year.
The advent of GIS systems has created the foothold for a new paradigm for staff Development Tracking and DMC reporting efforts. Coupled with increasing mandates to publish available information to the County web pages, and more automated data retrieval systems for development information, the County is in a prime situation to utilize GIS systems to advance the distribution of its development data via the Internet and in GIS formats.
Separate development-related GIS analysis has been preformed by the DPW and Department of Economic Development (DED) for economic development purposes, but have lacked planning related attribute data including development densities, parking figures, zoning, building gross floor area (GFA), etc. Examples of this innovative 3-D modeling can be seen at: http://magellan.co.arlington.va.us/MapCenter/3dStuff/screenshots.htm.
Although, the 3-D images that the DPW Mapping Center produced for the County were well received by citizens, planning professionals, and various interest groups, there remained a niche for a system that could provide users with a more widely accessible data viewing and manipulation platform. A database of building information that could be viewed on the Internet would need therefore need to be attribute heavy (if it were to serve as a viable tool for planning analysis) but also aesthetically appealing, providing images that those outside the system could easily relate to.
Among the many advantages of using enhanced GIS for DMC reporting is the ability to tie development attributes to building footprints rather than graphic polygons as in previous printed versions of the report. Because up-to-date building footprints were difficult to come by, and the report was completed on a cycle of five to 10 years, graphic polygons were used in lieu of actual building footprints.
Easy access to GIS data is a primary goal of this project. While printed reports still play a role in meetings and as a component of analysis, expanded use of the Internet is a current County-wide goal. Planners and citizens have limited access to ArcView or other GIS software that has a much larger learning curve than most Internet based applications. In order to provide access to GIS for those who do not have the need for GIS software installed on their desktop CPU, the Arlington County planning office currently maintains a central ArcView workstation for general staff use. Use of this workstation has been limited due to the learning curve associated with occasional use of GIS applications. With the use of the new, Internet-based Development Tracking/Development in the Metro Corridors data system, planners will be able to include recent development data both in a tabular and graphic form in their staff reports for development projects being reviewed by the County Board, and other County agencies. Tools have been added to the application that link properties to Real Estate records, enabling a cross reference of parcel data between Development Tracking and Real Estate databases.
Although its use is difficult to gauge, there is a significant added benefit to having the system accessible to the general public via the Internet. At the very least, the mapping application will reduce printing costs associated with producing hard copy reports as a sole means of data sharing.
Although GIS systems have the obvious advantage of geographically referencing data sets, a single development data set incorporated with existing county GIS layers has been lacking. Data for the DMC 2000 report was recorded in a series of Excel spreadsheets, one for each Metro Station Area. Although practical for some data entry and sorting, these sheets quickly became cumbersome to work with. More importantly, they required a significant amount of processing for conversion to dBase format and incorporation into GIS models.
Separately, County staff developed a Microsoft Access database that contained information from the Permits Plus system and served Development Tracking purposes. Whereas the DMC data set contained a record of construction from 1960-2000, the Development Tracking database was driven by new building permits and serves as a current snapshot of development activity in the County. Development Tracking reports are produced each quarter of the calendar year with a year-end summary for each year. Demolitions, projects under construction, projects that receive a certificate of occupancy (i.e. completed projects), and especially large projects called site plans, are all included in the Development Tracking database. Information about square footage and type of construction (office, hotel, retail, residential, or other) is also included. It is the combined set of data that will produce the complete, updated data set for new DMC reports and serve as the online development database on the mapping application.
Data for both the DMC 2000 report and the Development Tracking database were collected from several different sources. Zoning records, site plans, County Board meeting minutes, staff reports, the Permits Plus system, and field visits all contribute to development databases.
In uncovering these different sources, Development Tracking proved to be a non-linear process. Changes to land records may be made in the Real Estate files first, then sent to our GIS system for updates, even before a building permit is filed. In this case, a new parcel number would be created but it would lack an address. As parcels are created, this poses a problem for Development Tracking because the GIS data layers do not have addresses for many new projects and planners are forced to use other means to spatially locate new construction projects.
More often, building permits are filed for new construction and the permits data base generates a new address that is then forwarded to Real Estate where an update is made before sending a map and data changes to the GIS Mapping Center for updates to the GIS layer. The Mapping Center then completes the data exchange by using data capture to providing zoning and land use information to the system and return an appended data file back to the Real Estate and Permits data files.
Briefly, the process for the creation of data files for this GIS mapping application is as follows:
Critical to the success of this project has been the DPW GIS Mapping Center's establishment of a data download page on their Intranet site. Although previous use of a shared data server facilitated easy access to DPW GIS data by County employees, the new intranet site has enabled Mapping Center staff to post data more frequently and add dates for each posting beside data layers.
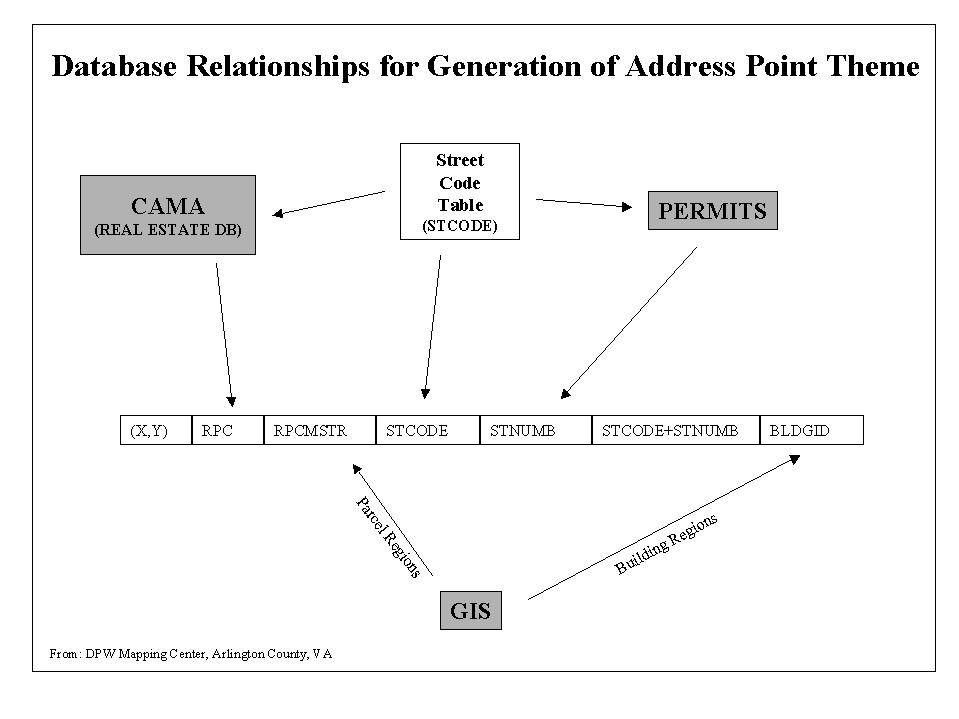
Because the mapping of development in Arlington is based on property addresses information, project sites are geocoded using the "address point" theme created by the mapping center. New development typically generates new addresses that must first be added to the address point theme before they can be geocoded. Although geocoding can be done on a site by site basis, the degree to which ArcView can automatically generate a set of geocoded projects greatly enhances the efficiency of project analysis and associated data quality. The Mapping Center's Intranet site has therefore been a key player in the development mapping process, enabling planners working with development data sets from the Permits Plus (permits tracking) and Development Tracking systems to quickly determine if certain projects will be included in the available address point theme based on the posted "update" date for that data layer.
As with any project, there were many challenges throughout the process. The Arlington County interactive development mapping system has a few that are worth mentioning particularly for those who might be interested in implementing a similar system.
Arlington County currently employs two datums for its GIS data while it converts from NAD 27 to NAD 83. Ensuring that aerial images, building footprints, and geocoded data sets are all in the correct projection has been an important task in the successful use of the project data.
Currently the updates to aerial photos, building footprint or planimetric layers, and creation of new address points are not coordinated. Viewers of development information are therefore limited by what data is available at any given time, and updates to the mapping application can be slow. Although a new set of building footprints is likely to be in use within the year, the importance of aerial photographs in helping those who do not have a working knowledge of the County's buildings to visualize development data cannot be understated. Aerial photographs are currently not produced on a regular (i.e. annual) schedule that would keep pace with the rapid development in Arlington's Metro Corridors. Although the address point theme is updated more regularly than either the building or photo layers, and new interdepartmental cooperation has improved the speed of data transfer, there is still a time lag between the creation of an address point after a building permit is approved. Georeferenced address points need to be added to the system in a more timely manner, ideally as part of the Permits Plus application and as an automatic step when an application is approved.
Although our Development Tracking system now provides interested users with a georeferenced data set with periodic new construction and demolition figures, there remains a missing link between the inspection services department that reviews and approves building permits and GIS technicians who maintain the building footprint layer. Larger development projects requiring public hearings are typically quite easy to follow, as their permitting and construction processes are often drawn out and in the public view. For these projects, plans are easy to come by, and are occasionally published on the Internet or in various publications.
Keeping track of infill development of single family houses is a more cumbersome task, particularly because projects tend to be spread throughout the County. Plans for approved projects that do not require a public process (called "by-right" development) are kept on file for just six months due to the volume of permits that are filed. As an indication of the magnitude of this problem, there were 15 multifamily and 12 commercial projects approved with plans readily available for digitizing, but 86 single family houses whose plans have been filed away or, in some cases, already discarded in 2001. During the same year, there were three demolitions of multifamily projects, five demolitions of commercial projects, and 51 demolitions of single family houses. Although plans may be scanned and stored on compact disks in the future, it is currently essential that GIS staff obtain the approved plans for addition to the GIS layer in a timely fashion.
Perhaps more importantly, there is currently no transfer of the graphic images of site plans for new development between the Department of Community Planning, Housing and Development and the GIS staff in the DPW that are responsible for the maintenance of building layers. Our new Development Tracking system and the DMC report have greatly improved the flow of information between departments, allowing the DPW staff to locate new and demolished buildings, but a system by which new plans could be delivered to GIS mapping staff is still needed.
The County is continually working toward requiring plans in digital format. Once implemented, GIS staff would then be able to integrate new building polygons (as well as associated improvements to the planimetric layers) without having to hand digitize data new building footprints.
A second major challenge throughout the project has been deciding when to add building footprints to the data layers visible by the public. Planning staff typically require very up to date building footprint information for public meetings or any analysis that they may become involved in. Similarly, the Department of Economic Development uses building information and plans to attract new developers/employers to the County. With up to date footprints, developers can see their proposals in relation to those of other developers, County plans, or in a broader context than what they may have used for their planning analysis.
Planning staff have developed strict criteria for the addition of new buildings based on the issuance of a Certificate of Occupancy permit, which may come months after a building has been erected and appears complete from the street. The main goal of this approach is to identify buildings as complete when they are in use, either by residents in new housing units, or by commercial tenants. The Department of Economic Development, on the other hand, would prefer to see buildings added to development maps as soon as ground is broken, or sometimes even earlier. County officials often use maps that depict projects that have been approved but are not under construction so that they may make decisions about surrounding properties in order to relate to those proposed projects or to plan around their eventual development.
Although planning staff has been clear in its definitions of completed projects, use of the Internet mapping application by other County staff and the public may dictate the appropriate time to add building footprints to the internet mapping application.
A long-term goal of this project is an online set of attributes for all of Arlington's buildings, certainly beyond the boundaries of the Metro Corridors. The advancement of Development Tracking data and incorporation with the Development in the Metro Corridors data will play a role in this process. As new buildings are added to the planimetric layer, there will be a prime opportunity to add attribute data that could be useful for a variety of projects.
Development data is continually changing and the square footage approved for development may or may not match the number that is eventually built. The added flexibility of this system will enable planners to update development information routinely will ensure that the data set being used is as accurately as possible.
Much more work remains to be done before this system can be fully implemented. Currently test versions are available to County Staff online. Feedback from staff, the completed 2001 planimetric data, and full coordination of the Development Tracking and DMC databases will yield a fully operational development mapping application. The final remaining task will be to educate the users of the application about the approach needed to use the application on a routine basis.
This project is a collaboration of many individuals in several departments. I would particularly like to thank Tim Ernest, Russel Banks, Bill Grether and Mary Beth Fletcher in the DPW Mapping Center as well as Anthony Garrett and Lisa Fowler in CPHD for their efforts to make this project a success.