GIS in Horry County South Carolina 1900 Acre Fire
|
Olaf C Jonasson
Kevin Cary
Esri Paper No. 795 |
| Abstract |
| This paper describes the use of GIS during the Long Bay Fire (November 7-13, 2001), which consumed 1900+ acres in Horry County, South Carolina. The GIS department was asked to provide support to the incident command throughout the emergency. This paper explains how that support was carried out, including workstation setup, data (original data), and data collection (with Arcpad and GPS via airplane and on the ground). This paper also presents what the GIS department learned and how our experience will effect future emergency situations in Horry County.
|
| Background |
| Horry County started implementing GIS in 1998. The original data comes from flights done in March 1998 and includes Digital Orthophotography at various resolutions down to � foot pixel resolution, 2 foot contours, street centerlines, edge of roadway, hydrology, water devices, electric devices, etc. At the time of the Longbay Fire, GIS had been implemented in eight departments. This was our first time using GIS in the field in an Emergency situation.
|
| Longbay Incident |
| The Longbay Fire burned from November 7 to November 14, 2001. It burned approximately 1902 acres. The cause is thought to be a cigarette thrown from a car on Hwy 22 (Conway Bypass). There were no injuries and no homes were lost.
|
| How did the GIS department get involved? |
| The fire started Wednesday November 7th, 2001 at approximately 1:00pm. On Thursday November 8th, The Public Safety Director called the GIS Department and asked if someone could come out to the command post At 6:00am on Friday November 9th with a computer, printer, and whatever GIS data was available. The request from the fire chief was to show roads, buildings, water sources, and power lines.
|
| What did we bring? (Hardware) |
| I brought one Dell Latitude Laptop with a 650mhz Processor and 256mb of SDRAM Memory, An Epson Stylus Color 1520 Printer, an IPAQ PocketPC with 32mb RAM, Pocket Trimble GPS (borrowed from the City of Conway).
|
| What did we bring? (Software) |
| For the Laptop we used Arcview 3.2a, and for the IPAQ we used ArcPad 5.0.
|
| What did we bring? (Data)
|
| Data on the laptop consisted of a 2FT pixel resolution MrSID image of the entire county, and all available planimetric data as well as the county�s parcel shapefile.
|
| What did we do?
|
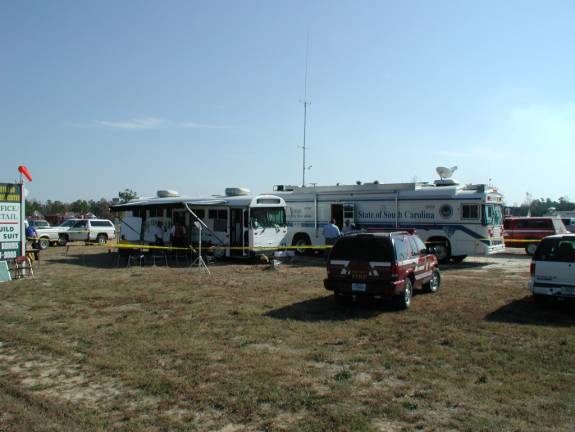 |
| (Mobile Command Center) |
| After setting up in the mobile command center, the first task was to create 11x17 maps that showed the fire area (a shapefile of the fire area was created by visual reference of a Division of Forestry map) as well as all roads, water sources, structures, power lines. Also on this map were points denoting the position of the five fire divisions combating the fire.
|
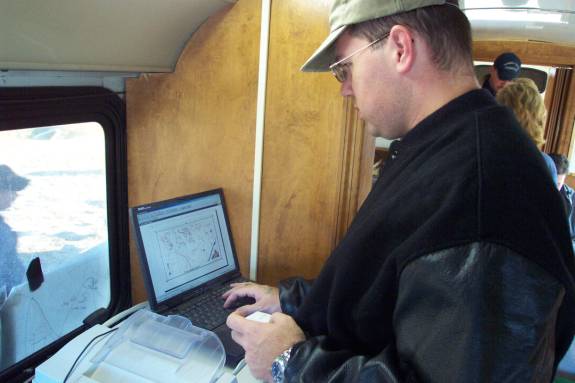 |
| (Creating first map)
|
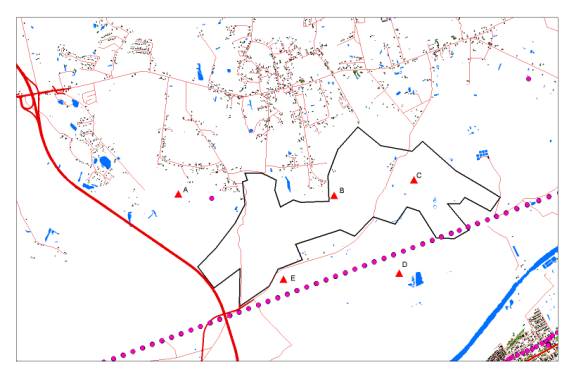 |
| (First map with Forestry�s fire boundary)
|
| After the initial map was created for the 8:00am briefing We decided to try and get a better perimeter. We knew there was a Civil Air Patrol Cessna 172 flying everyday to provide live video feeds.
Kevin Cary (City of Conway) went up with the Civil Air Patrol with his IPAQ and Trimble Pocket GPS in an attempt to fly the perimeter of the fire. Good visibility but minimum altitude had to be 2000 feet MSL because Blackhawks were in the vicinity dropping water.
|
 |
| (Original map with new perimeter from flight)
|
| What is evident from the map is that the flight perimeter is very different from the forestry perimeter. This caused some anxious moments for the command staff as they had to send observers to check on the populated areas that the flight perimeter indicated to be burned.
|
| Problems with the Flight Perimeter
|
| A) Altitude. As the vertical distance between the aircraft and ground
increased, it was difficult to keep the aircraft's subpoint over the
perimeter of the fire and scorched earth. In other words, the displacement of the aircraft's subpoint increased with increasing altitude.
|
| B) Momentum. Aircraft would over shoot and/or under shoot a "zig zag"
perimeter because a minimum speed must be maintained otherwise the
aircraft would stall.
|
| C) Surface features. Smoke obscured the view in determining scorched
earth from undamaged earth.
|
| Map updates during the remainder of the Fire
|
| The map was then continuously updated to show fire division placement and perimeter by using the forestry fire line. We were unable to fly the perimeter again due to the unavailability of the airplane. Driving the perimeter was suggested but not allowed till the fire was under control.
|
| Post Fire Perimeter |
| On the last day of the fire, it was deemed safe enough to drive the perimeter of the fire. The forestry bulldozers had plowed a path around the fire and I drove the path with the IPAQ and Trimble Pocket GPS in a Gator Utility vehicle.
|
|
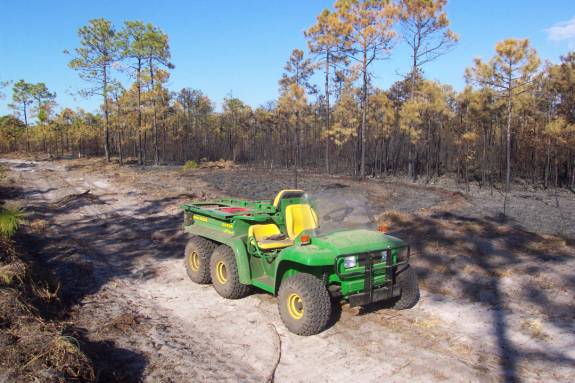 |
| (Gator in the field) |
| The mapping of the Perimeter on the ground went very well. In about half a day I was able to map that portion of the perimeter north of Water Tower Road using the IPAQ and ArcPad with only about 5 minutes of instruction.
|
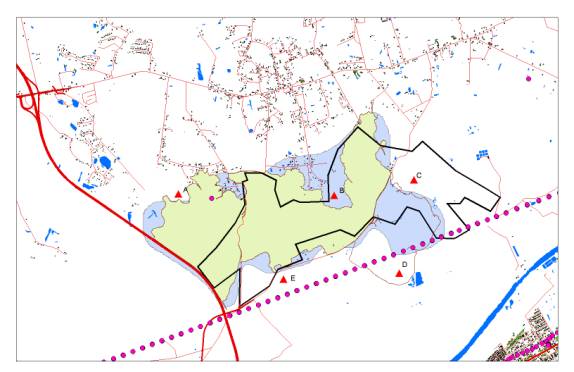 |
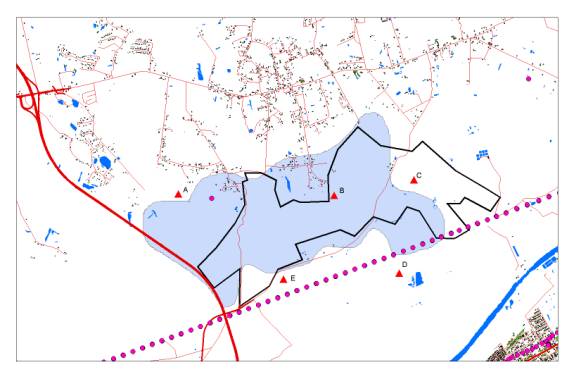
| (Green area is Perimeter north of Water Tower Road mapped on ground) |
| The map above shows the difference between the Division of Forestry�s perimeter, our flown perimeter, and the perimeter we mapped on the ground.
|
| Complete Mapping the Perimeter |
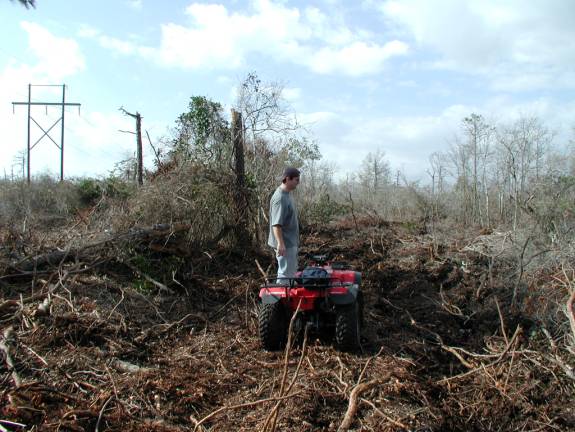
| We returned to the scene on November 30th, 2001 in order to complete mapping the perimeter if it was possible. This time we used four wheelers in order to get better access.
While we were able to map most of the portion of the fire that was south of Water Tower Road there was still an area that was inaccessible and we were forced to map that in the office.
|
 |
| (Inaccessible Area) |
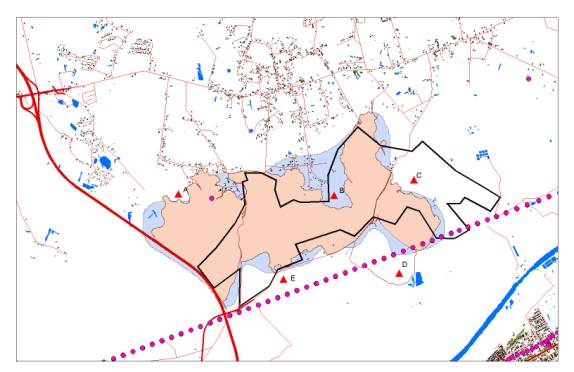 |
| (Final fire perimeter with flown perimeter and Division of Forestry Perimeter) |
| Conclusion (What would I do differently next time) |
| The Long Bay Fire was a great learning experience for the GIS Department as well as all county departments. There were no injuries, lost homes, or any other types of major damage. The command staff coordinated local, state, and neighboring state resources for eight days. Although there problems and unforeseen circumstances, the general consensus is that everything went as well as could be expected and many lessons were learned that would help if this type of situation presents itself again.
|
That being said, here are the things I would do differently next time:
If possible, I would like to be on the scene earlier. We came on the scene on the third day when a good majority of the area was already burned. Arriving earlier would allow us to have a timeline of perimeters.
Although our flight did not work out as well as we would have liked, next time I would fly again as many times a day as possible (if resources are available). Also I would suggest using a helicopter if possible. This will allow lower and slower flights, as well as the ability to stop, hover, and back up. Do not be afraid to ask for anything you want. You will be surprised how many resources are available during a situation like this.
One of the things we did not have access to is AVLs in our vehicles. We would like to have them on all the emergency vehicles as well as the Division of Forestry�s vehicles so that the command staff can have a real time view of the locations of their units. An alternative may be to have GPS units in all vehicles with the units reporting their positions on a regular basis.
Wireless connectivity to our network is also something that is very desirable. We would like to be able to have access to all the data on our network. We have half foot pixel .tif images that are just to big for a laptop.
Overall this was a good experience and we hope to be able to do more the next time we have an emergency situation.
|