Utilizing data collected by the County of San Diego Medical examiner’s office, the County identified locations where immigrants along the U.S./Mexico border and throughout San Diego County have suffered injury fatalities during the past several years. With the aid of GIS spatial analysis tools, investigators were able to examine spatial-temporal trends and the physical geographic features of these events. The County hopes to be able to use this information to predict where and when these types of events might occur in the future to prevent the most serious outcomes and to enable the most efficient (EMS) response.
Since the inception of Operation Gatekeeper in 1994, there has been growing concern over the plight of immigrants attempting to illegally cross the border from Mexico into the United States. It has been argued that concentrated patrol efforts along the international border in San Diego County’s most developed and accessible areas, have forced individuals attempting to make this crossing on foot into more remote areas and less hospitable terrain. Data compiled from the Mexican Ministry of Foreign Relations and the Mexican Consulate suggest that since 1994, there has been an overall increase of 509 percent in deaths among unauthorized border-crossers along the California segment of the U.S. – Mexico Border, a majority of these attributable to environmental causes. Even larger increases have been documented in Arizona and Texas (Cornelius, 2001).
The number of apprehensions of illegal immigrants by the US Border Patrol since 1994 has increased in every sector except San Diego. While San Diego apprehensions have dropped 66 percent from a high of 524,231 in fiscal year (FY) 1995 to only 151, 681 in FY 2000, apprehensions in Imperial County (El Centro) have risen 761 percent from 27,654 in FY 1995 to 238,126 in FY 2000 (US Immigration and Naturalization Service). In 1994 San Diego represented approximately 46 percent of all apprehensions along the Southwest border; in 2000 it represented just over 9 percent.
Not all injury-related fatalities among undocumented or illegal immigrants occur while crossing the international border. After the initial crossing, they typically settle into daily living and working conditions that are more hazardous than the average US citizen. If this is true, they are likely to be at greater risk for unintentional injury death after coming to the United States as well as during the crossing.
This study was conducted as an effort to increase understanding of the patterns of injury mortality among non-resident Hispanics in San Diego County as compared to the resident Hispanic population. Information from 1651 deaths was obtained from the San Diego County Medical Examiner from January 1995 through December 2000. We examined non-spatial and spatial attributes, including demographic information, mode, location and year. Particular attention was paid to unintentional injuries related to environmental exposure, drowning and motor vehicle accidents as well as those events occurring near the US – Mexico Border.
The set of all fatalities due to non-natural causes from 1995 through 2000 were selected from the County of San Diego Medical Examiner’s database. The data were further queried to select only those individuals identified as being of Hispanic ethnicity and whose deaths occurred within San Diego County. Residency status, as determined by the Medical Examiner’s Office and their investigators, was categorized into three groups: US resident, non-resident and unknown residency status.
Statistical analyses of non-spatial data were performed using SPSS v. 10.1. The variables analyzed include: age group; gender; year of event; intent; mode (homicide, suicide, accident); location type (open area, business hospital, residence, street, hospital) and unintentional sub-category (motor vehicle, exposure, drowning, drug/alcohol ,other). Chi-square tests were used to determine statistically significant differences between resident and non-resident Hispanic frequencies.
All mapping procedures were performed using ArcGIS 8.2. The locations of the event that precipitated death were geocoded using address matching to a San Diego Streetmap geodatabase. This accounted for approximately 60 percent of all locations; those that could not be matched to an existing address were matched interactively or manually geocoded. The SPSS dataset was converted to dBase format and then imported into an Info table for spatial analysis. Digital map layers of San Diego County used for display and population estimate data for year 2000 census tracts were downloaded from SANDAG’s website and imported into ArcGIS.
Maps displaying overall mortality and population data were created in ArcMap. Layers representing sub-categories of interest were created and mapped separately to display any potential differences in spatial distribution of the events. Chloropleth maps of annual injury death rates per 1,000 Hispanic populations by census tract were created for all deaths and separately for resident and non-resident sub-groups.
X, Y- coordinate data from distributions of interest were exported into Dbase format, converted to text files and used to perform spatial statistical analysis using Point Pattern Analysis freeware. For each coordinate dataset, the second-order K-function or Local G* was calculated to look for statistically significant differences in the spatial distribution of events.
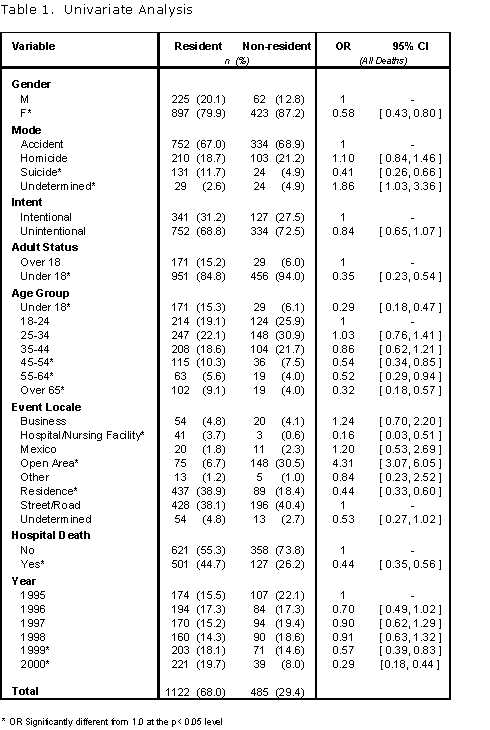
All Deaths. The final dataset represented 1651 individuals: 1121 residents, 485 non-residents and 45 of unknown residency status. Results of the non-spatial analysis for all injury mortality can be found in Table 1. As compared to residents, non-resident Hispanics are significantly more likely to be male, less likely to die as the result of suicide, less likely to be under 18 or over 45, less likely to die in a hospital or at a residence and are more likely to suffer from a fatal injury in an open area. Additionally, the proportions of all Hispanic injury fatalities attributed to non-residents were significantly lower in 1999 and 2000 than in 1995: approximately 1.75 times less in 1999 and 3.45 times less in 2000. Among unintentional injury-related deaths, as compared to motor vehicle accidents, the odds of a non-resident dying as the result of environmental exposure were over 23 times that of a resident. Non-residents were less likely to die from drug/alcohol or other related causes than residents.
Yearly Trends. Frequencies were calculated for mode of death and for unintentional injury category by residency status by year. There was a significant decrease in the proportion of accidental and homicide deaths attributed to non-residents, although this appears to be due to the significant decrease in the total number of non-resident deaths in 1999 and 2000. The proportions of deaths due to homicide and accidental causes among non-residents have remained relatively constant across the study period. A graph of the frequencies of unintentional injury by residency status is shown in Figure 1. An analysis of accidental deaths shows a significant increase in the proportion of exposure deaths attributable to non-residents and a decrease in the proportion of motor vehicle and drowning deaths. Figure 2 illustrates the yearly figures for non-resident Hispanic unintentional injury mortality by type. It is interesting to note that all types of unintentional injury mortality have decreased since 1995 except exposure, which continues to rise despite dramatic decreases in the total number of non-resident deaths.
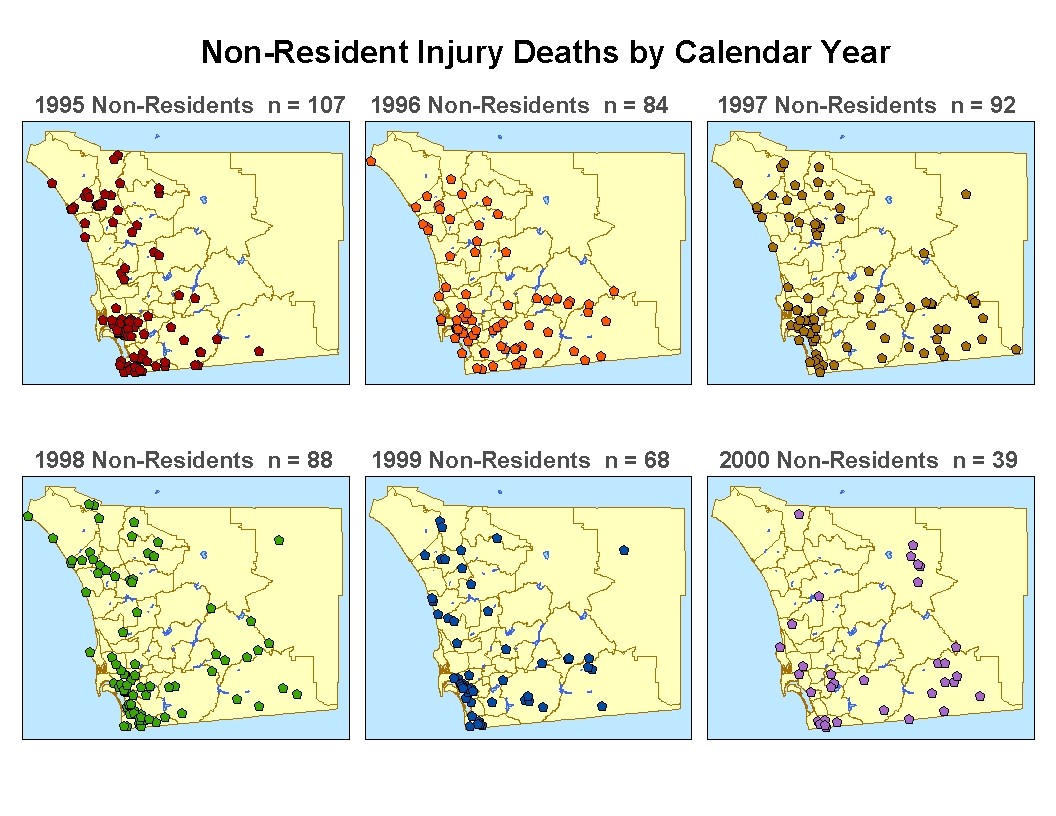
Maps. Of the 1651 records, 1558 were found to have had event locations within San Diego County proper and were successfully geocoded. Figure 3 represents the distribution of all Hispanic injury fatalities in the county from 1995 through 2000 and the Hispanic population density by census tract based on the 2000 census, respectively. As can be seen from comparing the two distributions, although there is a tendency for deaths among Hispanics to occur where the population primarily resides, there are many deaths occurring in regions with some of the lowest density. The distribution of Hispanic deaths cannot be entirely explained by the distribution of the resident Hispanic population. To further explore the spatial distribution, individual maps were created for the following categories: intentional injury, unintentional injury, motor vehicle accidents and exposure / drowning deaths. Each of these categories was further divided into two maps representing the distribution of deaths for residents and non-residents. Figure 4 displays the distribution of all deaths for residents as compared to non-residents. Visually, there does appear to a difference in the spatial patterns of the two groups: non-resident deaths appear to be more dispersed and have a greater proportion of events occurring in the southern and eastern quadrants of the county. This pattern is consistent for unintentional injury overall (not shown) and the sub-category of exposure/drowning deaths (Figure 5). There are no obvious visible differences between the distributions of intentional injuries or motor vehicle accidents deaths among resident and non-resident Hispanics in the county. Figure 6 shows to chloropleth maps of death rates among Hispanics over the 6-year study period by census tract, using year 2000 census data for the denominators. Examination of the maps reveals differences in the distribution of deaths across the county for resident and non-residents, similar to those seen with the point data (Figure 6). There is a higher concentration of deaths along the coast and mid-city for the resident population and a higher concentration in the southeastern and eastern regions of the county for the non-residents. Interestingly, both groups appear to have high injury mortality rates in the region of Mount Laguna. In an effort to study temporal patterns, maps of injury deaths by year were created to display annual mortality trends for all injuries, unintentional injuries, unintentional injuries among residents, among non-residents and fatalities due to exposure and drowning. An illustration of the distribution of non-resident injury deaths by year can be seen in Figure 7. There appears to be a slight trend toward greater dispersion of events from 1995 to 2000. It is possible that the apparent decrease in clustering about South and Central San Diego this may be an artifact of decreasing sample size, rather than a true change in the spatial distribution of events.
To quantify the potential differences in the distributions and test for significance, the spatial statistical methods outlined above will be used. Final results are not yet available.
These results represent a preliminary analysis effort to characterize trends in the distribution of deaths among non-resident and resident Hispanics in San Diego County. The assumption is that deaths among individuals classified as Hispanic non-residents reasonably represent the occurrence and distribution of injury mortality among the local immigrant population that yearly cross the international border, travel through and find migrant employment throughout the county. As more reliable data regarding the location and nature of health events affecting immigrants attempting to cross the US-Mexico border become available, it will be possible to make more definitive statements about the nature of the hazards affecting these individuals. In the interim, these preliminary results are consistent with the demographic trends reported by the INS, the Mexican Consulate and independent researchers and allow us to begin quantifying health outcomes in this population.
The total number of non-resident deaths reported in San Diego County has significantly decreased in the last two years, as have the number of apprehensions made by the Border Patrol. While the total number of deaths among non-resident Hispanics has dropped, the number of deaths due to environmental exposure continues to rise. This fact, coupled with what appears to be a tendency towards a greater dispersion of deaths across the eastern half of the county is consistent with concerns raised over the possible re-routing of immigrants into more harsh and inaccessible environments, placing them at greater risk for injury or death.
The spatial statistical analysis planned for these data will help to differentiate between variation in spatial distribution due to random error and those due to true differences. Additionally, efforts will be made to identify locations of migrant campsites in the county and use GIS analysis to help identify differences in mortality trends associated with those populations. Future research in this area could include conducting a similar study in Imperial County to see if the decreases in numbers of non-resident deaths in San Diego are associated with relative increases in Imperial County; using GIS and spatial modeling methods to incorporate elevation and temperature data into the analysis; and using Border Patrol Apprehension data and health incident reports to track all health-related events occurring along the US-Mexico border.
Table 1.
Figure 1.
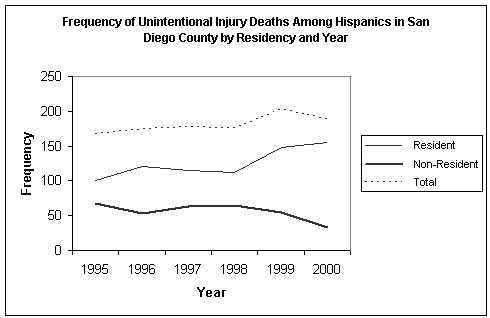
Figure 2.
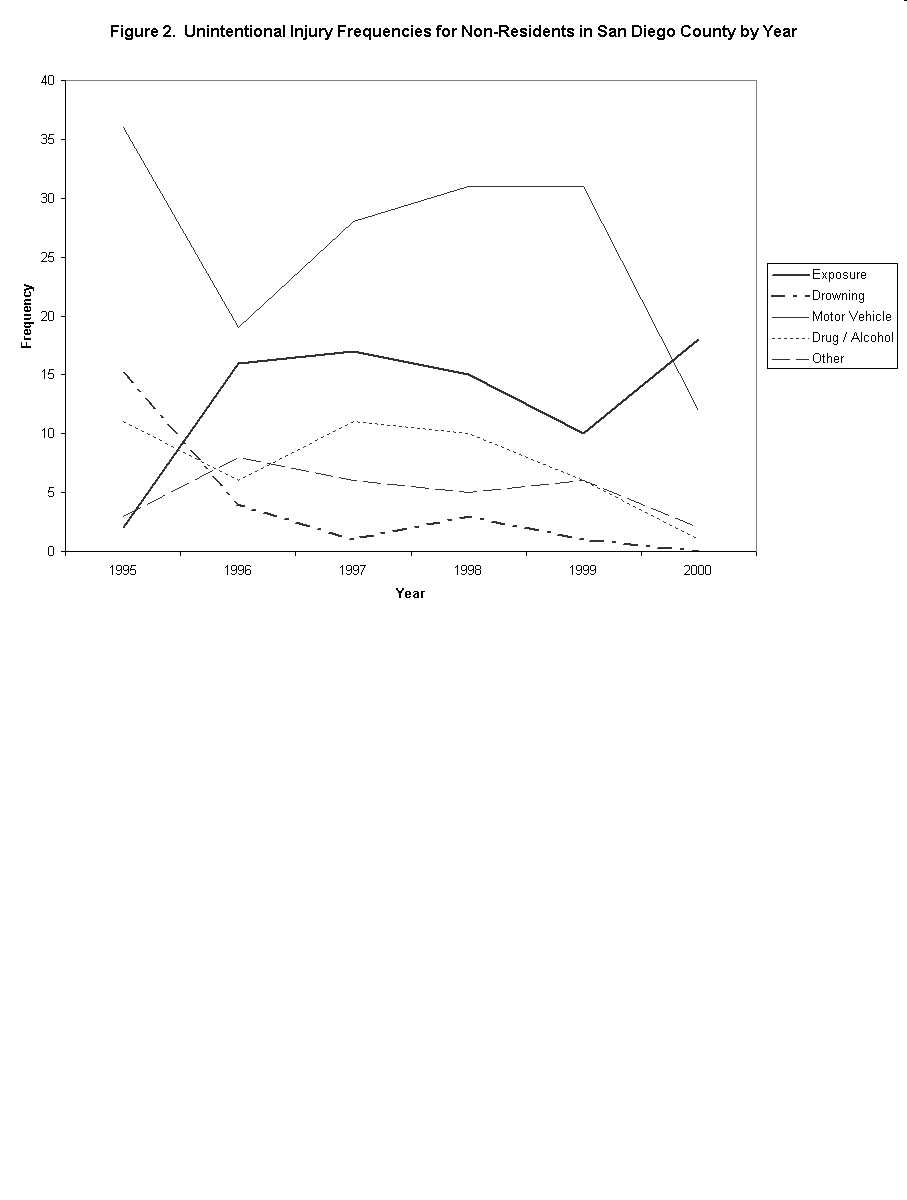
Figure 3.
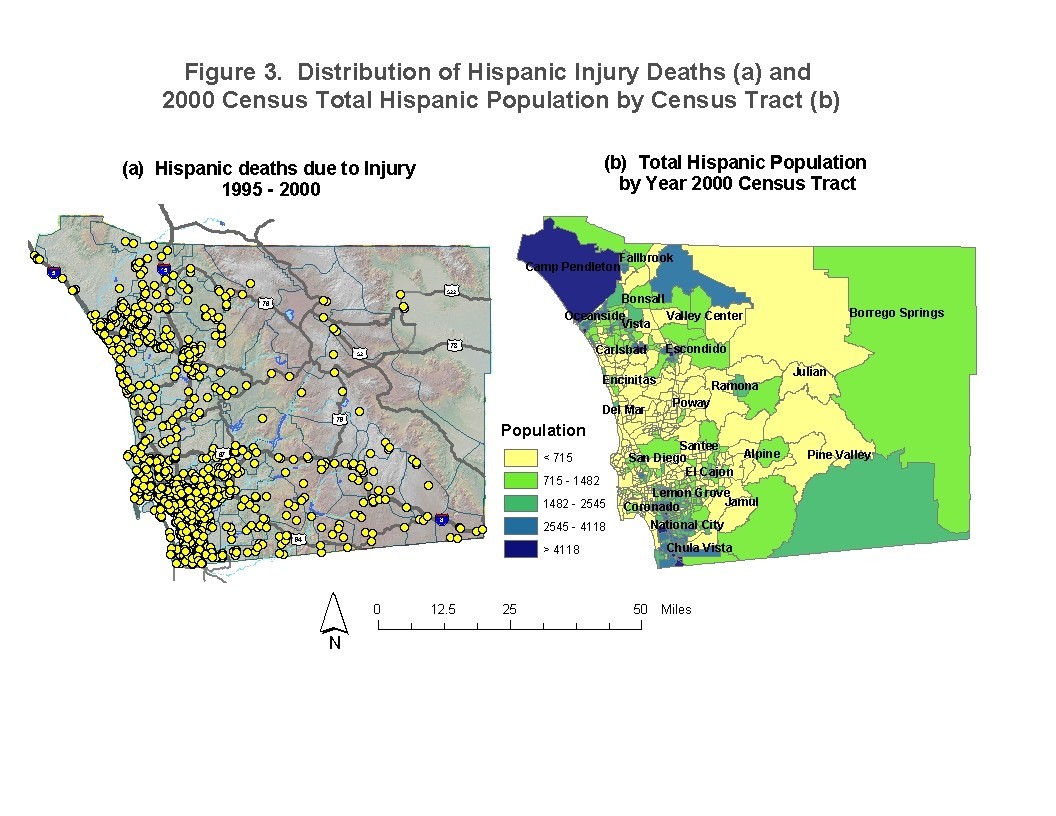
Figure 4.
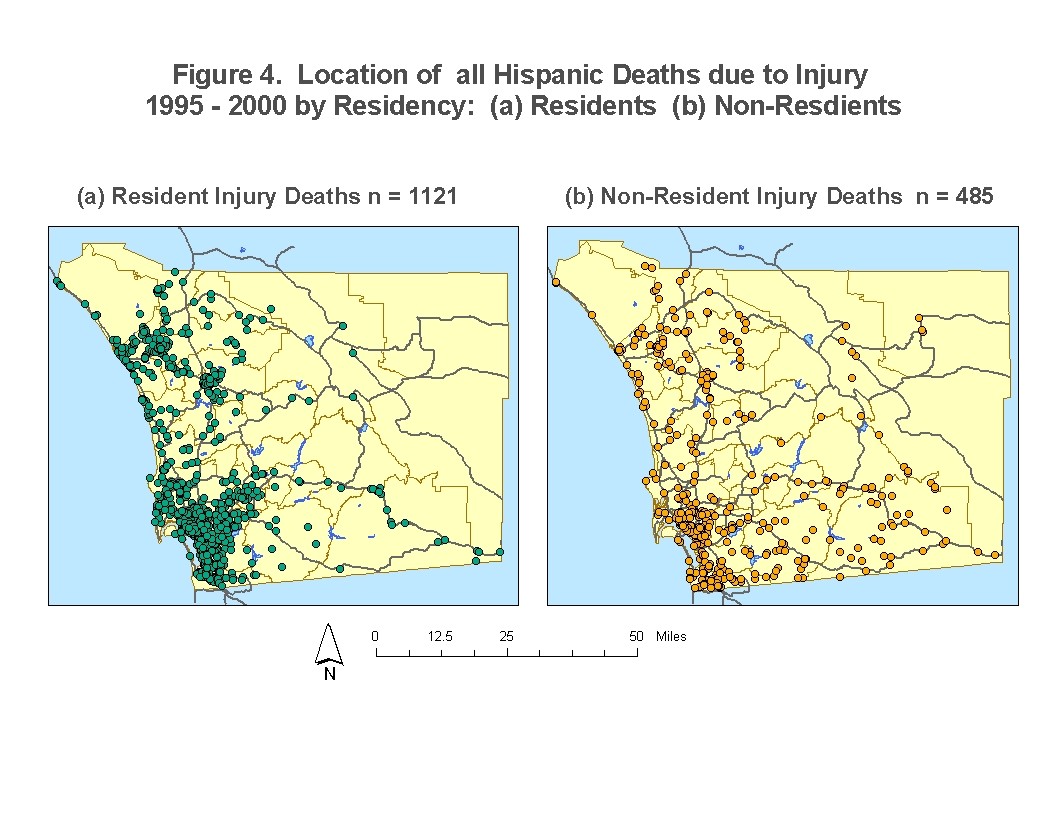
Figure 5.
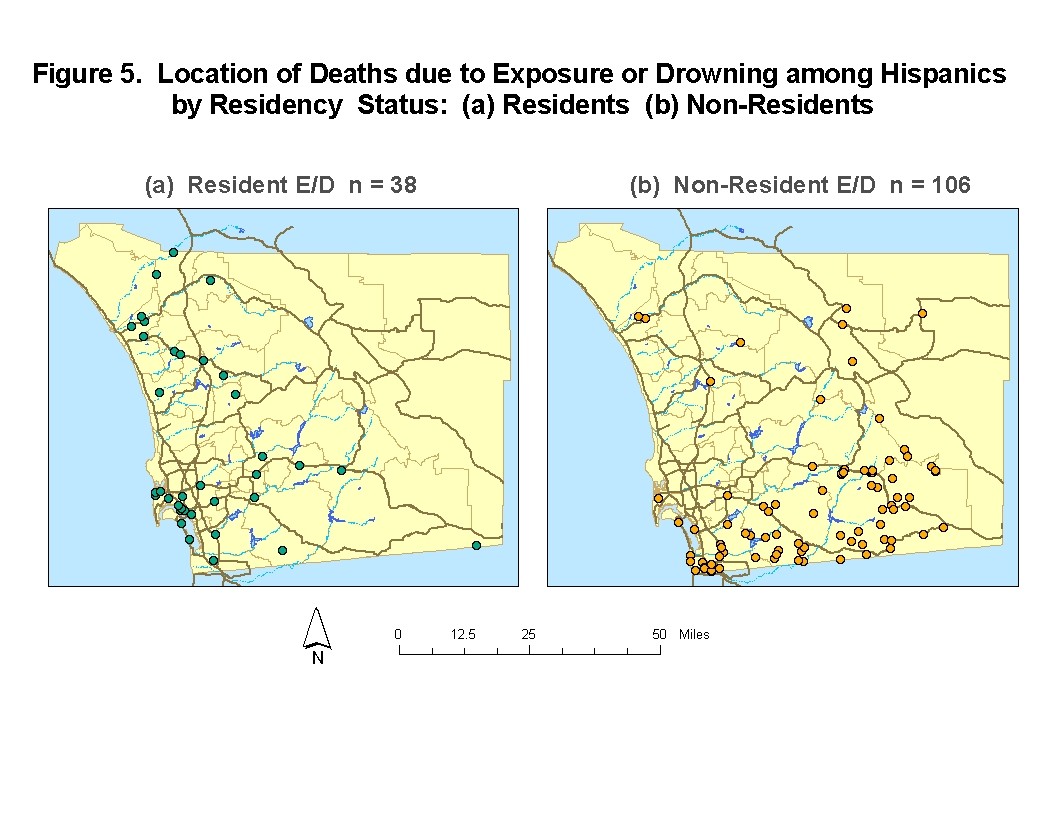
Figure 6.
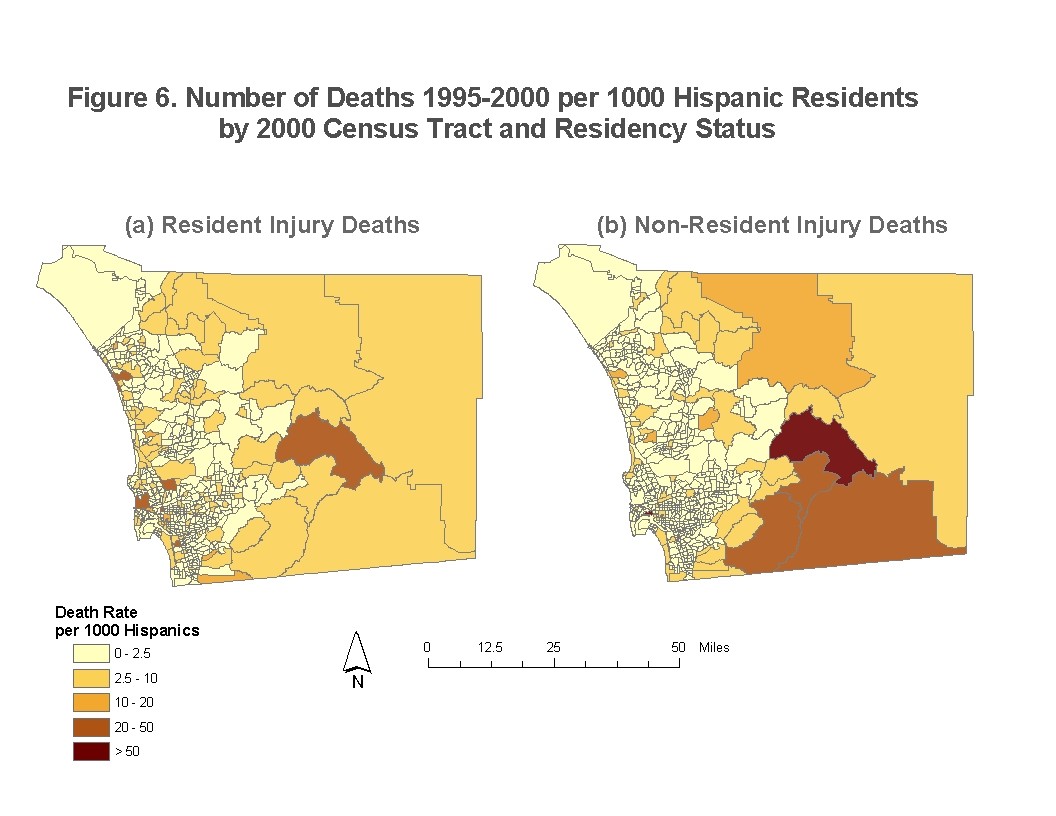
Figure 7.
e-mail: alyssavt@yahoo.com
County of San Diego, Health and Human Services Agency, Division of Emergency Medical Services, 6255 Mission Gorge Rd, San Diego, CA 92120, phone: 619.285.6429, fax: 619.285.6531