City of Orlandoĺs GIS Weather Public Safety Solution
By:Reed Moormeier
President, Meteorlogix, LLC
Since I am not a technical person and donĺt have much hands on experience utilizing any GIS Iĺve chosen to take the approach of reviewing this solution from a management point of view looking at the critical issues facing the City of Orlando that are affected by weather.Several years ago Meteorlogix began working closely with the City of Orlandoĺs Fire Department by providing them a service that included real-time weather information display and alerting capabilities.Over the years we have stayed in close contact with the users of this system and frequently discussed their critical issues as they are related to weather and new technologies the City of Orlando has implemented and those that we at Meteorlogix were utilizing.About a year and a half ago it became clear that both the City of Orlando and Meteorlogix had made significant progress in implementing GIS, Orlando into the day to day decision making process within the City and Meteorlogix by making our weather data available in Esri GIS formats.As discussions progressed related to how Orlandoĺs Fire Department could best utilize GIS weather capabilities it became apparent that more than just the Cities Firefighters could benefit from real-time weather data as a GIS layer.The cities Public Works Department was concerned about monitoring water levels at various lakes within the city, Emergency Management personnel were concerned about the path of severe storms and the Fire Department was concerned about how weather conditions, including precipitation, wind speed and wind direction affected HAZMAT situations.
The critical issues that were addressed by providing real-time weather data in GIS format for each department were as follows:
Emergency Management:Not knowing precise areas of the city that would be impacted the most by severe weather and the population and facilities affected, whether that being from Severe Thunderstorms, Hurricanes/Tropical Storms or Tornados.
Public Works:Not knowing until reported that flooding was occurring or about to occur and where to dispatch crews in a timely enough manner to prevent unnecessary flooding.
Fire Department:Current HAZMAT and Chemical Plume modeling capabilities were not accurate resulting in high costs and leaving citizens and workers exposed due to the use of distant and old weather conditions being used to project the plume.
The solution to the problem, Meteorlogix MxVision MetroWatch, a customized GIS based solution that incorporates Esriĺs ArcView 3.2, Meteorlogix MxAnalyst ArcView Extension and Science Applications International Corporationĺs (SAIC) Catastrophic Assessment Tool Set or ôCATSö ArcView Extension along with a network of 14 weather sensors and 5 water level sensors providing real-time observation data every 3 seconds to the central database.What Meteorlogix provided was a fileserver to manage the incoming weather data both from the Orlando owned sensor network and from Meteorlogixĺs 1Megabit satellite delivered real-time weather data feed, the Meteorlogix fileserver automatically converts the appropriate data into Esri point and polygon shapefile format and the MxAnalyst extension make the use of the data simple and straight forward for both end users and Esri business partners wishing to ôWeather Enableö their extensions or applications.Which is precisely what SAIC did with their CATS extension.
Letĺs take a closer look at how the combination of Esriĺs ArcView 3.2, SAICĺs CATS extension and Meteorlogixĺs real-time Weather data and MxAnalyst extension solved the critical issues of the City of Orlando mentioned above.
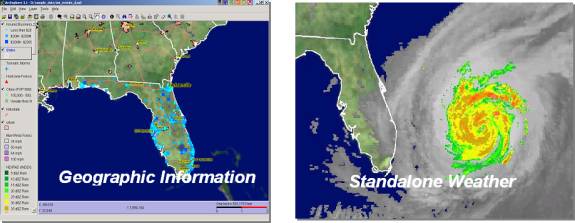
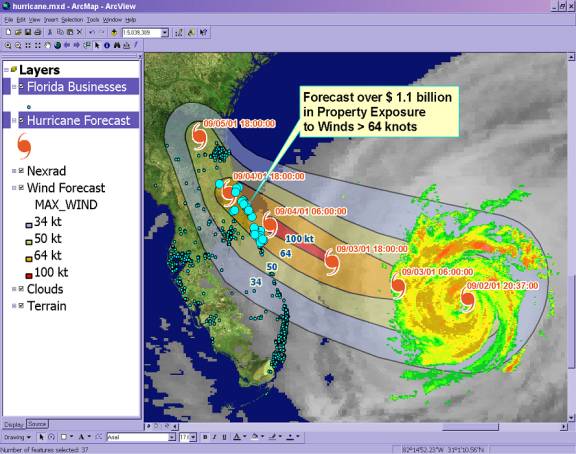
Ě Emergency Management officials were concerned about knowing the projected track of severe weather of all types and wanted to be able to perform detailed analysis of the affected area.By converting the projected track of tropical storms into polygon shapefiles city emergency managers are able to stop the old ôstare and compareö method of determining the affected area and get both the precise path and intensity of the storm as a layer in ArcView to perform damage assessment analysis prior to the storms arrival.The figures below compare the old versus the new method of doing this analysis.First the old method of ôstare and compareö using the GIS selection tools to identify the affected components of each data layer based on the visual comparison of the two images on different systems to hand draw the affected area based on what is seen on the standalone weather system.While this method is certainly not ideal it is a big improvement over the days before GIS.But today with the MxAnalyst extension to ArcView real-time weather data is simply loaded as a data layer in ArcView and the selection of the affected data is both precise and timely allowing very sophisticated damage assessment to be performed.I should mention that SAICĺs CATS extension to ArcView has a wonderful tool set that allow the user to perform state-of-the-art hazard and consequence assessments for both technical and natural disasters.Weĺll discuss CATS again later as it applies to Orlandoĺs HAZMAT response team.
ôStare and Compareö
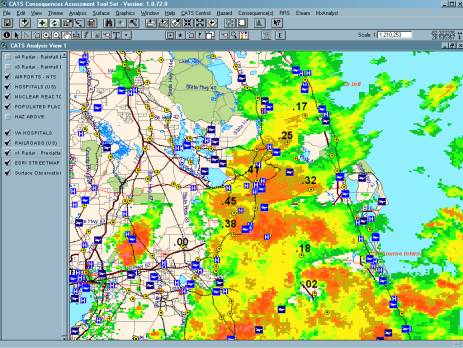
Public Works officials in Orlando are mostly concerned with one weather event, flooding.If you have ever flown into Orlando you know that is has several, actually over 100 lakes within the city limits.Orlando is also prone heavy rains, sometimes in isolated areas where one part of the city may get two inches of rain in less than an hour and other area get none at all.Often time the flooding that occurs is due to storm sewers being blocked by debris and if the areas of heavy precipitation can be determined quickly, crews can be dispatched to the local area to monitor the storm sewers and prevent the flooding.The problem is the past has been that Orlando has two National Weather Service reporting sites that update their observations every 20 minutes.Neither timely enough, nor dense enough coverage to accurately predict where flooding might occur.The solution was two-fold, first the city installed their own network of 14 weather sensors and five lake level sensors which provide real-time observations every three seconds.This data is collected into the central weather server database and converted into point shapefiles.Second, Meteorlogix provides storm total and one hour accumulated precipitation amounts derived from the National Weather Service NEXRAD radar network in polygon shapefiles covering the Orlando metro area updated every five minutes.The combination of these two data sets displayed in the cities GIS allows the Public Works officials to monitor accumulated precipitation in near real-time and dispatch crews to areas of concern often in time to prevent flooding.The image below shows current radar with accumulated precipitation overlaid.Public Works officials can at a glance see where the most rain has fallen and also see if there is more on the way to quickly dispatch crews to the most likely problem areas.
Fire Department officials in Orlando expressed to us that they consider HAZMAT situations where plume dispersion modeling capabilities are required to be a day-to-day occurrence for them.That does not mean it happens every day but they come to work every day knowing it could happen and actually have some sort of occurrence about every other week.I was surprised by the frequency of these occurrences and it underlines the need for accurate plume modeling to both protect the public and contain costs.Current weather conditions play a major role in the dispersion of chemical spills or worse, acts of terrorism using chemical or biological weapons and even weapons of mass destruction.áá Most of the best models for plume dispersion take wind conditions into account; the problem arises with where that data comes from and how old it is.Prior to Meteorlogix implementation of MxVision MetroWatch the standard for weather information used by plume dispersion models was National Weather Service Observations.These observations are taken every 20 minutes and most generally come from airports or NWS offices.There in lies two problems, first, weather conditions change quickly as fronts and high and low pressure systems move through the area, there can be dramatic changes in both wind speed and direction over a twenty minutes time frame.Second, the weather conditions at the airport or NWS office will very seldom match those of the affected area and there can be very dramatic differences when there is an active weather system in the area where the wind may not be only 10 or 15 degrees out of a different direction but instead could actually be out of the exact opposite direction.To first solve the problem the city of Orlando needed a private weather sensor network which Meteorlogix provided through our relationship with Praxis Software, Praxis provides the weather stations and communication software, Meteorlogix integrates the data into the weather database and converts it into point shapefiles making it viewable as a layer in ArcView. Meteorlogix has worked closely with SAIC to integrate real-time weather from private weather networks into its CATS plume dispersion models and the City of Orlando is the first deployment of this breakthrough technology.The sites selected for the weather stations were selected by the Meteorlogix staff including Certified Consulting Meteorologist to give the best coverage of the city.They are located at various Fire Stations around the city to ensure no area of Orlando is left uncovered. Now Orlando HAZMAT response workers have accurate real-time weather conditions from points all around the city to utilize when running the plume dispersion models.The CATS extension to ArcView selects the closest weather observation from the real-time network to calculate the plume dispersion.The figure below show the end result and also give an idea of how the plume model would have differed if the observation was used from a more distant location.As you can see by the wind arrows, the model would have shown a more easterly dispersion had the observation from the airport been used.
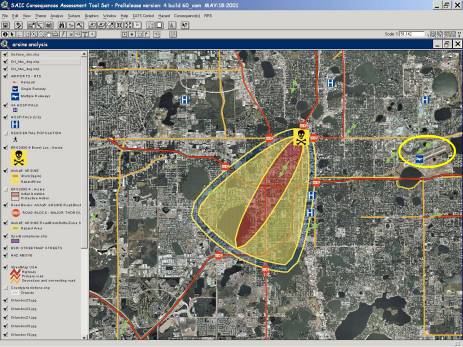
CATS Plume Dispersion Model using Private Weather Observations
The end result of this project solved critical issues of three departments within the City of Orlando, Public Works, Emergency Management and Fire/Rescue.Through the implementation of ArcView with Meteorlogix Real-time Weather data and a private weather sensor network the City of Orlando is a safer place to live work and visit.For more information visit Meteorlogix on the web at www.meteorlogix.com or email Reed Moormeier at reed.Moormeier@meteorlogix.com.