James Kuiper, Joe Adduci, Brian Cantwell, and Larry Gorenflo
Presented at the Twenty-Second Annual Esri User Conference, San Diego,
California, USA
July 8-12, 2002
Sponsored by Environmental Systems Research Institute
(Esri)
As part of the process to renew the Federal Grant for the 800-mile Trans-Alaska Pipeline System right-of-way, Argonne National Laboratory is assisting the Bureau of Land Management in preparing an environmental impact statement to examine likely consequences of both continued pipeline operation and system shutdown. This study presents a host of opportunities, and challenges, for the integrated analysis of spatial data. Topics as varied as ecology, human health, socioeconomics, and the risk of various accidents require detailed consideration along the entire length of the pipeline, with potential impacts ranging in scope from localized to statewide. This paper describes the unique GIS-related challenges encountered in this project and the approaches used to address them.
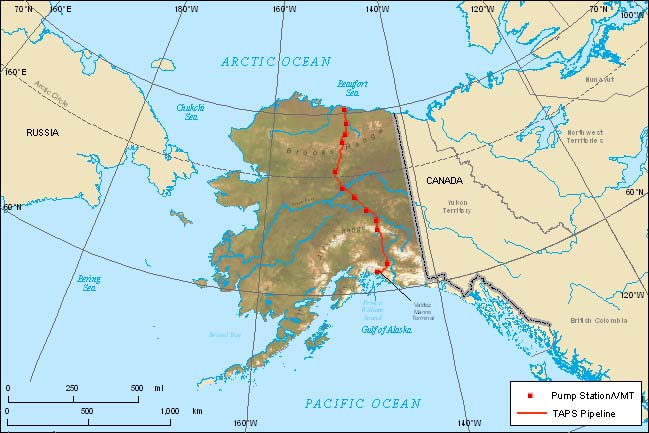
In 1968, oil reserves were discovered on the northern coast of Alaska at Prudhoe Bay, and work soon began to develop the oil field and find a way to transport the product to market. In 1977, the Trans-Alaska Pipeline System (TAPS) was completed and began transporting crude oil along the 800-mile route from Prudhoe Bay to Valdez (Figure 1). Average daily throughput from the 48-inch diameter pipeline peaked at over 2 million barrels in 1988 (APSC 2001). Currently the TAPS transports nearly 1 million barrels per day, or nearly 20% of domestically produced oil in the United States (TAPS Owners 2001). The TAPS pipeline is operated and maintained by Alyeska Pipeline Service Company (Alyeska).
The federal government and the State of Alaska own most of the land crossed by the TAPS right-of-way (ROW). The 30-year Federal Grant of the TAPS ROW will expire in January 2004, and Argonne National Laboratory has been tasked with assisting the Bureau of Land management in preparing the environmental impact statement (EIS) required for renewal of the grant. The alternatives analyzed in the EIS include renewing the Federal Grant for an additional 30-year period, renewing the Federal Grant for a period less than 30 years, and not renewing the Federal Grant. The draft version of the EIS is scheduled to be released to the public in July 2002.
The National Environmental Policy Act of 1969 (NEPA 1969) is the primary legislation mandating this work. The NEPA requires an EIS to be produced for major proposed federal actions that have the potential to significantly affect the environment. These EISs are intended to inform the public and decision makers about the potential environmental consequences of the proposed actions and their alternatives. The process of preparing an EIS requires analysis of a broad range of issues, such as land use, waste management, soils, air and water quality, ecology, noise, cultural resources, recreation, visual resources, transportation, socioeconomics, and environmental justice. Public participation is integral to the process and the issues raised by the public help guide and refine the analysis. Producing an EIS often requires a multidisciplinary team of scientists. A geographic information system (GIS) aides tremendously in the analysis because location is an important component for most of the issues.
Producing an EIS for a project of this scale is a large and complex undertaking, and this particular EIS is unique for many reasons. There are major political issues, such as national energy policy and environmental concerns, that involve the highest levels of government. The existence of the pipeline has dramatically changed the Alaskan economy and influences the national economy as well. The region spanned by the pipeline includes many distinct environments and several climate zones. Furthermore, issues unique to the region must be considered and analyzed, such as subsistence hunting and fishing, and the engineering challenges of permafrost soils and arctic climates. Because of the remoteness and size of the region, GIS layers for the area were limited in availability and level of detail, as well as how recently they may have been updated.
This paper focuses on the TAPS EIS project from a GIS perspective, highlighting some of the unique challenges of the project.
Work on the TAPS EIS project began in July, 2001 for most of the Argonne staff involved. Early stages of the project required the team members to rapidly and thoroughly familiarize themselves with the TAPS system and gather data for the many disciplinary areas to be analyzed. In this work they drew on the Environmental Report (ER) produced as part of the application process (TAPS Owners 2001). Lead authors of the ER presented their most significant results to Argonne staff at a workshop, and a library of more than 1,400 references was provided. This library was augmented by the Argonne staff as work continued, and as of June 2002 it had grown to more than 2,200 references. Absent from the original library was the GIS data used to produce the many maps in the ER; however, as the project continued, the EIS applicants not only provided most of the GIS data used for the ER, but responded to many other data requests as well. In addition to this source, many GIS layers were obtained from Internet data clearinghouses, published CD sources, educational institutions, state and federal agencies, and commercial sources.
Early in the project, most of the team visited the TAPS facilities and met many of the government contacts, scientists, and employees that would be called upon to resolve data requests and questions. The visit included detailed tours of the Valdez Marine Terminal, pump stations, and other facilities and driving the entire pipeline route from Valdez to the North Slope. Handheld global positioning system (GPS) units were used to record the locations of sites visited and locations where significant photographs were taken. Pipeline milepost information was also recorded when available. Each vehicle in the group was provided with engineering and environmental map atlases. Even though a relatively small scale of 1:143,400 was used for the atlases, 26 ledger-sized pages were required to cover the full extent of the pipeline.
The GIS database for the project grew rapidly, and work was prioritized according to the importance of particular layers for supporting analyses. At the time the draft EIS was completed, the database included more than 300 GIS themes, some of which were actually collections of many layers. Despite the many themes in the database, many limitations and challenges had to be overcome. Examples included:
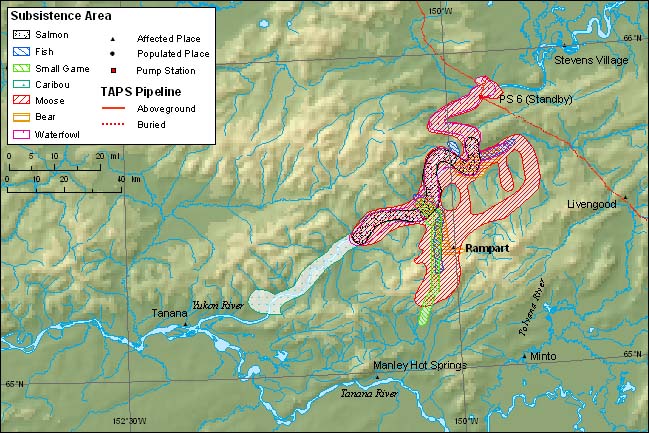
Analysis of the TAPS system for the EIS required consideration of several unique and interesting issues. Subsistence fishing and hunting is an example. In Alaska, the term subsistence refers to the noncommercial, customary acquisition of wild, renewable resources for personal or family consumption. Subsistence is an important part of the economies of rural Alaskan communities, providing food, clothing, and employment. While the subsistence harvest of wild food (fish, terrestrial and marine mammals, birds, shellfish) represents only 2% of the fish and game harvested annually in Alaska (Alaska Department of Fish and Game 2000), that harvest contains about 35% of the caloric requirements of the rural population. In some areas of Alaska, notably the interior and western areas, subsistence products provide more than 50% of the daily requirement. Detailed studies have been made of the subsistence activities of rural communities in Alaska, including mapping the areas used for different activities. Figure 2 shows an example of the harvest areas for Rampart in relation to the TAPS pipeline and facilities. The GIS was used to analyze the potential effects of the pipeline on particular communities and resources. This was not only done in relation to the ROW and TAPS facilities themselves, but also the analysis of potential spills and how they might affect areas downstream of spills reaching water. In other parts of the EIS, the locations of specific biological resources were shown, such as the distribution of caribou herds and the locations of streams crossing the ROW that provide habitat for anadromous fish, which spawn in fresh water but spend part of their life at sea.
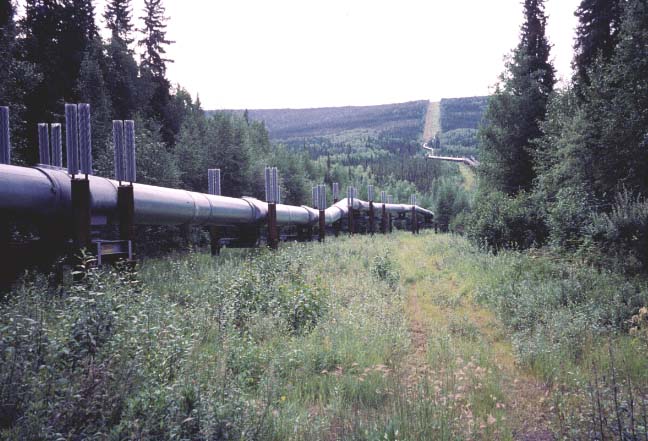
Another area with many unique issues was geology and soils. The GIS was used to visualize and examine these issues in their spatial context. The TAPS crosses a wide variety of terrains, including three mountain ranges, several intermontane basins, and an arctic coastal plain. Soil conditions vary substantially and include many permafrost areas. This required about half of the TAPS pipeline to be constructed aboveground on supports rather than being buried (Figure 3). It crosses many large and small rivers, including the Yukon River. Many of these rivers are braided, with constantly changing channels, and many have large fluctuations in seasonal flows. The pipeline crosses active seismic zones, including the Denali Fault, where support structures were designed to survive a large earthquake. Figure 4 shows the TAPS ROW symbolized with the seismic zones used in the TAPS engineering design, and superimposed on a seismic hazard map based on U.S. Geological Survey data. Glaciers exist along some sections and are as close as 0.4 miles from the ROW.
During public meetings used to help determine the scope of analyses in the EIS, one of the concerns often raised was the possibility of oil spills. Detailed analysis of potential accidents and spills was performed for the EIS. Alyeska provided estimates, based on their flow models, of the maximum volume of oil that would be spilled at particular mileposts under specific conditions. This information was mapped in the GIS by using the mileposted pipeline layer. Based on the GIS and other information, the EIS team also determined a specific set of spill scenarios that were analyzed in more detail. Information about the environment around a particular analysis location was determined from the GIS, although the level of detail was sometimes limited by the scale of the available data. For example, it was not possible to realistically model most spill scenarios in the GIS because of the lack of available spatial data. Two events during the analysis period helped underscore the importance of the spill and accident analyses and guide some of the details of the work. The first was the September 11, 2001 terrorist attacks, which led to increased emphasis on aircraft crash scenarios. The second was a spill on October 4, 2001 caused by vandalism of the pipeline. Some members of the team visited the spill site and were able to gain a greater understanding of the way spill response activities were performed.
Early in the project, ArcIMS software was used to provide access to the GIS data to Argonne staff lacking GIS software or expertise. These maps could be accessed by all team members on their desktop computers using a standard Internet browser (Figure 5). The sites were organized by scale and subject area and kept simple in terms of the interface and the number of layers presented to the user. Each site enabled the user to specify a pipeline milepost of interest and highlighted that location. This strategy of providing maps through ArcIMS had only limited success because of the size and complexity of the GIS. It was difficult to provide enough GIS layers to answer detailed questions without overwhelming the user with too many choices. In the end it was more effective for the scientists to meet directly with the GIS staff to discuss specific questions and perform analyses.
Additional spatial analysis and modeling ideas have been identified and could be added to the final draft of the EIS. Some of the possibilities include:
Most EIS documents contain maps to help clarify and illustrate the issues discussed, and the TAPS EIS was no exception. The Draft EIS contains more than 100 maps, most of which were produced with ArcMap 8.1.2. Exceptions were two map series produced by Alyeska personnel in Alaska, including a large-scale map series of the pipeline and a series of five maps showing development on the North Slope over time. This was the first large mapping project at Argonne for which we used the ArcGIS 8.x products. The software provided both benefits and limitations compared with maps made with previous Esri software versions. Benefits included:
Limitations included:
Overall, the benefits of the ArcGIS software outweighed the limitations, and the maps produced were higher in quality than we have been able to produce with earlier software versions.
The maps produced for the EIS were provided to graphic arts staff for final production. At that stage they were electronically linked to the callouts in the text and given captions and page numbers using Adobe PageMaker. Some files produced by ArcMap required post-processing in Adobe Illustrator to resolve font errors. Maps containing imagery were provided in the JPEG format to reduce file sizes. A higher level of quality for the same file size was achieved by rasterizing an ArcMap PDF file in Adobe PhotoShop than by directly exporting the JPEG file from ArcMap. The Draft EIS was produced both as a hardcopy document and as electronic files to be distributed to the public on CD and via the Internet.
The TAPS EIS was an especially interesting and challenging EIS project. Some spatial modeling and analysis ideas that were proposed early in the project could not be completed because of the complexity of the issues, the ambitious schedule, and data limitations; however, some of these approaches may be included in the final EIS. The GIS was an essential tool that helped answer many questions, increased understanding of complex issues, and communicated those issues through maps and other results. It was also a catalyst for multidisciplinary collaboration because of the ease with which GIS layers representing different disciplinary areas could be superimposed visually and manipulated. Despite the fact that many GIS layers were collected, there were still many limitations and data gaps due to many factors. The ArcGIS software, in particular ArcMap, was found to be an improved tool for cartographic production as well as for other GIS operations.
The submitted manuscript has been authored by a contractor of the U.S. Government under Contract NW-31-109-ENG-38. Accordingly, the U.S. Government retains a nonexclusive, royalty-free license to publish or reproduce the published form of this contribution, or allow others to do so, for U.S. Government purposes. This work was supported under proposal 01058 and contract 85L69 between Argonne National Laboratory and Alyeska Pipeline Service Company, Anchorage, Alaska, through U.S. Department of Energy Contract No. W-31-109-ENG-38. Special thanks are due to Marko Radonich, Ken Ambrosius, David Dempsey, and Stuart Sanchez of the Alyeska Pipeline Service Company and its contactors for their assistance in providing GIS data, maps, contacts, and other assistance throughout the project. Thanks also to Jan Stache and Ron Colnar of Argonne National Laboratory for their assistance in GIS activities.
Alaska Department of Fish and Game, 2000, Subsistence in Alaska: A Year 2000 Update, Division of Subsistence, Alaska Department of Fish and Game, Juneau, Alaska.
Alyeska Pipeline Service Company (APSC), 2001a, Trans Alaska Pipeline System Facts, Anchorage, Alaska, June.
APSC, 2001b, Design Basis Update DB-180, 3rd ed., Rev. 3, Anchorage, Alaska, February 14.
National Environmental Policy Act (NEPA), 1969, The National Environmental Policy Act of 1969, Public Law 91-190, 42 U.S. Code 4321-4347, as amended by Public Law 94-52, July 3, 1975, and Public Law 94-83, August 9, 1975.
TAPS Owners (Trans Alaska Pipeline System Owners), 2001, Environmental Report for Trans Alaska Pipeline System Right-of-Way Renewal, Draft, Anchorage, Alaska, February 15.
Wesson, R.L., et al., 1999, Probabilistic Seismic Hazard Maps of Alaska, U.S. Geological Survey Open-File Report 99-36, Denver, Colorado.
James A. Kuiper
Biogeographer / GIS Analyst
Environmental Assessment Division - 900/H03
Argonne National Laboratory
9700 South Cass Avenue
Argonne, Illinois 60439-4832
Office: (630) 252-6206
Fax: (630) 252-6090
E-mail: jkuiper@anl.gov
Joe Adduci
GIS Programmer
Environmental Assessment Division
Argonne National Laboratory
E-mail: adduci@anl.gov
Brian Cantwell
GIS Programmer
Environmental Assessment Division
Argonne National Laboratory
E-mail: bcantwell@anl.gov
Larry Gorenflo, Ph.D.
Social Scientist
Environmental Assessment Division
Argonne National Laboratory
E-mail: gorenflo@anl.gov