Object oriented data models have significantly altered how geographies are represented in a GIS. The geometry of a feature is carried as an attribute. Spatial relationships are not imbedded within the underlying data structure. This new, more abstract, data model has benefits for built environments. Leveraging object oriented data models in the context of natural environments presents real challenges.
This presentation will explore these issues in the context of the City of Seattle's Cedar River Municipal Watershed, a 91,000 acre ecological reserve that provides drinking water for over 1.2 million people in the Puget Sound region. Our strategies for transitioning to object oriented database technology and modeling the natural environment will be discussed.
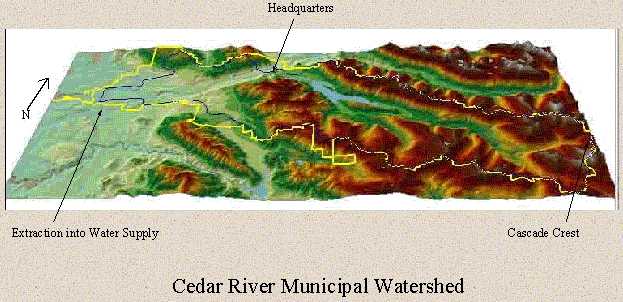
The Cedar River Watershed (Figure 1) extends from the crest of the Cascade Mountains (5,500 feet elevation) west to Landsburg (538 feet elevation) where unfiltered water from the Cedar River supplies drinking water for 1.3 million people in the Puget Sound region. The Cedar River has been the primary water supply for Seattle for over 100 years. It was 1899 when the City took ownership of much of the watershed. Land exchanges in the early 1990's completed the City's acquisition of virtually the entire hydrographic drainage of the upper Cedar River above Landsburg, covering 141 square miles.
Land management perspectives have changed dramatically over the past 100 years, as have the uses and activities allowed within the Watershed. Various options for future management of the Cedar River Watershed were put before the people of Seattle who adopted a plan that restricts all commercial logging for the next 50 years. This led to the adoption in April 2000 by the Seattle City Council of a progressive and proactive Habitat Conservation Plan (HCP) (http://www.cityofseattle.net/util/CedarRiverHCP/) for the Cedar River Watershed. Numerous stake-holders were engaged in developing this 50 year plan that allows for the incidental take of threatened and endangered species while setting clear objectives for the restoration of aquatic and terrestrial habitats. Historically, over 80% of the watershed has been commercially logged by clear cutting.
The implementation of the HCP has created a unique set of conditions and environment for the application of geographic information systems, information technology and ecology. The land is owned by the City. The area is closed to unauthorized access to protect water quality. There is a mandate to accelerate old growth conditions and to protect and enhance habitat for terrestrial and aquatic species. In addition their is a diverse, highly educated, and dedicated staff.
The explicit commitments within the HCP include but are not limited to: long term data collection; monitoring; research; establishment of baseline conditions; tracking changes through time in habitats and species; road decommissioning; acceleration of old growth characteristics in the forest; building a fish passage around the Landsburg dam; and application of adaptive management. In addition there are other aspects of work within the Division including education, operations, protection and administration. Our goal is to leverage the emerging integration of ArcGIS and more traditional IT applications to integrate all aspects of our work.
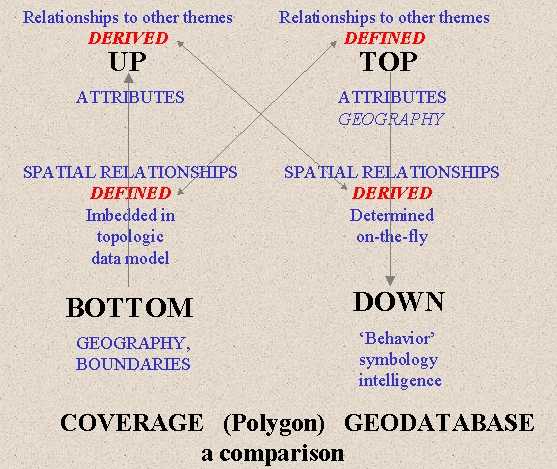
Esri's geodatabase, and the data model that it is based upon, radically change the manifestation and role of geography and topology. PIOS, the precursor to ArcInfo required that coincident lines be double digitized, or stored twice. The release of ArcInfo was based on a topological data model that explicitly stored shared geometry. In this sense, geography came first and was strictly enforced. Subsequent releases of ArcInfo added complexity to the underlying data model in order to capture a wider range of conditions and situations. For example Dynamic Segmentation separated the logical data model from the physical data model and 'Regions' allow multiple, disjoint, geographies to be considered as a single entity. But the underlying approach is the explicit embedding of topology within the data model. So it was that 'spaghetti digitizing' was born and made sense. Multiple lines that crossed over each other could be digitized and then the 'Clean' command would sort this out into discrete geometries, or polygons, each having a related row in an attribute table that describes it. So from geography came a finite set of geographies, or features, which were then assigned their descriptors. This is a bottom up development process, starting with a representation of geography that translates into geometry and records in a data table.
With the Geodatabase, all this is changed (Figure 2). Topology is not explicitly stored in the data model. Each record in a feature data set carries its own geography. The spatial representation of a feature becomes an attribute, independent of and uninformed by any other geography. This vastly different approach has significant implications. The process of database design becomes top down, especially if one is to leverage the more advanced features of ArcGIS including connectivity and relationship rules. The first step is developing an explicit and bounded set of rules and relationships. Geography has no role in the process but the geometric objects that represent geographic entities will be impacted by the modeling process. Spatial relationships are determined on the fly.
To date ArcGIS is well suited for representing networks that flow in a single direction. Networks with bidirectional flow, such as roadways, and contiguous, non-overlapping polygons, are not yet fully supported.
Concurrent with the reworking of ArcGIS to leverage high end RDMS, the Watershed Management Division is at the front end of a 50 year Habitat Conservation Plan. Our goal is to integrate information into a common framework such that a single query returns all potentially relevant information. This includes not just GIS data but all information relevant to our mission. There are many types of information that we need to deal with including historic records, documents, digital pictures, video, field observations and personnel data. Historically not all information has not been captured in a computerized form, databased or tracked. We plan to leave a better legacy for those who come after us while at the same time capturing the historic record.
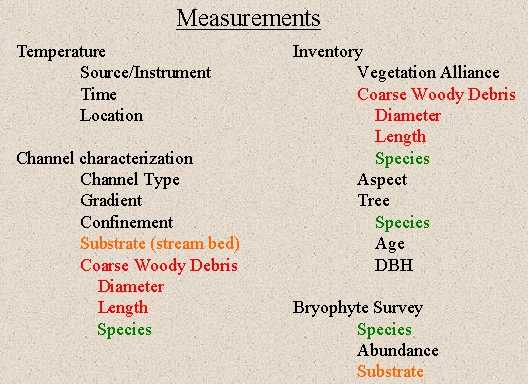
As a starting point we are engaging in use case development and UML modeling. To support these efforts we are building a common vocabulary. This includes nomenclatures, classifications, formats and protocols for data acquisition and management. This will also provide the basis for XML tags that support web based services and access to these data. The need to establish a common vocabulary is demonstrated by Figure 3. One can see in this example that the same words have different meanings that need to be made explicit. Similarly, developing agreed upon classification schemes will support data capture and retrieval over time while building a common understanding among the staff.
Tools that facilitate data entry and data access will also be critical to our success. This is do in part to the highly integrated nature of the database that is required to make it work. We anticipate using CASE tools to model and maintain much of the database. Use of these tools will not be limited to spatial databases. We also anticipate migrating everyone to Windows XP from Windows 95. This will allow us to have everyone working with a common geodatabase and move us away from shapefiles and the data management challenges their use presents. While the mantra previously has been 'every line digitized once' it is now 'every data element entered only once'. This is one of the primary benefits of the geodatabase, it unifies in a common location and in a common format all relevant data. Having spatial data that can be manipulated and accessed by a common tool suite will greatly improve data management and maintenance.
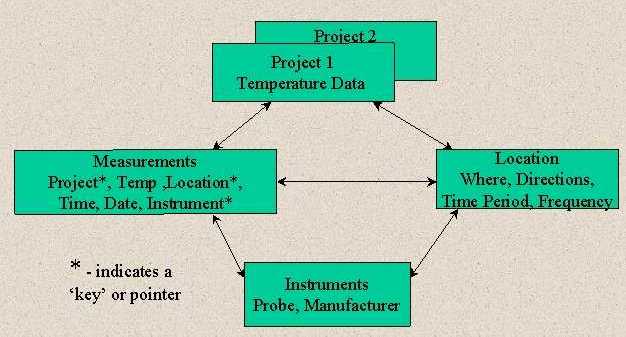
The foundation for an integrated and comprehensive system is the normalization of tables and building relationships between them. The 'delinking' of geography from a topologically structured data model facilitates this process. There are four broad categories of information that need to be related: projects; location; data; and instrumentation (Figure 4).
Constructing the database, with both spatial and non-spatial data, will be the underpinning of interfaces and applications. Location and boundaries will be captured but will be linked to attribute data through relational keys that are explicitly defined rather than embedded in the data model. Currently ArcGIS handles points and linear features but does not fully support polygons and topological operations. Raster data will continue to be used for modelling and storage of continuous data and imagery. Currently raster data is not supported with CASE tools or relationship classes.
Much of the information of concern to the Division is point data, or can be assigned to an explicit location. Conceptually this is also the simplest linking of location and a description about it. However, sampling of environmental variables actually involves a variety of sampling methods and requires a fairly complex data model. This is also an good application of the benefits and advantages of the geodatabase and related data tables.
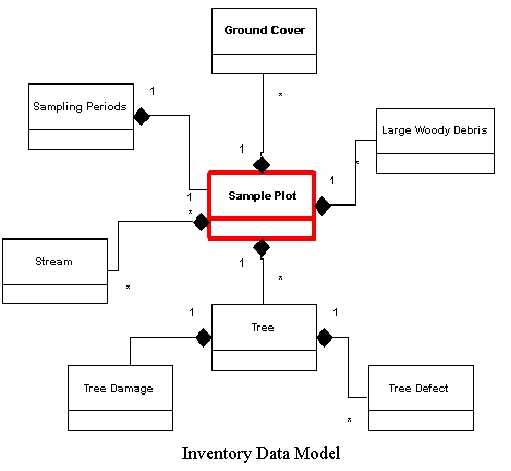
An example of this is sample plots. In order to track changes through time a set of long-term sampling locations, or permanent sample plots (PSP's), will be established. Data collected at these locations will include ground cover quadrats, line transects and variable radius circular plots. Data will be collected for a variety of spatial units. Figure 5 shows a model of sample plots and their related data tables. In this case the geography, or location of the plot center, is stored with the sample plot. This table has multiple relationships with varying cardinality. This model will not only support mapping but could be used to drive growth models and other analytical tools required by researchers
Support for linear data and linear referencing continues to mature and will be used by the Watershed Management Division. We have more miles of roads than streams within the watershed. A major commitment of the HCP is the decommissioning of roads. At the same time the roads need to be maintained. Tracking what is done, when it is done and where it is done is an important management function. We also need to model access and base decisions on multiple factors including on going field work and retention of core roads for access and potential fire suppression. Similarly the stream network, its location and condition, are of great interest. Linking field observations to their spatial location is a significant challenge. The desire is to have a tool that captures observations as events along the stream network. We anticipate further refinements in this functionality to be forth coming.
It is recommended that there be only one network per feature dataset. The implications of storing streams and roads as a single network have yet to be explored. We do want them in a common feature dataset so that culverts, roads and streams can participate in shared edits.
Points and lines are explicit representations of known entities, collection sites, infrastructure or river networks. However much natural resources information is continuous in space or best captured as polygons. What relationships might one imagine between polygons that share a common boundary? For some data the new data model, that simply carries a boundary along with a record in a data table, has some real benefits. This is the case with cutting history. A series of polygons, each of which describes the extent of a particular action at a particular time, lend themselves to this type of data model. Many other datasets are likely to remain as standalone feature classes. These include soils, lakes, wetlands, public land survey sections, land use, wetlands, habitat models, etc. It will be an interesting exercise to contemplate what types of relationships might be modeled between some of these feature classes once support for polygons is fully integrated.
The adoption and application of the geodatabase marks a significant and exciting transition in how data is managed and how it can be leveraged. Specific advantages include: SDE supports a centralized database that can be edited and is immediately updated and available, even through ArcIMS; CASE tool support provides tools and a mechanism to model and discuss very complex data models; the top down design process builds a common vocabulary and a explicit set of domains that are required for subsequent applications development.