Frances Stanley-Jones
Lead Technical Support Engineer
Tele Atlas North America, Inc.
Isabelle Hoogland
LBS Market Manager
Tele Atlas North America, Inc.
Abstract
Public safety has recently been raised to a new level of public awareness,
and the tools used for public safety applications are rapidly evolving.
This paper examines the advantages of having a highly accurate GIS to use
for public safety applications that either require or can benefit from
it (CAD, RMS, public notification systems, etc.). It will explore ways
in which a GIS can use Public Safety Answering Points (PSAP) coverage area
information and discuss geographical analyses and methods for the benefit
of those involved with public safety.
Introduction
Geographic Information Systems (GIS) are not new to the Public Safety arena. Even the visual display of digital map information has been around for many years. What is new is the integration of visual map displays with the multiple types of information valuable to the public safety user on platforms unavailable a few years ago. In general, this evolution has been fueled by the rapidly changing nature of computing, involving networking, data transfer and storage, and communication. One specific impetus is the need for agencies to display the geographic position of wireless emergency calls when the 9-1-1 caller cannot verbally give his/her location. The wireless communication industry is expanding and with it will the need for Public Safety agencies to accommodate wireless 9-1-1 calls. Given this need and the plan for many agencies to provide for it, as Bill Weaver states in (NENA News Magazine, Spring, 2001) "It would�be improvident to use this new visual information tool solely for the purpose of locating wireless 9-1-1 callers." We agree. If in the reevaluation stage of updating their systems agencies include the flexibility of even current GIS technology, they will be ahead of the game for the next evolution of technology and information management.
This paper is an exploration of possible additional data sets which, when incorporated into a visual map, can increase at a glance the information level of the persons responding to an emergency. We will explore three case studies to illustrate the possibilities of using such data. In the context of using data beyond what is currently used, we have also included a discussion of the advantages of maintaining highly accurate GIS data along with current data accuracy standards and potential testing methods. We include this because the procedures related in the case studies below are based on accurate data and could not be completed with out it. Combining data from several different sources, the basis for the GIS case studies could potentially be disastrous if the standards in data and the data itself are not maintained.
Advantages of highly accurate GIS data
The basis for any GIS is data. Software manipulates the data but what goes in incorrectly generally comes out incorrectly. For 9-1-1 call centers, emergency management and other public safety organizations, the bottom line is the accuracy of the road network. Although we wish it, no spatial map data can be perfectly accurate but levels of accuracy can be determined. There are three main areas of accuracy that we will examine: geopositional, content and connectivity.
Geopositional accuracy
Geopositional accuracy describes how closely the digital features match their real world counterparts. For geopositional accuracy the Office of Management and Budget established the Federal Geographic Data Committee (FGDC) which developed positional accuracy specifications for federal maps known as the United States National Map Accuracy Standards. The National Standard for Spatial Data Accuracy (NSSDA) provides standards and a testing methodology for positional accuracy of maps and geospatial data. In cooperation with the FGDC, the Minnesota Land Management Information Center (LMIC) prepared the Positional Accuracy Handbook: Using the National Standard for Spatial Data Accuracy to measure and report geographic data quality (October 1999) a well-defined procedure for testing and reporting map accuracy.
Content accuracy
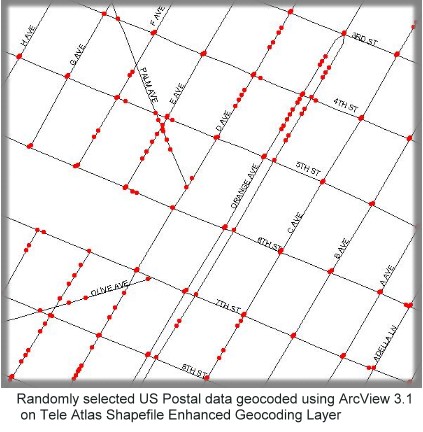
This measure describes how well the particular coverage area is described in the data. High content accuracy produces high geocoding match rates which establishes a comfortable level of confidence in the data for the user. Currently there are no specific standards to report or measure content accuracy, although the testing methods from NSSDA may be adapted to test for content somewhat. However, GIS users can employ two reasonable methods to test data, both of which are the result of geocoding addresses (matching a street address to an x,y coordinate). The first method is database matching to a qualified address database. These qualified databases � US Postal data (Illustration 1) or a PSAP�s own tabular Master Street Address Guide (MSAG) � provide the opportunity to match quality content tabular data to the digital map database.
The results can be broken down to two criteria: 1) the frequency of exact block face matches, and 2) given that it is classified as an exact match, how close is the match to the actual position of the address on the earth.
Any streets or address ranges that are not present can be checked using the second method. Verifying ground truth, the second method, also used in verifying geopositional accuracy, is the most reliable but also the most time consuming and costly. Time and money can be saved somewhat by using aids such as satellite images or aerial photos but there is no substitute for going out into the field and verifying the data. Because of the superior positional accuracy and highly accurate address ranges of the Tele Atlas MultiNet data, the interpolated value of a geocoded address at block face is also highly accurate.
Connectivity Accuracy
Connectivity relates to how well the road features connect to each other and how well the feature attributes define the relationships between features. Currently routing/pathfinding capabilities seem not to be a major focus of the local PSAP agencies but as full digital map display becomes more used and the potential of incorporating dynamic real-time data display evident, agencies will need the higher confidence level of well-connected fully attributed features. The "birds-eye view" that a digital map can give will be invaluable when trying to route emergency vehicles effectively. Note an example of this in the case study for traffic incidences in San Diego, a static map of real time traffic information.
Highly accurate spatial data is important to any GIS application and crucial to those applications in the Public Safety industry. Tele Atlas supplies both national and international data that ranks as one of the best data sources fulfilling all the criteria above. In the following case studies Tele Atlas MultiNet data is used to provide a basis for all geographical operations from geocoding to geoprocessing overlay (spatial analysis using multiple layers of various data).
Exploration of PSAP data use (Case Studies)
The following case studies display a few of the multiple applications in which a PSAP can use their GIS to give more than the location of a wireless call. They are intended as examples only and do not constitute any definitive research information. All cases are based on the coverage area of a PSAP. Most of the data used below is publicly available either for free or at very low cost. The PSAP will already have its own call history data to use for analysis as the neighborhood crime data is used.
Case 1- San Diego County�Neighborhood Crime Statistics and Demographics
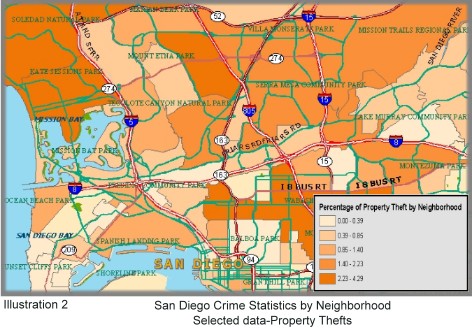
The following procedures are already being used across the country for crime incidences, however with a 9-1-1 call history it may be possible to answer questions regarding planning, preventative measures, and outreach. For example certain populations may have high proportions of inappropriate 9-1-1 calls and can be educated on appropriate calls (Illustration 2)
Data content
1. Neighborhood Crime data�San Diego Crime Statistics
2. Neighborhood boundary polygons�San Diego neighborhood polygon
layer in Shape file format (See data source reference)
3. Census demographic data�US Census Bureau
1. Tele Atlas USA road network (Santa Clara County)�Tele Atlas MultiNet
Shapefile format
2. PSAP points�Public Safety Answering point data
3. Census Place polygons�Tele Atlas MultiNet Shape layer
4. Census Block group polygons (1990)�US Census Bureau
5. Census demographic data (1990)�US Census Bureau
Case 3 Santa Diego County�Dynamic data display and use
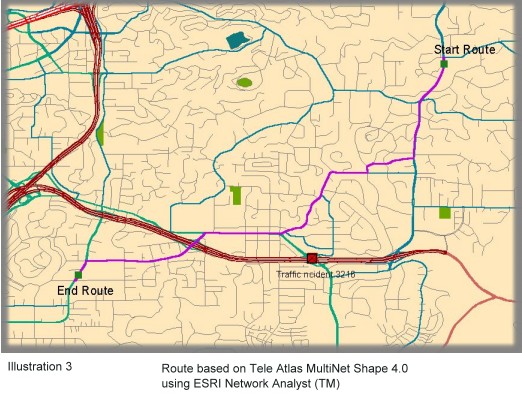
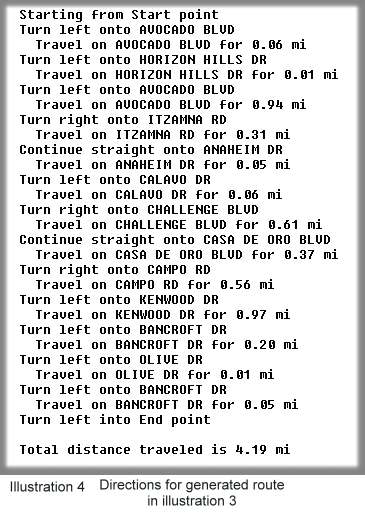
Traffic delays and stoppages can hinder the ability of emergency personnel to get to a given incident. Because traffic information is fluid the data needs to be gathered and delivered real-time to be effective. Tele Atlas in partnership with Metro Networks (a veteran in the broadcasting industry, traditionally providing traffic information to radio and television stations) has created the ability for PSAP to receive this information and incorporate it into their dispatch decision making process by making the data available in simple standard formats, for all major metropolitan areas in the U.S. The following project determined a simple method for incorporating dynamic data. Given current technology this process can be automated for speed and accuracy (Illustration 3 and 4).
1.
Tele Atlas US road Network (Santa Clara County)�Tele Atlas MultiNet Shapefile
format
2. PSAP points-San Diego subset of PSAP
3. Selection of Tele Atlas Dynamic Traffic Data
Arc View 3.2 was used for this project. The traffic incidences are incorporated into the road network based on their priority code. Subsequently the particular road segment can be removed from the possible path of any given route. PSAP polygons derived in case 2 are incorporated based on the assumption that traffic delays are not isolated and can affect several jurisdictions.Conclusion
We are an information driven society. There is an abundance of data and information available through a multitude of sources. The real challenge is in qualifying its accuracy and then defining its uses. With the need for positioning wireless calls as mandated by the FCC, spatial data will become more widely used at the PSAP level across the nation soon. Applications for these systems can and should go beyond just wireless call location. It can be used for wirelined call positioning, routing, historical call analysis, and displaying additional information helpful to the emergency response team from the dispatcher to the emergency personnel at the scene. It is the authors� hope that the information presented here will spur the reader�s thoughts as to how to define their own data uses for current and future planning.
Acknowledgments
The author would like to thank the following people for their assistance:
Diana Pell, Chief Dispatch Officer, Santa Clara Communications for her
information and insight into PSAP operations.
Patrick Kennedy, Senior Manager Technical Support\Software Quality
Assurance\Technical Documentation, Tele Atlas North America, for his support
and indulgence.
My colleagues in Technical Support, Quality Assurance and Technical
Documentation , Tele Atlas North America for their assistance.
Erik Kennelly, Senior GIS Engineer, Tele Atlas North America, Inc.
for his ideas and assistance.
References
Positional Accuracy Handbook: Using the National Standard for Spatial Data Accuracy, October 1999 (33 pages, 920K, PDF)
Weaver, Bill, Geographic Information Systems and Public Safety, NENA NEWS Magazine, Spring 2001
Data sources
Tele Atlas North America MultiNet ™ © Shapefile 1984-2002 Tele Atlas North America, Inc., Menlo Park, CA. http://www.teleatlas.com
Public Safety Answering point data, PSAP Data Resources (PDR 9-1-1) Portions of this 'DERIVED PRODUCT' contains geographic information copyrighted by PDR 9-1-1. All rights reserved
San Diego Neighborhood layer ©SanGIS Portions of this 'DERIVED PRODUCT' contains geographic information copyrighted by SanGIS. All rights reserved http://www.sangis.com/
San Diego Crime Statistics, San Diego Police Department
http://www.sannet.gov/police/stats/index.shtml
US Census Cartographic boundary files-U.S. Census Bureau, Geography Division, Cartographic Operations Branch http://www.census.gov/geo/www/cob/index.html
US Census Demographic data- U.S. Census Bureau, Public Information Office http://www.census.gov
Authors
Frances Stanley-Jones
Lead Technical Support Engineer
Specialist in Tele Atlas MultiNet Data
Shape file, MapInfo and other formats
Tele Atlas North America, Inc.
1605 Adams Drive, Menlo Park, CA 94025
Tel. 650 328-3825 ext. 1492
Fax: 650 617-0139
Frances.Stanley-Jones@na.teleatlas.com
Isabelle Hoogland
LBS Market Manager
Public Safety and Positional Services
Tele Atlas North America, Inc.
1605 Adams Drive, Menlo Park, CA 94025
Tel. 650 328-3825 ext. 2148
Isabelle.Hoogland@na.teleatlas.com