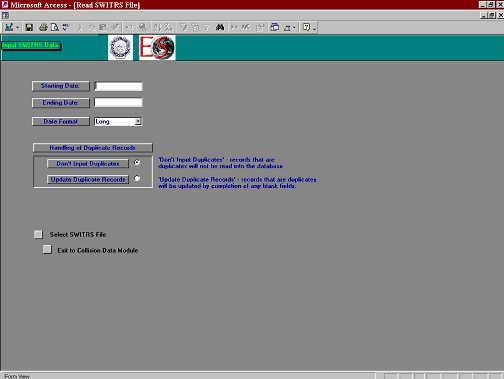
Figure 1. SWITRS Input Menu
A spatially enabled system for the management of traffic information with an objective to mitigate traffic hazards within a local government jurisdiction is described. The system involves coordinated activity between Police and Traffic Engineering Departments with reporting to the State Department of Transportation. The main components are Collision Reporting & Mapping, Archival, Analysis and Corrective Action to mitigate high-risk intersections and street segments identified by the system. Typical report formats are illustrated. The application combines data entry and report generation in Microsoft Access and spatial analysis in ArcGIS for improved traffic safety engineering and law enforcement.
In order to understand traffic accident or collision patterns, the use of statistics, charts and tabular information is common. But to spatially visualize the situation in a city, a map displaying these patterns can make a profound impact. For it is with maps one can more easily see what’s going on. Maps by nature are more intuitive than statistics, tables and even charts in understanding a spatial phenomenon. “We live in a visually oriented age, where vivid graphics and computer-generated animation are the standard. The public and many policy makers are no longer satisfied to stare at rows and columns of figures... boring data. If we are to effectively communicate our findings to our audience, we must take full advantage of our current technological resources. We must add some visual appeal to our product. GIS has the ability to transform otherwise dull statistics into attractive meaningful presentations.”
At National City an Electronic Traffic Collision Records Management System (ETCRMS) was implemented to provide a mechanism for analyzing traffic accident data collected by local police officers using the Traffic Collision Report Form 555 (California Highway Patrol). The information on the 555s is then forwarded to the CHP. The CHP in turn enters the information into a centralized database known as SWITRS, the State Wide Integrated Traffic Records System. SWITRS data is published quarterly.
The Engineering Department of National City previously collected collision reports daily from the Police Department to manually file them. No attempt was made to sort, categorize, plot or otherwise analyze the data in a systematic fashion. An earlier collision records management database failed due to software problems in 1993, and the Engineering Department was unable to restore the system’s functionality.
The inability to process and analyze collision information meant that the large amount of data acquired over the years could not be effectively utilized to support the allocation of transportation funding for programs aimed at traffic safety enhancement and collision reduction. A full understanding of traffic collision patterns in the City could not be derived. Therefore, opportunities to reduce specific types of collisions city-wide, such as those involving pedestrians, or those due to specific primary factors, such as unsafe speed, were not being practically addressed.
An effective collision tracking system would allow more effective utilization of existing traffic safety-related resources of the Police Department’s Traffic Division and the Engineering Department’s Traffic Safety Coordinator.
Specific goals and objectives were outlined for the project. They were:
Project Goals:
To provide the Police and Engineering Departments with a traffic collision data collection capability to ensure timely access to current and complete traffic related data.
To acquire the means to retrieve and analyze collision data using the system.
To be able to identify correlations between collision (type, cause) and factors (traffic controls, impairment & street conditions) and isolate critical traffic safety issues.
To be able to identify the top ten intersections and segments by collision rates.
To be able to answer requests for traffic control warrant studies or collision histories, or other collision statistics within 24 hours.
Project Objectives:
To successfully develop, as a joint effort by the Engineering and Police Departments, a geographically based Electronic Traffic Collision Records Management System.
To evaluate, customize and install the computer hardware, geographic information system platform and relational database management system software necessary for the system. The system was to be linked to the City’s proposed Local Area Network to provide access by both Engineering and Police Departments.
To provide a spatial database of the street network, including attributes of pavement type, alignment, curvature, capacity and structure; and locations of traffic control devices, including signs, signals and pavement markings; the capability to track average daily traffic volume, turning movements, posted speed limits and actual speeds as estimated by field studies.
To enable the secure and confidential exchange of data between Engineering and law enforcement agencies.
To provide the ability to update inventory records within 48 hours of a change.
To orient the appropriate personnel on system procedures and usage.
To provide a software application to provide the means for producing a current report identifying the number and severity of collisions occurring at the 10 most critical intersections.
To provide an application for producing current reports ranking collision locations (individually and generically) by attributes such as: control functions, time of day, age of driver/pedestrian, violations and primary collision factor.
To reduce report preparation time by 75%.
To promote the potential of the system to other City staff, management, City Council, commissions and the public, by scheduling demonstrations to these groups.
To provide the means to identify correlations between collisions and physical components such as roadway design, signal timing, visibility, traffic volumes, and other factors not under control of the drivers involved.
To generate and prepare standard schedules, forms and exhibits for the systematic inspection and review of traffic control devices and speed zones.
To have staff members trained in system usage and maintenance.
To ensure that the systems are installed and in full operation and to allow for the full continuance, operation and maintenance of the system by the City.
To conduct a press conference to publicize the project.
To conduct a demonstration of the system for agencies that could benefit from the system.
To conduct workshops for the City’s Traffic Safety Committee, and interested members of the public, in the operation of the system and to exhibit its applicability to traffic safety solutions.
A joint goal of the Engineering and Police Department was to have common access to an Automated Field Reporting System (essentially a simplified version of ETCRMS for laptop use). This AFR network was to serve as a node on the City’s proposed Municipal Area Network (City-wide intranet), thereby establishing the electronic linkage necessary to provide access to all map displays, geo-coded data records field reports and processed data. The proposed AFR could collect and distribute to specified client-servers detailed traffic collision reports (CHP Forms 555 including narrative fields) downloaded directly from officer’s laptops.
The implementation of the Electronic Traffic Collision Records Management System (ETCRMS) involved the collaborative efforts of the City of National City, the contractor Engineering Systems and their subcontractors, and the California Institute of Traffic Safety of San Diego State University.
Hardware (workstations & printer) and software (ArcInfo, ArcView and Microsoft Office Professional) platforms were specified and purchased. The hardware was installed onsite at the City’s Engineering Department and the software loaded onto the City’s network and computer workstations.
A third party software application by Crossroads Software, along with street centerline data from SANGIS and collision data from SWITRS were acquired. The street centerline data required cleanup.
The original third party software provided the basic functionality required of the project but required major modification of the user interface to provide a more user-friendly environment and to meet the specific requirements of the project. In addition, the City desired a system, which was based on the current version of Microsoft Access (Access 2000). It was also desired that the application could be run off of their local area network (LAN). This required redesign and customization of user interfaces (menus) and conversion and debugging of the associated programming code. Access 2000 uses Visual Basic for Applications (VBA) as its programming language, whereas Access 2.0 used Access Basic. The two programming languages are sufficiently different to involve a major effort to migrate the application from Access Basic into VBA. This meant that every module of converted VBA programming code had to be painstakingly tested for bugs. When bugs were encountered their causes were determined, analyzed and the responsible code modified. The application was also reconfigured so that it could run as a server based application on the City’s LAN, making it accessible throughout the City and maintainable as a centralized database.
In close collaboration with the City and Engineering Systems, the California Institute of Transportation Safety (CITS) provided statistical analysis of the National City collision database and prepared a report of findings and recommendations based on this analysis. A copy of this report is attached. CITS also provided feedback to assist Engineering Systems in development of the analytical capability of the software.
After installation of the ETCRMS at National City, training was provided to the City’s staff on the use of the ETCRMS and ArcView GIS software.
Press releases were made to the local media. Articles published in two of them, viz. the Star News and the San Diego Union Tribune are attached. Declaration of National City Traffic Safety Day on March 27, 2001 was made by the City Council and a presentation made to the public at the City Council Chamber and at the California Institute of Transportation Safety, San Diego State University.
The application is based on Microsoft Access 2000 as the platform for data input, queries and report generation. Collision records are stored within the Access 2000 database and customized menus provide a user-friendly interface for accessing the various modules. Schematic intersection collision diagrams are also generated within the Access application. Shapefiles (maps) are generated based on many of these queries. An ArcView interface is then utilized to view the shapefiles.
As mentioned above, the application is made up of modules. The ETCRMS is composed of two basic types of modules: 1) Input (Data entry) and 2) Query. Additional functions include generation of intersection diagrams and map files, which are available as options in many of the Query menus.
The Input Modules provide a mechanism for importing SWITRS files (for historical data) as well as manual data entry forms for entering current individual collision records.
Figure 1. SWITRS Input Menu
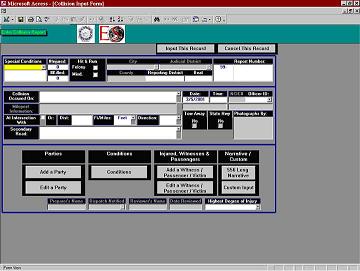
Figure 2. Manual Data Entry Form
The Query Modules provide customized forms for building queries based upon attributes in the accident database. Multiple attributes can be used as criteria for detailed analyses. For example, attributes such as primary collision factor, weather condition, location, etc. can be selected from separate drop down menu lists. Once all desired criteria are selected, the user then clicks on the Run Query button. Query results are typically displayed in a tabular format.
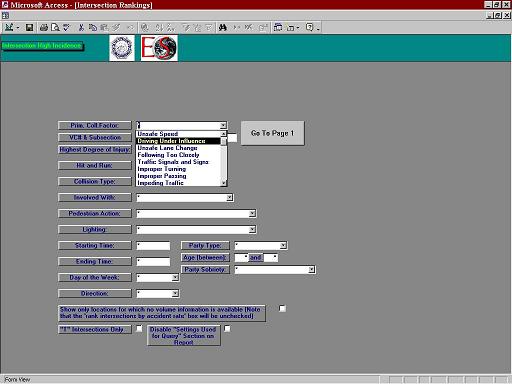
Figure 3. Query Menu
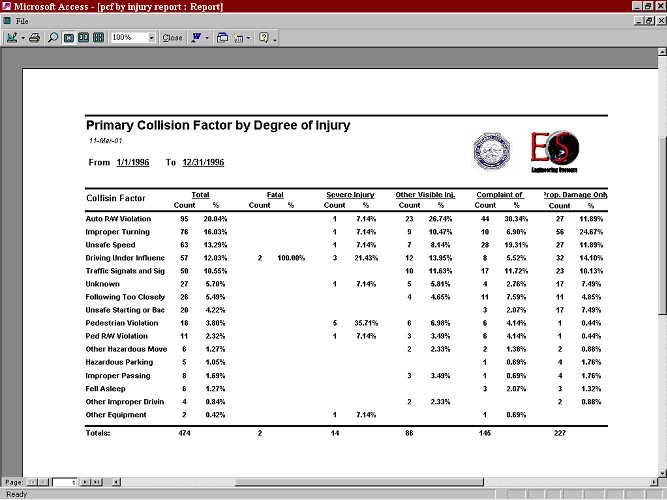
Figure 4. Query Output as a Tabular Report
A map generation function is available in many of the query menus. This appears as a check box. Once checked, the Run Query button will produce both a tabular report and an ArcView shapefile which maps out the collisions which meet the query’s criteria. Points are used to represent collisions which occur in intersections. Street segments are highlighted with graduated line widths to represent mid-block collision frequencies.
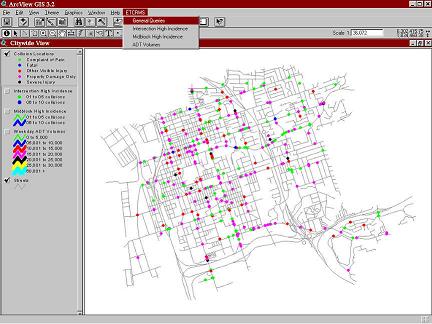
Figure 5. Query Output as an ArcView Shapefile
Another function is available for queries based on street intersections. This function allows the user to produce schematic diagrams of collisions meeting the selection criteria input by the user. A symbol set is provided to represent the various collision types and factors such as DUI, side-swipe, fatality, etc.
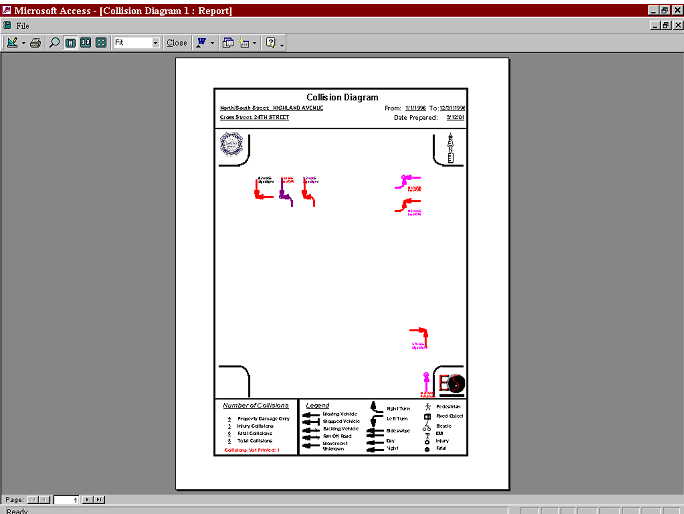
Figure 6. Query Output as an Intersection Diagram
Upon analysis of the traffic collision data for National City several high incidence intersections were identified. The ETCRMS program enables in identifying the top collision locations as well as spatially viewing the collision data. Owing to limited resources, the efforts were primarily focused on the high collision intersections. The collision diagrams generated using ETCRMS assisted in the field observations were made along with recommended mitigation measures for these intersections.
Plaza Boulevard/Highland Avenue Highland Avenue/18th Street Highland Avenue/24th Street Harbison Avenue/8th Street Palm Avenue/8th Street National City Boulevard/Division Street/Roosevelt Avenue
Excerpts from some of the engineering evaluations are included below:
The general characteristics of the intersection of Highland Avenue and Plaza Boulevard are described in the condition diagram and photos above. This intersection is controlled by an 8-phase traffic signal with protected left turns in each direction. Plaza Street runs in an east-west direction and is about 64 feet wide with an ADT of about 20,000 to 27,000. Highland Avenue is the north-south street and is also 64 feet wide with an ADT of about 19,000 and has a downward grade in the southbound direction. Based on the street width and on a walking rate of 4 ft/sec, the total time for the pedestrian phase should be about 16 seconds. The field check found that the actual time was about 18 seconds. U-turns are prohibited in all directions. Crosswalks exist on all 4 legs but the paint had faded. Based on the collision data from the City (see attachment) a total of 48 collisions were reported during the 7 year period from 1993 to 1999 of which 21 (44%) were of the broadside type, 10 were rear-end collisions (21%) and 3 involved a vehicle and a pedestrian (6). The collision diagram above shows one collision involving a vehicle-pedestrian and another involving a vehicle-bicycle. During the field observations, several red light violations were noted.
It is recommended that the City repaint all of the crosswalks and pavement markings at this intersection either as part of the maintenance schedule or as part of any resurfacing plans. City consider increasing the width of the existing crosswalk at the north leg of Highland Avenue by about 5 or 6 feet to provide greater stopping distance. Also, it is suggested that an advance RIGHT TURN ONLY sign northbound on Highland Avenue. Signal timing needs to be evaluated.
A description of this intersection is shown in the condition diagram. This intersection is controlled by 2-phase traffic signal with new pedestrian push buttons. Yellow school crosswalks are located at all legs of the intersection but need to be repainted. Highland Avenue is 64 feet wide and u-turns are permitted 24th Street is 64 feet wide on the west side but narrows to 40 feet on the east side of the intersections. A check of the total pedestrian signal time assigned to the intersection showed that an average of 23 seconds are allowed for crossings on Highland Avenue and on both sides of 24th Street. Based on a walking speed of 4 ft/sec, the time would normally be 16 seconds on Highland Avenue, the west side of 24th Street and 10 seconds on the east side of 24th Street. Thus, the actual existing time assigned to pedestrians at this intersection is adequate. A total of 47 collisions were reported during the 7 year period from 1993 to 1999 of which 22 (48%) were of the broadside type and 11 (23%) were head-on types. Two vehicle-pedestrian collisions were also reported.
Due to the high number and percent of broadside and head-on collisions at this intersection, it is recommended that the City consider converting the 2-phase signal to an 8-phase operation with protected left turns. A complete traffic engineering study should be conducted as soon as possible to analyze traffic conflicts and identify the additional mitigation measures. The school crosswalks need to be repainted. Increased enforcement when school children are present is recommended.
This intersection is controlled by a relatively new traffic signal installation with long mast-arms on all approaches. Left turn yield signs are mounted on all mast-arms. 8th Street is 64 feet wide. Harbison Avenue on the south side is 64 feet wide but narrows to 40 feet on the north side. This intersection is located approximately at the crest of hilly terrain. Moderate uphill grades are located on 8th Street east and west of the intersection as well as on Harbison Avenue south of the intersection as shown in the photos. Due to the hilly terrain, sight distance is partially restricted between westbound vehicles turning left vs. eastbound through vehicles and, to a lesser degree, between southbound vehicles turning left and northbound through vehicles. According to the City, the long mast-arms were installed in anticipation of converting the existing 2 phase signal to multi-phase operation with protected left turns. A total of 32 collisions were reported during the 7 year period from 1993 to 1997 of which 22 (69%) were of the broadside type. No vehicle-pedestrian collisions were reported.
Convert the existing signal to an 8 phase operation with protected left turns.
The end result of this effort is a repository of collision data that is now a usable and accessible resource, whereas the previous storage method was essentially a file cabinet. The Electronic Traffic Collision Records Management System (ETCRMS) is an updateable database of collision records linked to a Geographic Information System (GIS). In addition, as a network based application it is accessible and maintainable as a centralized database. The built-in query and reporting routines and GIS linkages provide for a powerful tool that not only improves efficiency but also could save lives.
The potential exists for incorporating handheld or police vehicle mounted GPS units to enhance the accuracy of positional information gathered during accident reporting in the field.
Another improvement would require the promotion of more efficient reporting methods between local police jurisdictions and the California Highway Patrol so as to eliminate redundant data entry at both ends. The use of an electronic system instead of paper submissions of collision reports (Form 555) by the local police departments to the CHP would greatly streamline the process.
Online Internet or intranet access to a collision database similar to the ETCRMS has been demonstrated on a statewide basis.4 This could conceivably be implemented at the city level and would have obvious accessibility advantages over a system installed on a local area network, such as the ETCRMS.
The possibility of including the State of California in the CODES project could be investigated. The CODES project is a data-driven project which is funded by the U.S. Department of Transportation, National Highway Traffic Safety Administration. CODES involves the linkage and analysis of police crash data, emergency medical services transport data, hospital data, and insurance claims. CODES data often contain location information such as County, Census Tract, Police Beat, street or roadway name, street address, distance from a milepost or nearest intersection or references to other geographic features and place names.6 Not only could this benefit the State but reporting of CODES data in a standardized format would be useful for comparisons between states, to simplify and foster dissemination of data within states, to target specific areas for planning and research, and to promote a national report of CODES outcome data.
This project is part of the California Traffic Safety Program and was made possible through the support of the California Office of Traffic Safety Program, State of California, and the National Highway Traffic Administration.
We would like to acknowledge:
Leonardo Pimentel, Programmer, Engineering Systems: provided technical support for database migration and debugging of programming code.
Jeff Cullen, Crossroads Software: provided a base software package and database modification services on the Access 2.0 platform.
The opinions, findings, and conclusions expressed in this publication are those of the authors and not necessarily those of the State of California, the National Highway Traffic Safety Administration, or the Federal Highway Administration.
1. Baig, Mirza Rizwan; Wasserman, Melvyn; Caruth, David, 2000. “GIS-Based Accident Analysis and Mitigation System”, Electronic Proceedings of the 26th International Forum on Traffic Records and Highway Information Systems. http://www.traffic-records.org/forum2000/S_34/Rizwan/paper.pdf
2. Graettinger, Andrew; Rushing, Timothy; McFadden, John; Gibson, David, 2000. “Improving Crash Location, Display, And Analysis By Combining GPS And GIS”, Technologies International Forum On Traffic Records And Highway Information Systems Session #37 GIS / GPS Influence on Records Part II http://www.atsip.org/forum2000/S_37/Graettinger/paper.pdf
3. Kim, Karl; Kerns, Tim; Hettinger, Tom; Pease, Mary; Johnson, Sandra; Utter, Dennis, 2001 “Geographic Information Systems Using CODES Linked Data (Crash Outcome Data Evaluation System)”, U.S. Department of Transportation, National Highway Traffic Safety Administration, NHTSA Report No. DOT HS 809 201, April 2001 http://www-nrd.nhtsa.dot.gov/pdf/nrd-30/NCSA/CODES/FinalVe1.pdf
4. Brown, David B., PhD, PE, 2000. “Information Mining With CARE” (Critical Analysis Reporting Environment), Presented at: Annual National Safety Council Traffic Records and Safety Information Systems Forum http://www.traffic-records.org/forum2000/S_27/Brown/Paper.pdf
5. Finison, Karl S., 2000. “Standardized Reporting Using CODES (Crash Outcome Data Evaluation System)”, U.S. Department of Transportation, National Highway Traffic Safety Administration, NHTSA Report No. DOT HS 808 048, April 2000 http://www-nrd.nhtsa.dot.gov/pdf/nrd-30/NCSA/CODES/809-048.pdf
6. WEB SITE - National Center for Statistics & Analysis, U.S. Department of Transportation, National Highway Traffic Safety Administration http://www-nrd.nhtsa.dot.gov/departments/nrd-30/ncsa/codes.html