ABSTRACT
This Web site (http://shiptracker.noaa.gov
) provides graphical plots illustrating the current location of various
ships in the NOAA fleet and the latest detailed weather and ocean conditions
received from each ship. The site utilizes ArcIMS to generate the maps
displayed on the site in near real time. Messages are sent automatically
by the Shipboard Computer System (SCS) on NOAA vessels. The messages reach
a server at PMEL through e-mail. From there, these messages are processed
and the data are uploaded into a central database. Periodically the process
examines the database for new information and regenerates the images displayed
on the Web site as appropriate. The ships' locations are presented on an
acetate layer overlaying an image service showing bathymetric and topographic
data. The service was implemented using Java. It communicates
with the ArcIMS map service through HTTP requests written in Extensible
Markup Language (XML). The Web site itself is a combination of static HTML
pages, images updated by the map service, and JavaServer Pages (JSP) for
the interactive portions of the site.
NOAA maintains a fleet of
research vessels in both the Pacific and Atlantic Oceans. These vessels
conduct a variety of types of research and are used by multiple projects.
Knowing where the vessels are working and the environmental conditions
they are experiencing is vital both for the scientists using the vessels
and for the family and friends of the ships' crews. Creation of an
ArcIMS based web site allows for the display of scientific data and general
information about the ships' locations and working conditions. This
project required development of tools to get near real-time display of
tracked items (in this case a ship) into a GIS to allow for display, analysis
and rapid generation of web pages. The methods developed for the ShipTracker
pages are being applied to other tracked entities - such as marine buoys
and instrumented marine mammals.
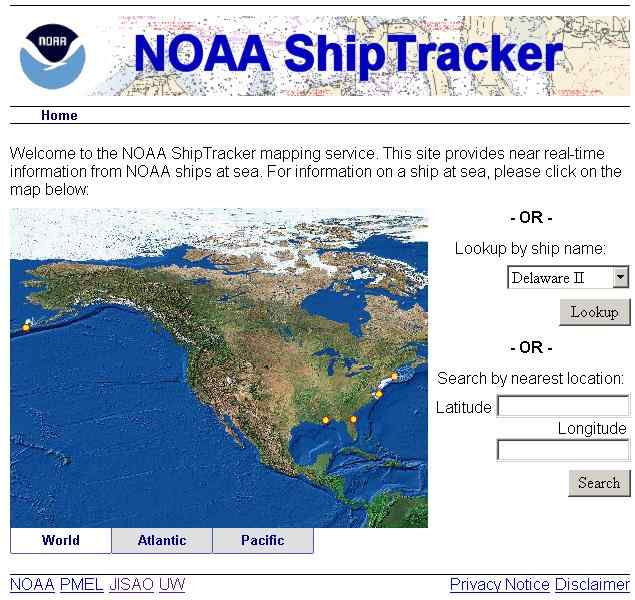
The ShipTracker page (http://shiptracker.noaa.gov)
displays the location of all of the ships in the fleet and allows a user
to select a specific ship by name or an area of the ocean by latitude/longitude.
The user can also click on the map to select a ship and be taken to the
ship-specific page.
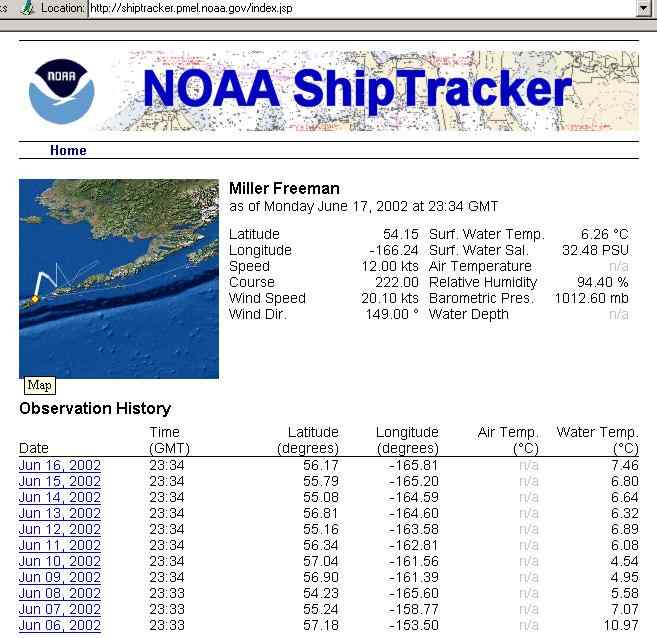
The summary page for
a specific ship shows a detailed map of the ship's location and recent
trackline. The width and color of the trackline decreases with older
obervations, making it easy to see where the ship has been. The page
also displays a summary of the current environmental conditions as measured
by the ship's instruments. This summary can be changed depending
on the needs of the research project currently using the ship. Project
specific data could also be added to the data stream sent in by the ship.
Shipboard computing
The Scientific Computer
System (SCS) software was developed by OMAO specifically for the NOAA fleet.
SCS is a data acquisition and processing system designed for oceanographic
and fisheries applications. SCS is networked throughout the ship
and is capable of sending data displays to remote stations (SCS NT Client)
on the ship. In addition, ASCII data strings can be sent via RS-232
cable or over the Ethernet. SCS can be configured to generate a “current
conditions” message giving values of selected sensors at a user-selected
interval. SCS data are sent to shore in an email message. The
ship transmits email to shore two or three times a day via Inmarsat or
Cell phone. Mail is packaged up and sent as a single file and the
messages are unpacked on shore and transmitted to addressees. Another
standard system, SEAS, provides a backup system for delivering data about
current conditions.
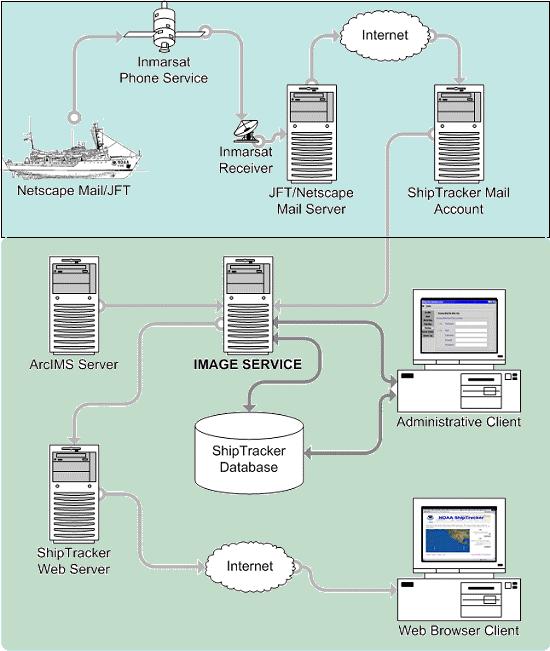
Shore-based processing
Once the "current
conditions" data are transmitted to shore they are added to a MySQL database
configured for storage of data from ships. The database is housed
on a UNIX machine. MySQL was chosen for its ease of configuration
and the fact that the database is free. Duplicate and spurious entries
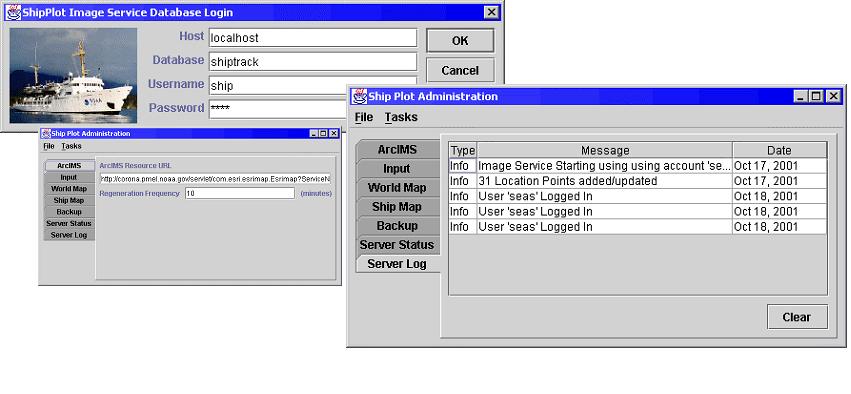
are detected in the loading process. Configuration parameters for
the image service are also stored here and there is a Java-based GUI front-end
for administration.
Internet Map Server
For generating the maps in
the web pages we rely on ArcIMS3.1 running on a UNIX box. The base
maps of the image service are generated from topography/bathymetry data
stored as shapefiles Ship locations are added as an acetate overlay
with the sizing of the maps based on the location of the ships. Use
of the acetate layer allowed us to generate a dynamic view that could be
easily updated each time a ship reported new position information.
XML and ArcXML are used for creation and return of map images and the images
are regenerated each time new data are received. Images created include
an overview image and ship specific zoomed-in images. The administration
tools are used to set update frequency, file storage locations etc.
The server administration is also Java-based and is similar to the
GUI front-end for database configuration. The web server and web
pages are a 2-tier system which connects to the MySQL database to retrieve
ship observations. The web page selects the ship for display based
on user input. The web pages are hosted on an Apache Tomcat server
and the pages themselves are a mixture of JSP pages, static HTML pages
and images created by the Map Server.
Enhancements
Planned enhancements to ShipTracker
include the ability to select the time period for the display of historical
data, the ability to zoom the area displayed and to add features such as
the ship's expected trackline (from a shapefile). We are also looking
at using the database and display tools we have developed to provide real-time
maps of the location of tagged marine mammals and also to display data
from moored and drifting buoys.
Acknowledgments
Many individuals have contributed ideas, effort and data to this project. They include the various electronics technicians onboard the ships who have kept the daily reports arriving, Nazila Merati for web page design advice/technical support and OMAO management for continuing support of the project. Everyone's contributions have been vital to the project.
This project has been funded in part by a grant from the NOAA High Performance
Computing and Communication - Visualization Initiative (http://www.hpcc.noaa.gov/visual.html)
References
For more information about the Pacific Marine Environmental Laboratory, please visit the PMEL home page at http://www.pmel.noaa.gov
For more information about the NOAA Fleet and the Office of Marine and
Aircraft Operations, please visit the OMAO homepage at http://www.moc.noaa.gov/
Primary Author Information
Tiffany C. Vance, Computer Specialist
National Oceanic and Atmospheric Administration
Formerly with: Pacific Marine Environmental Laboratory
Now with: Alaska Fisheries Science Center
7600 Sand Point Way NE
Seattle, Washington 98115
Telephone: 206-526-6767
Email: Tiffany.C.Vance@noaa.gov