An Integrated Data Management System for Environmental and Geospatial Data
Jerry L.Dunn
Michael E. Klausmeier
Abstract
The Environmental and Geographical Information System (EGIS) is a complete and integrated data management system designed for a scalable architecture that can be deployed for a single user or a client/server enterprise system. The environmental data is housed in a relational database structure with governing valid value tables that is patterned after the Air Force Wide-Environmental Resource Program Information Management System (AFW-ERPIMS 98). The geodatabase model is designed from the Spatial Data Standards for Facilities, Infrastructure and Environment (SDSFIE). Basemap and environmental geospatial data was loaded and served up on a SQL Server database with the ArcSDE 8.1. A set of data management procedures and rules was developed for data management and validation. An integrated set of software tools was developed for project data management, data input and validation (QA/QC) and data query utilizing ODBC SQL, MapObjects, ArcIMS, Arc/Info and ArcView. Consolidating vast amounts of diverse historical data into the system was a problem. A number of mapping templates and SQL routines was developed for converting data from different formats including ERPIMS, IRDIMS, EQuIS and GISKey. EGIS has been developed and implemented in a number of U.S. Army sites including a RCRA site with over 2 million chemical records and a CERCLA Superfund site with approximately 2 hundred thousand records.
Introduction
One responsibility of the U.S. Government is promulgation of standards, regulations and guidelines for the exchange of goods and services. Collection and communication of data is a service provided by both the Government and private industry. GIS has been used industry-wide for data exchange and communication when the data users benefit from associating geographic location information to the data. This paper addresses the uses of an environmental GIS, the utility of the promulgated standards and guidelines, and the continuing need to adopt a certain level of standards across the environmental industry and other industries that are dependent on data for decision-making.
The Environmental Database
The EGIS environmental database is a relational database design for storing data in separate, interrelated tables. Table and record relationships are maintained by using common fields within the tables. Essentially there are no built-in relationships that need to be supported by the particular database software, only key fields. This allows one to build their database on different platforms and scale their system from a local workstation using Microsoft Access to a large client/server system using Microsoft Server SQL or Oracle databases.
The EGIS database is patterned after the Air Force Wide-Environmental Resources Program Information Management System (AFW-ERPIMS 98). There are two major reasons for adopting this design. The ERPIMS data structure has been implemented in a wide variety of sites and most of the major environmental contractors are familiar with ERPIMS. By utilizing the same or similar data types and structures, there can be a better understanding of the data and communication between the different parties using the data. There are many examples of home-grown database dictionaries which are proprietary and not always well defined and described. This causes problems for the user in interpreting the data and almost always presents problems when one tries to analyze or compare data from two different sources with different data definitions. A second major reason for adopting this design is the straightforward way that ERPIMS data can be converted to the EGIS format. By design, table and field definitions are closely compatible with ERPIMS wherein electronic data in the ERPIMS format can easily be uploaded to an EGIS database. When a contractor or laboratory has had experience collecting, analyzing and storing data in the ERPIMS format, they can utilize the same data management procedures for data to be entered into EGIS.
ERPIMS has been modified to incorporate a range of additional environmental data. Among these new tables and are elements to accommodate the reporting of greater well construction and lithology detail including a table to incorporate well maintenance data. Further, a regulatory limits table has been added and maintained which contains current Risk Based Concentrations (RBC) from EPA Region III and other concentration limits from EPA and NOAA. Other tables for storing data about meteorology, air quality, ordnance and surface water have been added which are routinely collected during environmental studies. Example applications using the EGIS database will be provided later in the paper.
The Geospatial Database
A Geographic Information System (GIS) is used to store and retrieve data, perform data analysis, and visualize both the data and the results of the data analysis in two-dimensional layers that provide insight into the implications of the data. In the following application, GIS supports formulation of a conceptual site model, evaluation of the hazard distribution, communication of the findings, and evaluation of projected present and future use scenarios. Many valuable analysis and visualization algorithms are available as standard tools in Esri software.
A site’s GIS data is organized and attributed according to the Spatial Data Standard for Facilities, Infrastructure and Environment (SDSFIE) developed by the CADD/GIS Technology Center. The data is stored in a personal geodatabase or a client-server ArcSDE geodatabase. The Center has developed a template from existing SDSFIE data and a personal geodatabase generator tool.
SDSFIE provides a standardized grouping of geographically referenced (i.e., geospatial) features (i.e., real-world features or objects depicted graphically on a map at their real-world location (i.e., coordinates). Each geospatial feature has an "attached" attribute table containing pertinent data about the geospatial feature. SDSFIE was approved by the National Committee for Information Technology Standards (NCITS) on November 15, 2001 as an ANSI standard. NCITS 353 provides a common standard for the collection and storage of geographic data using GIS technology.
The benefits of using SDSFIE include:
- Standard GIS Data Collection Requirements
- One Training Program
- Common GIS Software Applications
- Standard Implementation Procedures and Requirements
- Common Data Model which Permits the Sharing of Data
- Nonproprietary Data Model (SDSFIE & NCITS 353)
SDSFIE is the only "nonproprietary" GIS standard designed for use with the predominant commercially available off-the-shelf GIS and CADD (e.g., Esri ArcInfo and ArcView; Intergraph MGE and GeoMedia; AutoDesk AutoCAD, Map and World; and Bentley MicroStation and GeoGraphics), and relational database software (e.g., Oracle and Microsoft Access). This nonproprietary design, in conjunction with its universal coverage, has propelled the SDSFIE into the standard for GIS implementations throughout the Department of Defense (DoD), as well as the de facto standard for GIS implementations in other Federal, State, and local government organizations; public utilities; and private industry throughout the United States and the World. SDSFIE is distributed via CD-ROM and the Internet (http://tsc.wes.army.mil).
Formulation of the Conceptual Site Model (Problem Formulation)
The Environmental Protection Agency recommends formulation of a conceptual site model (CSM) early in the environmental restoration process. The CSM is a three-dimensional picture of site conditions that illustrates contaminant distributions, release mechanisms, exposure pathways and migration routes, and potential receptors. The CSM documents current site conditions, and is supported by maps, cross sections, and site diagrams that illustrate human and environmental exposure through contaminant release and migration to potential receptors. (EPA, 1996) The CSM is a valuable tool that can be adopted at any point in the restoration process through long term monitoring.
WNDGIS was developed to bridge the gap between some of the standard Esri analysis and visualization tools and the routine data analysis and visualizations typically performed on environmental projects but not readily accomplished using off the shelf Esri software. WNDGIS also serves as an application programmer interface (API) to link the various data analysis and visualization tools.
Many of the database tables support the CSM. The tables include the borehead table, borelith table, location table, waterelev, wellcomp and wellint tables. The location table contains the horizontal and vertical information about each unique sampling location. Each unique location is defined by a unique locid.
Stratigraphic Visualization
The borehead and borelith tables contain the stratigraphic information used to generate boring logs and stratigraphic cross sections. WNDGIS is unique because it queries the database directly based on selection of a locid by the user on a basemap and generates the selected visualization. WNDGIS queries include a selection to open an SQL window and perform interactive queries, borelog queries, well construction queries, water level queries, and cross section queries. Figure 1 depicts a borelog generated by selecting the boring log query in WNDGIS and then selecting the unique locid on the displayed map.
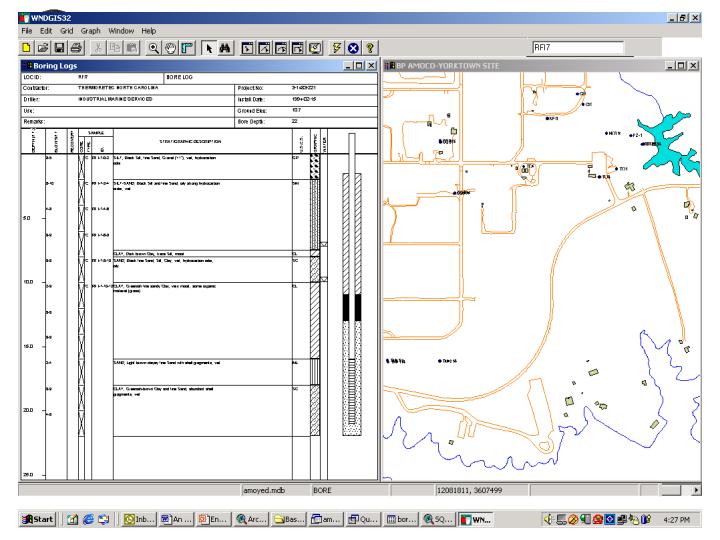
Figure 1. Results of Boring Log Query
The advantage of this approach is that data is obtained directly from the database and visualizations do not have to be generated from unique files with special formatting requirements. The latter approach lends itself to transcription errors and administration complexities due to the maintenance of a large number of unique files and file formats limited to specialized applications and software. Another tremendous disadvantage is the inability to easily perform quality control checks on the latter file types.
The boring logs depict all of the information contained in the database (which can be extensive). The boring logs can be printed for reporting which eliminates the need for a specialized boring log generation program. Another unique feature of WNDGIS is the ability to superimpose the well construction diagrams adjacent to the boring logs to readily determine the type of material surrounding the well screen.
A similar approach that supports CSM development is generation of stratigraphic cross sections. The user draws a line on the map after selecting the cross section query and instructing the program on the type of fill material to use for the cross section intervals. Cross sections are generated from grids built in 3-D Analyst, GMS or Earth Vision. A cross section is depicted in Figure 2. Figure 2 also shows the core lithology and USCS codes for borelogs along the transect. Another view can draw the location of the well screens and well risers for wells along the transect. Additional layers can be added that depict contaminant concentrations and the location of the potentiometric surface.
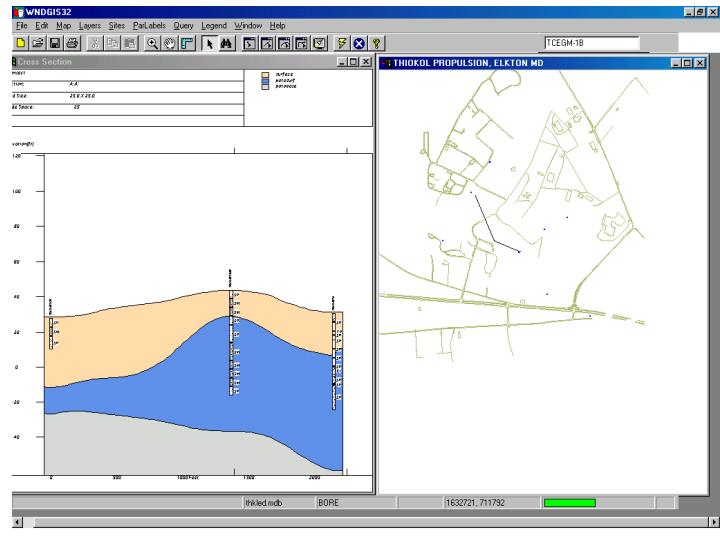
Figure 2. Stratigraphic Cross Section
Visualization of Site Hydrology
Monitoring well construction diagrams are generated directly from the database. The information used to developed the diagrams is taken from the wellcomp and wellint tables. The diagrams can be printed for hardcopy reporting similar to the boring log diagrams described above. Water level trends are also extracted directly from the database. The water level information is recorded in the waterelev table. Water level trend information is depicted in Figure 3.
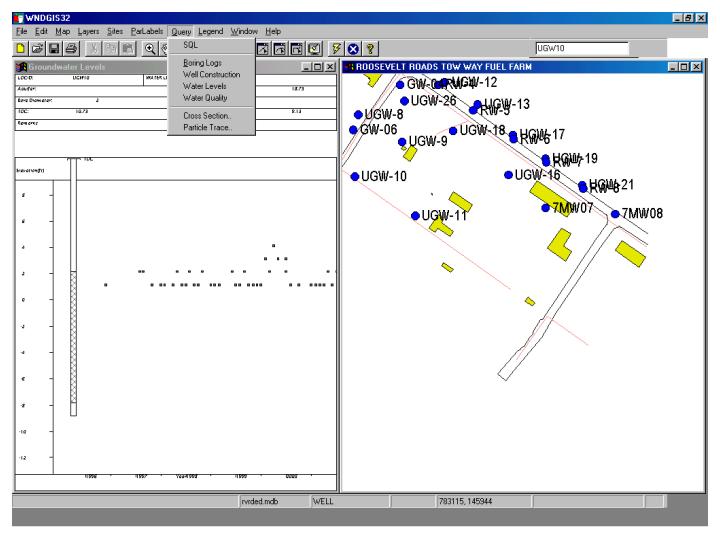
Figure 3. Water Level Depictions in WndGIS
Water level information can also be taken from the database and interpolated using 3-D analyst. The interpolation can be visualized as water level contours which can be saved as a shapefile in ArcView and visualized in any program capable of reading ArcView shapefiles. WNDGIS can import ArcView shapefiles.
Evaluation of the Hazard Distribution
Hazards that are easily analyzed and visualized using the database include chemical hazards, ordnance hazards and hazards resulting from oil spills.
Chemical Hazards
Environmental sampling information is recorded in the fieldmeas and sample tables in the database. Field measurement information, e.g. dissolved oxygen, is recorded in the fieldmeas table and can be extracted and contoured or plotted as a trend to visualize the spatial and temporal impacts on dissolved oxygen concentrations. Results of the laboratory analysis can be delivered in an ERPIMS format a quickly placed in the database using some simple structured query language (SQL) queries. Once the data has been placed in the database it can be compared to regulatory screening criteria (e.g. RBCs, MCLs, PRGs) by comparing the data in the results table to information contained in the reglimits table. An example query and the query results depicted in WNDGIS are provided in the textbox and Figure 4 below.
|
SELECT a.locid, a.logdate, a.matrix, a.topdepth, a.botdepth, a.casno, b.name, a.parvalue, a.units, a.dilution, a.dqflag, b.parvalue AS c_parvalue, b.units AS c_units, b.basis INTO GW_XC FROM GW_DET AS a, reglimits AS b WHERE a.casno = b.casno and b.pathway = 'TAPW' and a.parvalue > b.parvalue and a.units = b.units;
|
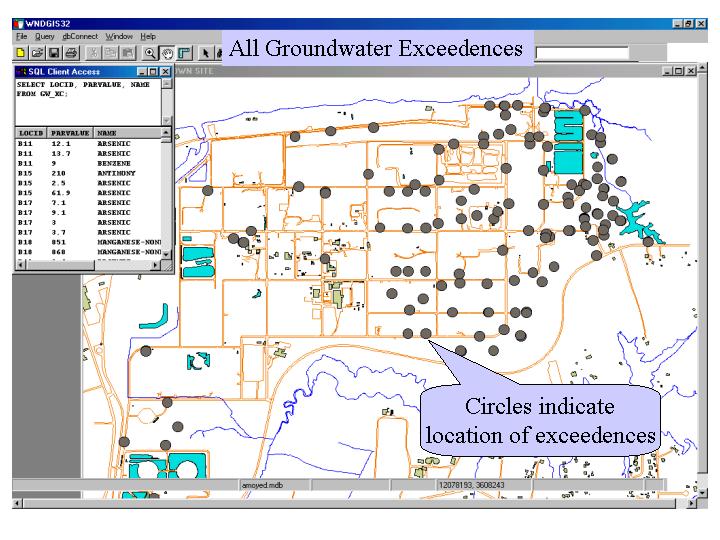
Figure 4. Groundwater Exceedence Results
Ordnance Hazards
Ordnance hazards can be handled in a similar fashion. Tables were imbedded into the ERPIMS database to take advantage of the multitude of ways ordnance impacts the environment. The ordnance tables were slightly different because fields were added to hyperlink to technical manual information and photographs. An example of a database query displayed in ArcView is provided in Figure 5. The 70mm photograph in the figure was hyperlinked to the corresponding Army technical manual information.
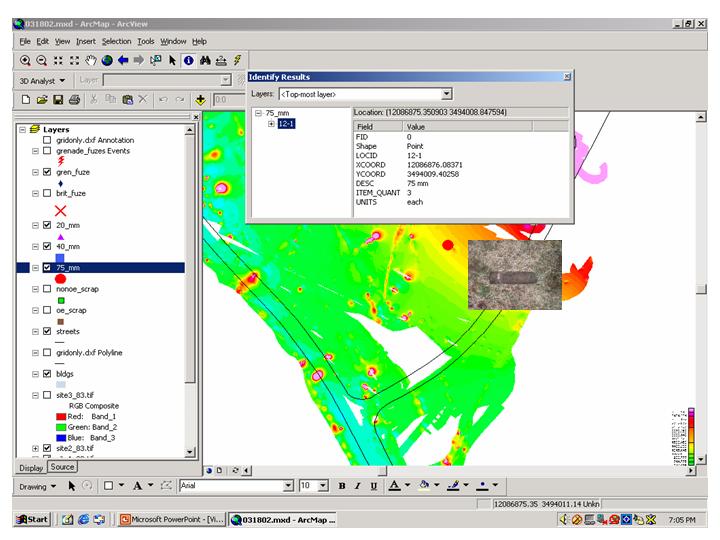
Figure 5. Ordnance Information
Since the database allows entry of each specific ordnance type, each type can be symbolized differently and depicted in ArcView as different shapefiles. This allows visualization of the distribution of recovered ordnance by type at any map scale.
LNAPL Hazards
Light non-aqueous phase liquids may or may not be considered as hazards under the Comprehensive Environmental Response, Compensation and Recovery Act (CERCLA). However, when it is being investigated under CERCLA the authors have encountered numerous instances when reputable firms have reported zero thickness when LNAPL was present. Zero thickness was reported because the well was not screened across the water table and free product was not allowed to enter the well. In some instances the erroneous zero thickness information was used to generate free product plumes for reports. The query used to check for improperly screened wells is provided in the text box below.
|
SELECT a.locid, a.logdate, a.waterelev, (c.grndelev - b.topdepth) AS scrntop, a.ftccode INTO WTGTSCRN FROM waterelev AS a, wellint AS b, wellcomp AS c
WHERE a.locid = b.locid and b.locid = c.locid and b.clacode = 'scrn' and a.waterelev > scrntop and c.grndelev <> NULL;
|
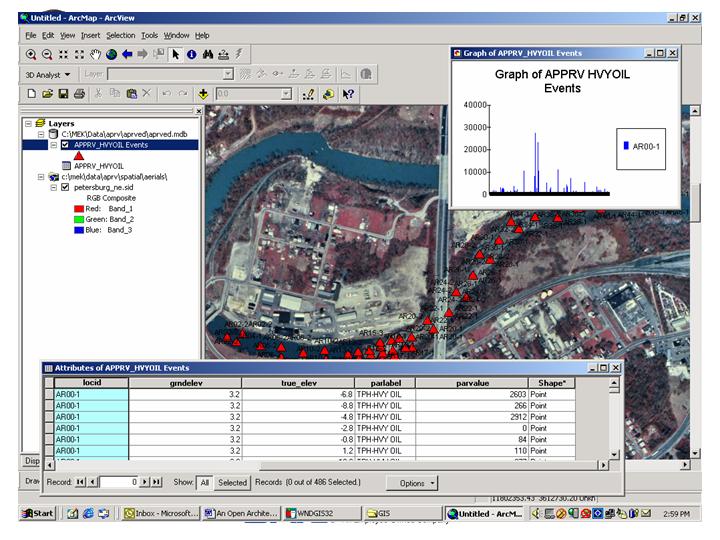
Figure 6. Graph of Heavy Oil Concentrations
Evaluation of Statistical Properties
Data analysis always requires plotting and analyzing the data to evaluate the central tendency, whether the data is normally distributed, and check for the presence of outliers. Using the database with Geostatistical Analyst and a working knowledge of statistics allows the user to evaluate the statistical properties rapidly. Figure 6 depicts a graph of the range of heavy oil concentrations generated by simply clicking in the data in ArcView and selecting graph. Figure 7 depicts the statistical distribution of Arsenic and some of the other statistical properties obtained by linking the arsenic data in the database to Geostatistical Analyst.
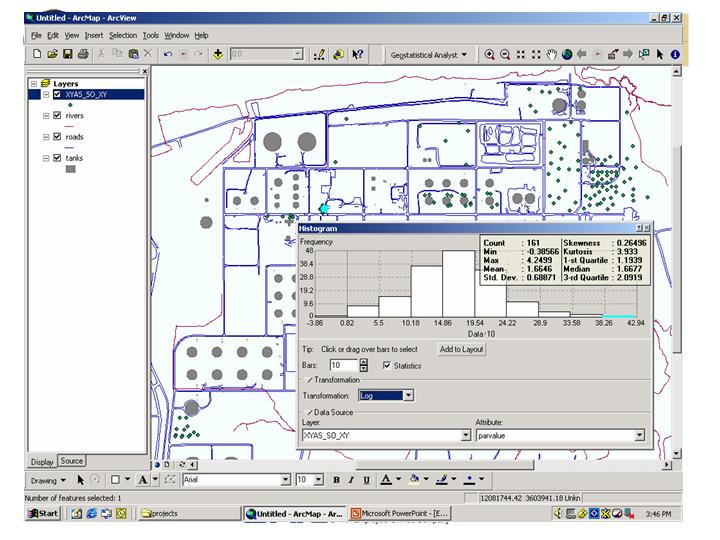
Figure 7. Evaluation of Arsenic Statistical Properties
References
U.S. EPA 1996, Soil Screening Guidance: User’s Guide. Publication 9355.4-23.
Jerry Dunn
Environmental Database Manager
DPRA, Inc.
Michael E. Klausmeier
Principal Engineer
Micropact Engineering