GIS in Orange County Vector Control District
Maria A. Diuk-Wasser
Abstract
This paper describes the use of GIS as a vector control management tool
for Orange County Vector Control District (OCVCD), as a result of a collaboration
with of the University of California, Los Angeles. The GIS integrates current
and past vector surveillance and control information with Orange County flood
control and drainage facilities, cartographic, and environmental data. This
database is presently being used to more efficiently organize the agency's
operations, as well as to analyse existing relationships between vector presence
and other parameters, in order to identify vector/disease foci.
Background
In 1999, we started the development of a Geographic Information System
(GIS) to increase the efficiency of OCVCD vector control operations by identifying
vector foci where the surveillance and control efforts should be concentrated.
The GIS incorporates field data on surveillance and control acquired by the
technicians and scientists from OCVCD, and a number of overlays. The use of
a GIS has become more urgent given the anticipated introduction of new health
threats into Southern California. Of special concern is the introduction of
West Nile virus, which is known to be transmitted by Cx. Pipiens and is likely
transmitted by Cx. Quinquefasciatus. This latter is the most abundant species
in urban/suburban areas in Orange County and has been found to be the predominant
species breeding in the underground channels. A second concern is that Ae.
Albopictus, if introduced into Southern California, can potentially breed
in underground drains. In view of this, mosquito control agencies in large
urbanized areas throughout California may have to dedicate more resources
to the control of mosquitoes in underground drainage systems. The GIS system
provides a powerful management tool for vector control by enhancing the agency's
ability to survey and control mosquitoes that breed underground. It also
allows for more systematic follow-up of treatment history, minimizing duplication.
In addition to mosquitoes, a great part of OCVCD's workload involves rat control,
and the GIS system also aids in the identification and monitoring of rat-infested
areas.
In this paper, we examine the distribution of Service Requests (SRs) for
mosquito and rat complaints. We expect that calls are usually due to the
existence of real pest problems. However, several cultural and circumstantial
factors can influence the likelihood that people call. We attempt to examine
some of these factors and to compare the number of calls with actual mosquito
trappings made in the same area. The existence of clustering of SRs in certain
areas, especially if they are consistent over time, can be indicative of environmental
factors favouring vector development.
Methods
A GIS was set up in ArcView 3.2, including OCVCD mosquito and rat SRs
and mosquito CO2 (CDC) trap information from 1996 to 2001 and a basemap including
streets and cities from Thomas Bros. Maps(, land use (from Orange County Geomatics)
and annual per capita income and population density for cities in Orange
County in 1999. Only data for 1999 was available for the latter, but we assume
for the analyses that the population and income level patterns are similar
a few years before and after that date. To examine the distribution of SRs
across the county, we geocoded all SRs using Thomas Brothers database.
We analyzed the distribution of SRs (mosquito and rat separately) in Orange
County at 2 spatial scales. The first one was at the city level, where we
compared the number of SRs per city in 2001, divided by the population size
in each city in 1999 (we will call this 'density of SRs'). We examined the
effects of income level on the density of SRs by fitting a simple linear regression.
We then visualized the model errors by plotting positive and negative residuals
on maps showing density of SRs. At a more detailed scale, we analysed the
distribution of SRs per square mile by overlaying a 1square mile grid over
the mosquito and rat SRs and counting the number of SRs. We visually searched
for areas of clumping of SRs. To determine the consistency of the pattern
over the years, we correlated the number of SRs in each square mile cell
over the years. Finally, to determine whether mosquito SRs have a direct
relationship with a real mosquito problem, we compared the information available
from mosquito traps with the number of SRs in a 1 mile buffer area around
them.
Results
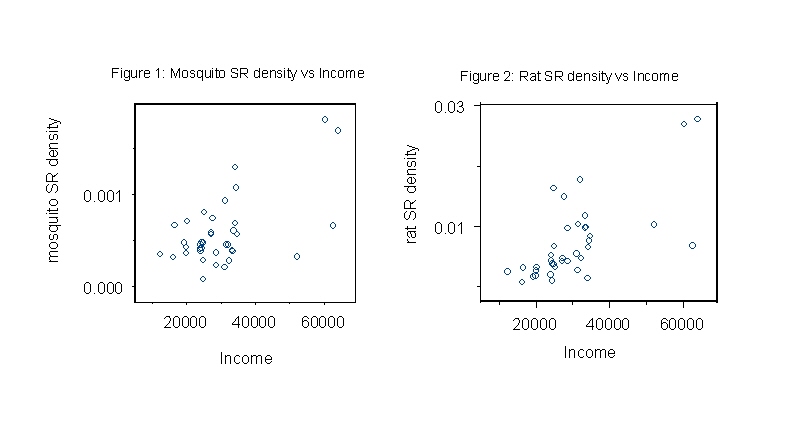
We found a significant and positive regression of per capita income on
density of SRs, both for mosquito SR (p=0.0001, R2=0.34) and rat SR (p=0.0000,
R2=0.47) (Figures 1 and 2 for mosquito and rats, respectively).
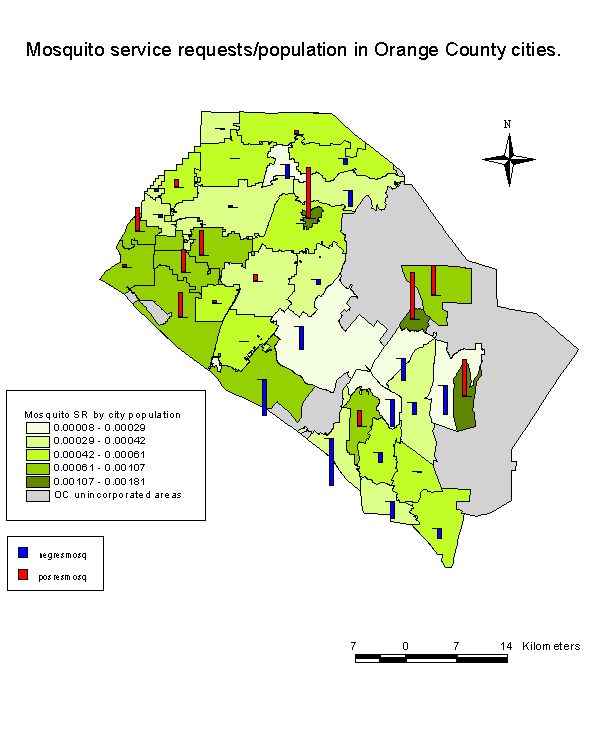
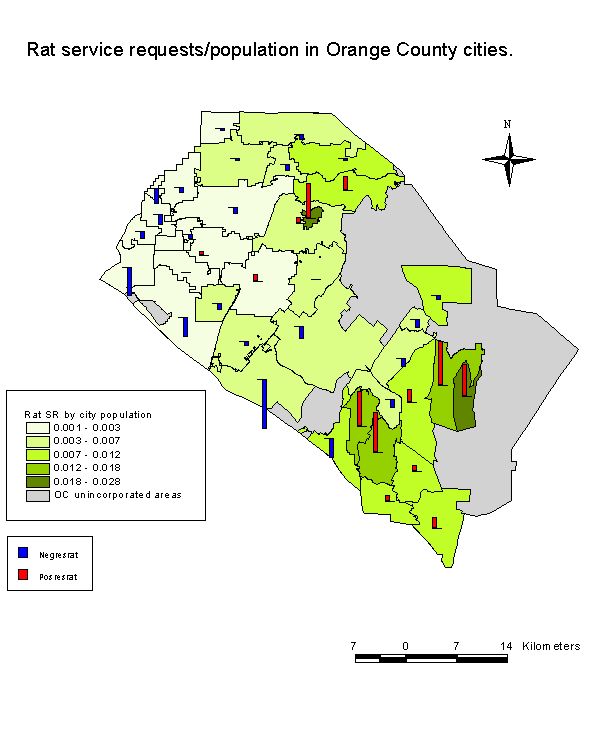
The residuals from the linear regression analysis were plotted on maps of
mosquito (figure 3) and rat (figure 4) density of SRs (red bars for positive
residuals and blue bars for negative residuals). An examination of the distribution
of the residuals shows clustering of rat SRs in southern cities, while there
is no clear pattern for mosquito SRs.
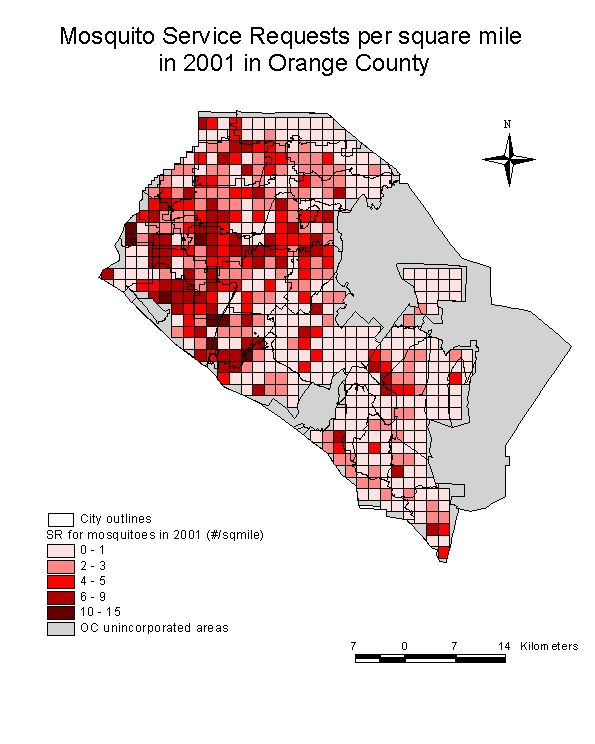
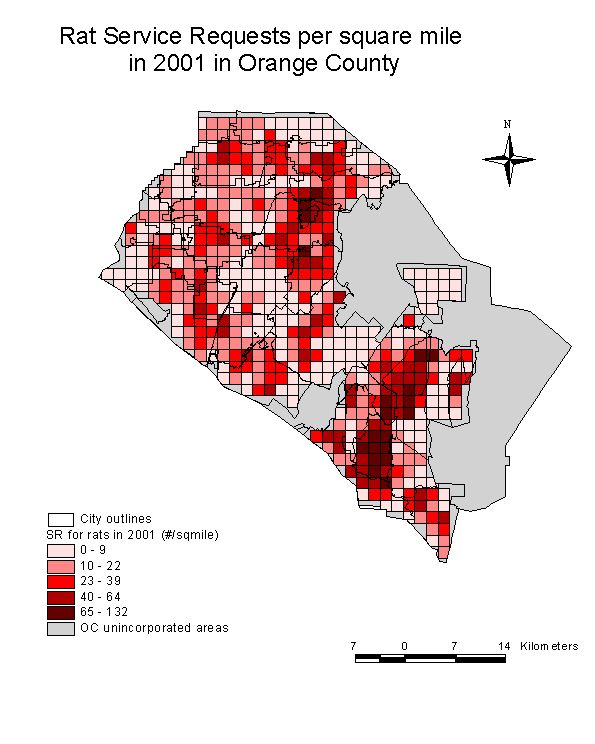
Next, we plotted the number of SRs per square mile in 2001 for mosquitoes
(figure 5) and rats (figure 6). Rat SRs per square mile were highly and positively
correlated among years (R2>0.8), while mosquito SRs where also positively,
though less strongly, correlated (0.5<R2<0.66).
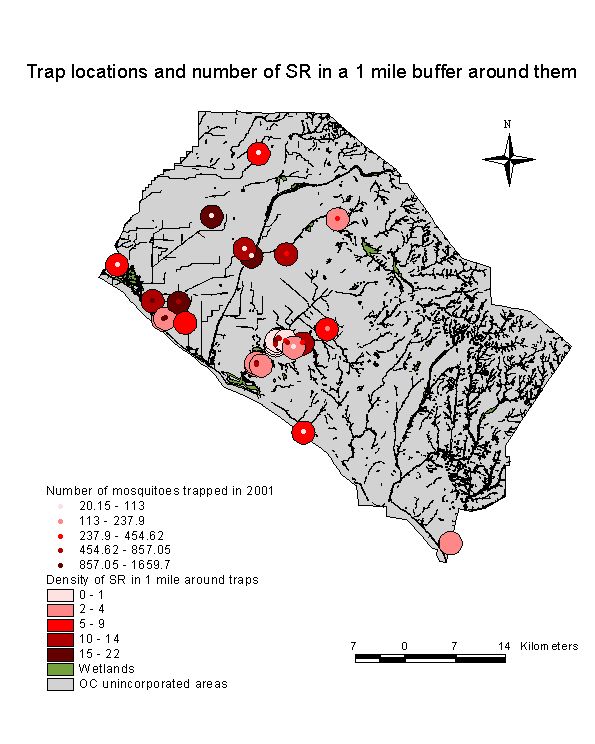
Finally, we plotted mosquito trap locations and the number of SRs in a
1 mile buffer around them. We color-coded the number of mosquitoes trapped
in a year and the number of SRs around the trapping site with the same shades
of red. A correspondence of high number of mosquitoes trapped with high number
of SRs around the trap location would therefore show a dot (trap data) and
circle around it (# of SR buffer) of a similar shading of red. A visual examination
of Figure 7, shows no obvious correspondence between these two variables.
Discussion
Service Requests are an indicator of the community's concern about a certain
vector. The degree to which people call OCVCD for assistance, however, can
be influenced by other factors, such as income level, as shown here. In the
case of mosquitoes, we found no relationship between the number of mosquitoes
trapped and the number of SRs in a 1-mile area around the trap. The location
of the traps, however, is arbitrary, and many of the high mosquito trapped/low
SR traps are located near coastal wetlands, which are important mosquito sources,
but the density of people is low and they often lives a certain distance
from the wetlands. (thus less number of service requests are expected).
There is a positive correlation between density of SRs among years for
mosquitoes and rats. In the case of rat SRs, this correlation is very high
(above 0.8 in most cases). This implies that there are consistent clusters
of rat SRs over the 5 years of data. These clusters could be due to the same
people calling over the years and maybe communicating it to their neighbours,
to an environmental factor causing high rat densities, or to a combination
of both. The high rat SRs areas are usually areas of low population density,
many of them with presence of natural or planted vegetation, which probably
enhances rat infestation. High mosquito SR areas are mostly in the north of
the county, in areas of higher population density.
The GIS allowed a description and preliminary analysis of vector and SR
distribution patterns. We also begun to examine some of the factors that may
be causing these patterns. The identification of clusters also provides a
useful tool to direct the agency efforts to the most problematic areas. Future
work includes to continue the analysis of spatial patterns at larger spatial
scales, in particular, to examine the relationship of SRs with the above
and underground drainage system and to examine temporal patterns in SRs and
mosquito trapping data.
Acknowledgments
I would like to thank the staff at OCVCD, in particular Robert Cummings,
Stephen G. Bennett, Shana Lowe, Matt Robinson, John Newton, James P. Webb
and Robert Sjogren, for their help in gathering the information, interpreting
the data and for all their support. .
Maria Diuk-Wasser, PhD. Candidate
Dept. of Organismic Biology, Ecology and Evolution, University of California,
Los Angeles
621 C. Young Dr., Los Angeles, CA 90095
Phone: 310-206-4079
Fax: 310-206-3987
e-mail: madiuk@ucla.edu