To effectively manage a hydrant servicing system, database systems may be integrated with GIS to create a graphical interface that reduces errors and improves overall water system confidence
. The Kissimmee Fire Department is a 70-member department with 63 combat
personnel that provides fire and emergency medical services to a population of
approximately 50,000 residents, and a large transient tourist population. Our
proximity to Walt Disney World has created a rapidly growing environment with
daily challenges unique to our area. The City of Kissimmee made a commitment
several years ago to develop an excellent fire rating to attract businesses and
residents. As part of this effort, we have maintained a rating of ISO 2 on a
scale of 10, with 10 being the lowest rating. This is a stringent rating system
and we fall into less than 1% of the fire departments in the nation. The
Insurance Services Organization, which evaluates fire departments, develops the
ISO rating, and the rating is reflected in lower property insurance
rates.
Forty percent of the scoring by ISO is related to the water system in
the community. While we do not install and maintain the water system, we are
tasked with maintenance and yearly testing of the hydrants for function and
readiness.
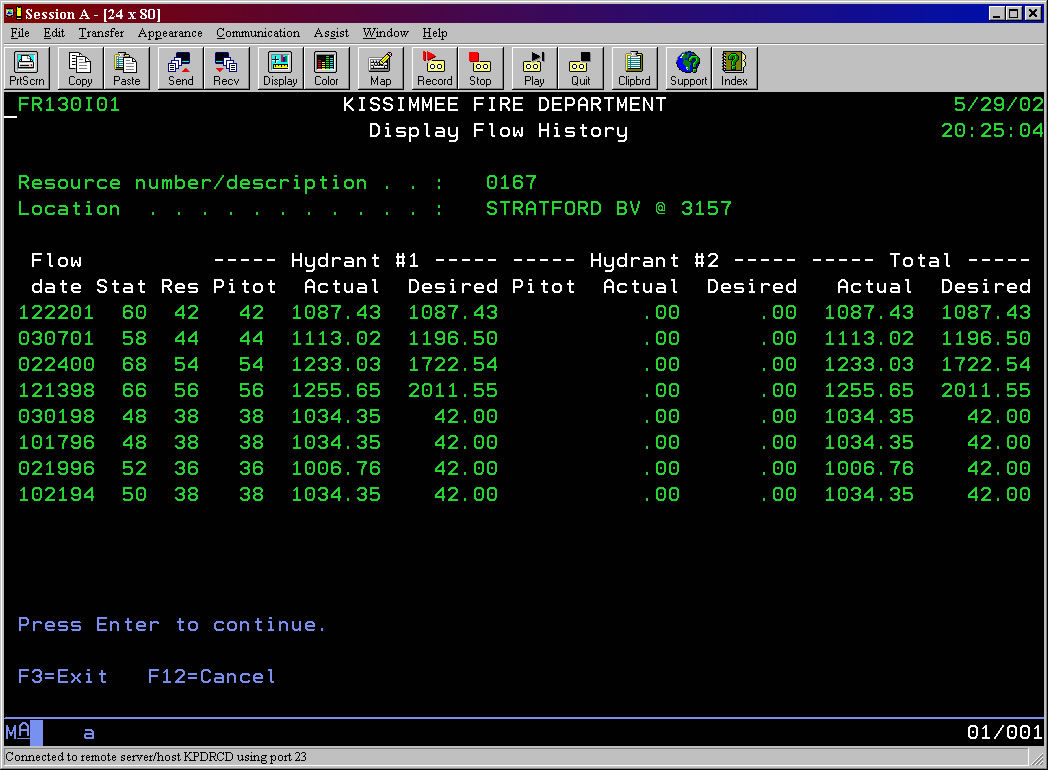
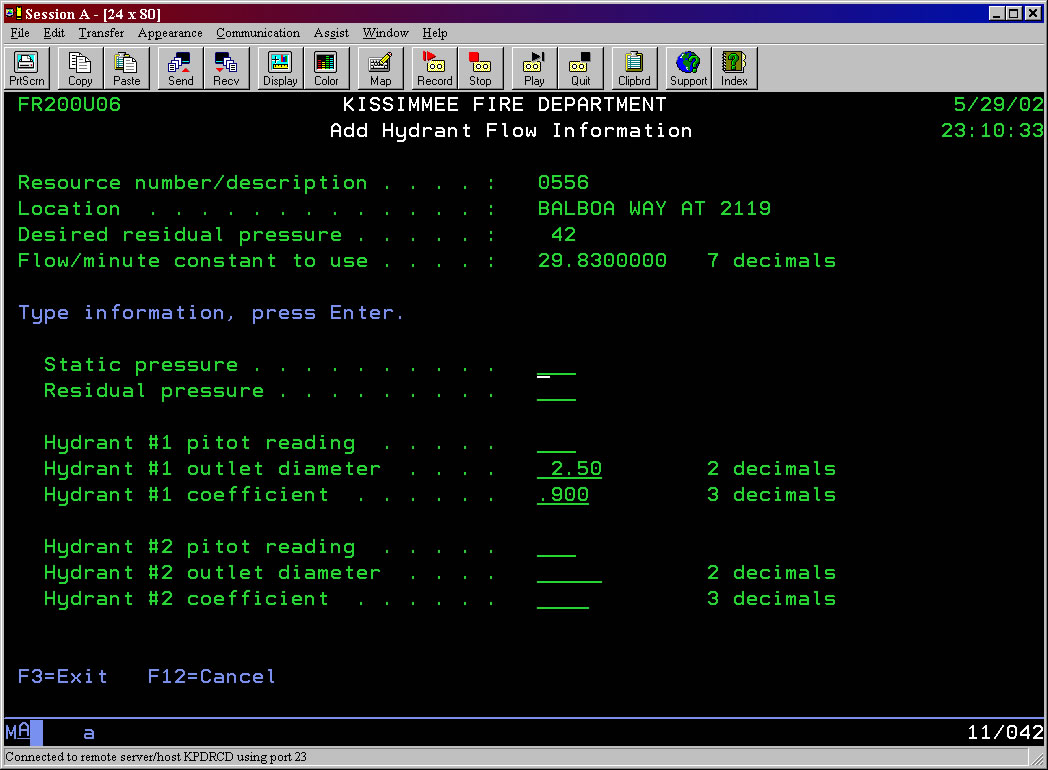
During our yearly process of testing, we must flow each of the
1600 hydrants in the City, record static pressure, flow pressure, and determine
actual flow. This is usually accomplished with on-duty crews in the normal
course of the shift. For years, our data has been stored in an HTE A/S 400
system. This system is very effective for data storage, but difficult for
visualizing areas of flow problems and is limited in hydrant location
description.
While this had been a vexing problem for a long time, resulting in confusing
and possibly missing data, we were guided by the GIS team within the City, Tony
Curtis and Matt Cieri, to consider a new and more effective means of integrating
data with a visual representation of the hydrant information. We had never seen
ArcView, and were excited about the idea. Tony and Matt were excited since they
did not have to do the work. However, our lack of knowledge was overcome by a
strong desire to create a usable system that would serve our firefighters and
citizens effectively as well as satisfy the needs of monitoring organizations
like ISO.
Under the tutelage of the GIS department, we began a long and
sometimes frustrating, but successful, journey that we hope can benefit other
fire departments facing this problem.
The first step in developing a map
based hydrant database, and without doubt the most important, is to identify
your in-place knowledge base and resources. Having a limited idea of what GIS
was, what it could do, and how to use it, I turned to our GIS department. Do not
be afraid to plead ignorance on any point. Sometimes a firefighter is speaking
of one thing, but a GIS specialist is interpreting it in a very different way.
Do not be afraid to lean on their expertise, but pay attention and look for
common ground. Try to learn how they look at problems so you may frame issues in
a more meaningful manner. Once you learn about shapefiles, dig deep and search
for data that may match your needs.
Our GIS department had extensive
shapefiles of roads, buildings, and water bodies that assisted greatly in giving
us the initial idea of where we needed to add hydrants and how it would
appear.
Simply put, a shapefile, (for this purpose), is a set of points with
associated tabular data containing information about a dot on a map. This data
can be a written description of location, flow pressures, or unique
identification numbers. Once created, the dot on the map can be easily projected
onto street maps for easy reference.
Our Water Resources Department had a very dated shapefile of hydrant
locations, with no useful tabular data, but it created a good starting point. If
there is no existing shapefile available, consider a field collection system
with ArcPad on a handheld, and plot your hydrants accurately. Start with a basic
street map, and drive the areas, mark your hydrants locations, and add
identifying data as you go. If you have hydrant data existing in some form, you
add it to the points.
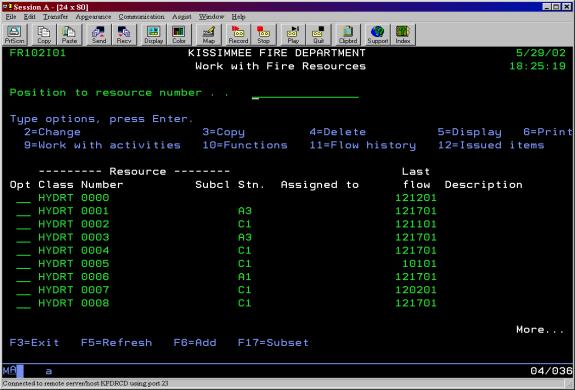
Our existing hydrant data was mostly on green bar
printouts, with 17 letters of descriptive location data. By examining the
ArcView shapefiles, each hydrant was identified and a node number added to the
table on the map. Since the database in the A/S 400 was created 10 or 12 years
ago, there were many descriptions that were completely inaccurate or missing
entirely. Add approximately 600 new hydrants in that time frame, and the task
was even more daunting. A new field was created in the A/S 400 to add a
distinctive node number from the shapefile for joining the information later.
Any type of database can be used to store your hydrant data. Whether it is
Microsoft Excel or Access, or any other spreadsheet format, it can easily be
attached to an ArcView or ArcMap shapefile to correlate data. The most important
thing to remember is to be sure you have unique identifiers that exist in both
the map data and the database. Without this link your records will be
meaningless and useless, and it will frustrate your efforts.
Once we were
relatively comfortable with the correlation of the existing points and hydrants,
the IT department assisted by downloading the A/S 400 data in a text file,
ensuring that the node number was included. Then, the data was joined, and the
real work began.
Joining data in ArcView or ArcMap allows the program to
utilize any of the tabular data for labeling on the maps, whether the hydrant
number, location description, or flow pressures. The easiest way to explain the
process is to imagine two paired columns of numbers, one random and the other
ordered. Then, create another set of columns, again with one set random, the
other ordered. The ordered numbers are the common ground that would allow the
random numbers to relate. Any point in a map may be given a unique identifier,
whether it is the GPS location or the hydrant number from your data. The
important issue is to be sure the database and the shapefile have common
integers so they may be linked.
Random checks were performed on over 50% of
the projected map data. Labeling each hydrant with the initial joined resource
number, then comparing the label to the stored data in the A/S 400 accomplished
this. We set up a workstation with both ArcMap and the A/S 400 interface running
side by side, and quickly checked the points. If a discrepancy was noted, it
could be readily corrected. Some of the hydrant points were moved from one side
of the road to the other, occasionally a point was moved a mile. But with each
change, the data became more accurate.
As we further cleaned up the data and confirmed the locations, our annual testing period was approaching. Since our confidence level was not 100%, it became imperative that the crews testing the hydrants would be our quality assurance. At the beginning of the testing period, we used ArcMap to create 11 x 17 maps of each crew�s area of responsibility, appropriately labeled. The large format gave them easy to read labels, and allowed for additions or corrections in the field. The crews could enter test data in either of two methods; writing the pressures on the map next to the hydrant for later entry, or directly into our A/S 400 interface through the mobile computers on the vehicles. Both entry methods were effective, but the field entry was most well received and less time consuming.
At the end of the three-month testing period, IT ran another report for data containing hydrant resource numbers, test date, and flow pressure. This information was then joined to existing data in ArcMap, and a graphical representation was created. Using the flow pressure results, each hydrant was assigned a color within a class range. The ranges approximated gradients of up to 500 gallons per minute, 501 to 750 gpm, 751 to 1000 gpm, and 1001 gpm or above. The hydrant symbols were then displayed with brightly contrasting colors to help clarify areas of low flow, which are inherently dangerous and present inefficient water for structural firefighting.
For the first time in the Kissimmee Fire Department�s history, as the map
appeared on the screen, we were able to see problems and understand
relationships that had been difficult to perceive. Immediately, we identified
one water main that appeared to be partially closed and notified the Water
Resources department of the situation. An added benefit was not manually scan
reams of printouts to determine tested/untested areas. Within half an hour, we
can have the whole of the project on our desktop.
Each testing period will
now be prefaced with identification of new hydrants, and creation of the
now-familiar maps for the crews. Acceptance was good and they are able to see
and appreciate their hard work. This process will be refined each year and will
lead to insight and ideas for improved application of GIS for our everyday Fire
Department use.
As we marveled at the success, we realized more than simple
graphical display of hydrant data. We have learned about the wealth of useful
GIS information available, shared updated data, learned how to use the Esri
products, and most importantly, developed excellent working relationships within
our city government structure we had not had before. One important area of
impact has been the man-hour savings with a reduction of approximately 800
hours/year resulting from improved efficiency in locating hydrants and data
entry. Our Department is now confident of the locations of our hydrants,
accuracy of our data, and our ability to ensure protection for our
citizens.
We have also transferred our updated shapefile to the GIS
department for inclusion on our MDC map display interface for immediate
reference during emergencies and given the results to the Water Resources
Department for their use.
The main lessons learned are to actively mine your
resources for knowledge and assistance, don�t be afraid to try new methods, and
once you get past the initial bumps, share with everyone. The payoff will be
tremendous.