Las Virgenes Municipal Water District (LVMWD), a water and wastewater utility, has completed a significant milestone of investment and challenge in time and dollars in GIS implementation � data conversion and application development. How was the challenge met without breaking the budget and maintaining the organizational support of the Board of Directors and staff in bringing the dream into reality? This paper discusses the plans for implementation and what we did to stay on the right course, the lessons learned in implementation, how to adapt to changing environments of the GIS platform (ArcInfo 7.2 to ArcGIS 8), how to approach data conversion, how to identify and prioritize applications, and the budget guidelines to use for implementation. The paper concludes with tips on bringing success to your G.I.S. project by staying on time, on budget, and on target for your final product that all can use.
There are numerous aspects of a GIS implementation and each goes through three distinct phases to one degree or another. Initially there is an infatuation stage with the magic of a GIS that comes from defining what is wanted from GIS�the GOOD. That is followed by a long series of decisions: where and when to use a consultant for work and assistance, deciding the GIS software platform to be used, making the conversion or creation of data to populate the GIS database, conducting the inventory of existing data sources such as tabular data and drawings, developing the many �applications� to be used for the GIS to assist in management decisions, staff training and familiarization with the GIS, and numerous other requirements to be satisfied�the BAD. Last, there is the realization of the actual costs in time, dollars, and sweat equity needed for the organization to implement the GIS program to reach success�the UGLY.
None of these aspects need to halt the process. Rather, they form the framework for the implementation of the overall GIS vision for an organization. They show incremental project accomplishments for the organization to see, feel, and use in the normal course of events. Recognizing and overcoming these potential pitfalls allows the GIS to become a major part of the information systems used by the organization�s management to make better-informed decisions regarding its core business and support to its customers.
Las Virgenes Municipal Water District (LVMWD) began developing the concept of an enterprisewide GIS in 1994 with an initial feasibility study of GIS needs and requirements. Since then, the district has moved from the task of winning approval from its Board of Directors to implementing the GIS and a wide variety of GIS applications. It was key to obtain not only the endorsement of the GIS concept, but commitment for long-term program funding as well. This move from dream to reality was a long road fraught with setbacks, cost escalations, and many other unknowns. However, with a good strategic vision and plan in mind, the GIS dream can become reality.
LVMWD is a small to medium sized water/wastewater utility the serving a 122-square-mile area in the western portion of Los Angeles County in California. It provides potable water, recycled water, and wastewater treatment services to a population of approximately 70,000 persons behind 19,500 metered connections in the unincorporated County area and the incorporated cities of Calabasas, Hidden Hills, Agoura Hills, and Westlake Village. The wastewater service area also includes portions of eastern Ventura County (see Figure 1).
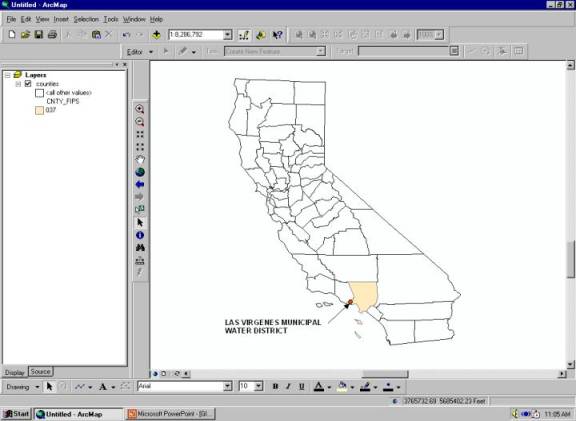
Figure 1: Las Virgenes Municipal Water District Location
LVMWD is a member agency of the Metropolitan Water District of Southern California (MWD). LVMWD has no local water supply of its own from surface runoff or wells and is 100% reliant on MWD for all of its potable water supply. LVMWD has over 250 miles of potable water transmission and distribution piping, 60 miles of recycled water distribution piping, and 50 miles of trunk sewer mains. The overall setting of the district�s area is in the Santa Monica mountains with services provided at a wide variety of elevations from 700 to 2,600 feet above sea level. Accordingly, there are numerous pump stations, tanks, and other facilities for the many pressure zones of service. LVMWD owns and operates its own 10,000-acre-foot seasonal storage reservoir and water treatment filtration plant. This storage is used for seasonal �peaking� requirements as well as emergency supply in the event of natural disaster such as an earthquake that would interrupt normal water deliveries from MWD. The district operates and maintains its own wastewater treatment plant, and it provides recycled water for irrigation within its service area. The district�s service area in Los Angeles County is shown in Figure 2.
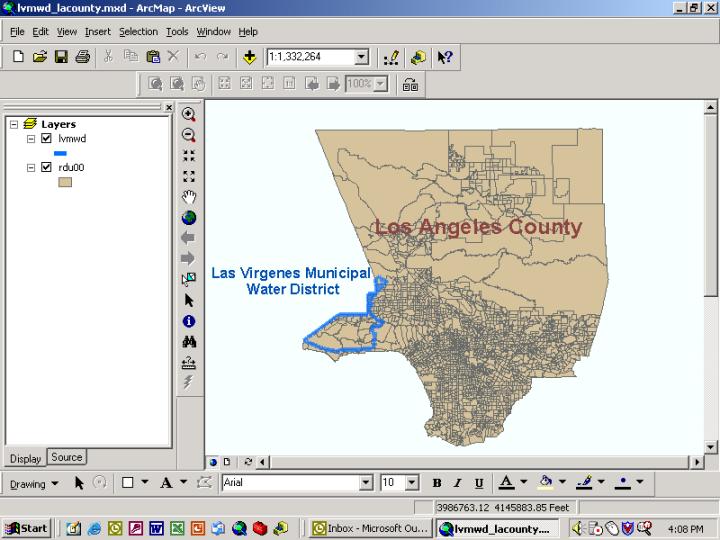
Figure 2: LVMWD in Los Angeles County
The district�s areas of service and communities supported are shown in Figure 3.
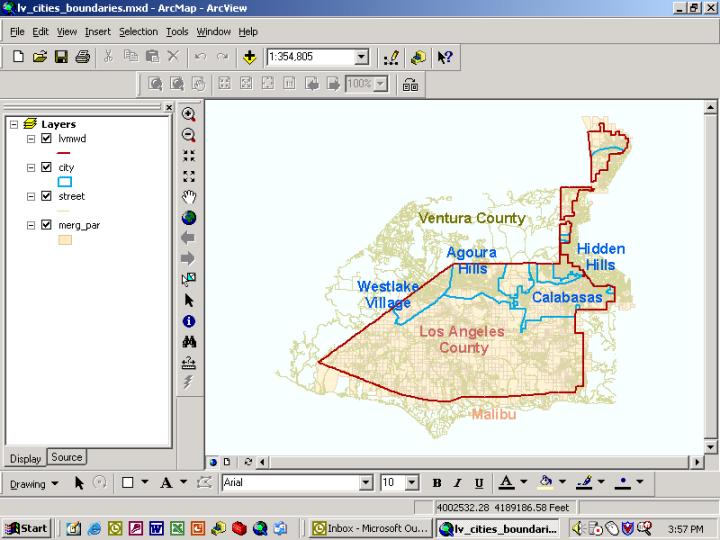
Figure 3: LVMWD Service Area
By the early 1990�s, senior staff and management at the district were convinced that LVMWD should implement a GIS. They felt certain that it would provide a significantly better method to perform many of the tasks central to the utility�s effective business. Key elements were master planning, demand analyses, facility operations, and customer service. As noted above, the district�s geography and method of operations places a significant importance on pumping, distribution, storage, and pressure regulation to serve its water customers. To effectively manage this type of operation, there was an important need to have current, accurate information available to analyze data with a geographic reference in order to optimize operations and service. Included were overall facilities management, system operations, mapping and real estate interests, information management and integration between diverse sources of data, and emergency response management.
Further, the district did not have in-house capability to perform hydraulic modeling for its water systems and relied on consulting engineering support for that planning function. Operations and planning staff were constantly struggling with ways to present their modeling results to managers and the Board of Directors. Further, the hydraulic model being utilized was static in nature and could not adequately address the dynamics of changing operational scenarios. There were other limitations to the water demand analysis regarding the inability of the system to relate changes in land uses with resulting water demands. Also, there was no easy way to overlay the pipeline system on a base map to illustrate how various changes in parameters would affect the water distribution system.
At that same time, the district was coming out of an extended drought. It was apparent that tools were needed to support the aggressive water conservation programs that were mandated for the region. The district needed better means to analyze and thematically map trends and variations in water consumption within its 30,000 parcels. In addition, district staff needed relatively detailed land use information with which to analyze, design, and plot individual irrigation plans for the many large land holdings that exist with the district�s service area. Periods of drought are common in Southern California and drought management plans are quite important in managing the scarce resource of water. The GIS was recognized as a significant analytical and quantitative tool in that effort.
Finally, senior staff realized that taking steps to integrate the district�s many diverse sources of information would pay dividends in allowing staff to work more efficiently. Using GIS technology would allow staff to catch up with backlogged work and, most importantly, maintain the district�s high standards of customer service by allowing quick access to accurate and reliable facility infrastructure information in response to customer calls.
In 1994 the district conducted a GIS needs and feasibility study with the help of a consulting firm. Numerous interviews were conducted with staff members to determine their respective management information needs, potential uses for the technology, and establish a relative sense of priority of various GIS applications that may be developed. The consultant also conducted an extensive inventory of databases already maintained by the district staff, including the kind of data, format of the data, software used, current uses of the data, and frequency of updates. This inventory of data assets represented potential links for the GIS to use so that data were not being duplicated unnecessarily and that regular updates were taking place. As a result, the district standardized its data formatting so that everything was maintained and available in a Windows-compatible format. In addition, the data were maintained in a unique location of responsibility to ensure integrity.
The feasibility study report was presented and adopted by the district Board of Directors in 1995. The study concluded that a GIS was not only feasible but necessary for the integration of numerous data sources, for proper facilities management, to provide numerous mapping outputs, and to relate spatial data to real world questions and inquiries for management attention and decision. The study also laid out an implementation strategy and timeframe of accomplishment, cost parameters and assumptions, and a priority order of high, medium, and low GIS applications.
As with many projects that are large, complex, and implemented only after a significant investment in time and money, delays inevitably occur. It may be fear of the unknown, other priorities taking precedence, or simply unwillingness to make the investment without fully understanding the potential results or outcome. In any event, the GIS implementation plan was put on hold for two years awaiting available funding and other resource commitments.
This delay, however, did not mean planning the GIS implementation ceased. Rather, the hiatus afforded staff an excellent opportunity to revisit the overall GIS implementation plan and more fully understand the steps needed to win support and commitment for the system. Staff was able to review and better understand the state of the overall GIS industry and where it was headed, develop a strategy of how to proceed with subsequent steps, garner increased support from other staff and the Board of Directors, and refine budget estimates. In general, the GIS implementation involved numerous strategies and decisions:
- Development or acquisition of base map information that was parcel specific with roads and other details relevant to utility operations
- Refinement of the scope of work and the decision to use consultant services to develop a detailed GIS implementation plan. This included an RFP and related evaluation criteria for the GIS software platform, development of a data conversion RFP, implementation of high-priority GIS applications, and other support services to the district staff
- Refinement of the priorities of GIS applications to be implemented. This was done in consultation with other district operations and customer service staff
- Integration of Master Planning efforts of demand analysis and facility requirements into GIS database information
- Training and exposure to GIS potentials by market research and discussion with other users of GIS, especially in the water and wastewater industry. This was done to glean the best of the �lessons learned� by others to avoid the same errors or mistakes
- Recognition that internal databases needed to be consistent and accessible to the GIS when needed, an effort that was undertaken with the Information Systems (IS) and Operations groups
- Analysis and cataloging of record drawings of water and sewer systems to develop an inventory and record of each into an Microsoft Access database for easy reference and retrieval
- Based on the previous feasibility study, develop a detailed cost estimate and plan for GIS implementation.
Despite the two-year gap in measurable progress, there was higher level of confidence and understanding by staff in where the GIS was going and how it was going to get there successfully. This planning phase proved to be very valuable in later implementation phases.
The GIS Program and Implementation Plan was adopted and approved in late 1997 with an implementation budget of $1,038,600 to be expended over three to four years. This was a significant milestone to be achieved but the challenge now faced by the staff was formidable as they set in motion the commitment to build the GIS. The overall budget as adopted is presented in Table 1. Also shown for reference are costs as they actually occurred during the implementation period to date.
LVMWD�s GIS Implementation Budget
Expenditure Category |
Budget |
Actual |
| 1. Consulting (GIS platform software, database design,custom applications, etc.) | $248,600 | $285,000 |
| 2. Hardware Acquisition | $85,000 | $20,000 |
| 3. Software Acquisition | $55,000 | $15,000 |
| 4. Database Development | ||
| - Base Mapping | $80,000 | $55,000/year |
| - Pilot Study Data Conversion | - | $85,000 |
| - Contracted Data Conversion | $450,000 | $225,000 |
| - In-house Data Conversion | $75,000 | $25,000 |
| 5. Training | $45,000 | $45,000 |
| 6. Other Contractual Support | - | $25,000* |
| 7. Application Development | - | $150,000* |
| TOTAL | $1,038,600 | $995, 000-1,040,000 |
* Estimated costs. In some cases other district funds were used for some acquisitions, notably for district network compatible upgrades serving other functions and the GIS. Also, some costs continue to accrue as expenditures are made annually, or will occur in the near term future.
Finally it was time to execute the various contracts and staff effort needed to perform the work. The staff�s planning, understanding, and confidence were put to the test.
The first step was to negotiate a contract with a consultant to develop the detailed implementation plan. Following that, the next milestone was the identification of the GIS software platform that would be used for the overall implementation. The consultant assisted in preparing the Request for Proposals (RFP) for these services and products and acted as a technical advisor in evaluating the proposals received.
Although the Board had approved a multiyear budget, the District�s implementation team knew that ongoing support for the program relied on achieving early results. To this end, the district worked with the consultant to define a system development plan focused on early delivery of GIS capabilities. Because the development of the water and sewer system data models and subsequent database conversion would take a relatively long time to accomplish, it was decided to first focus on establishing a base map and implementing a few key applications that would be visible to the Board and senior management.
An important aspect of the success of the current GIS operation as well as the GIS expansion program is the development and maintenance of an institutional support environment. At LVMWD this was achieved through two primary mechanisms: 1) establishing the institutional responsibilities to ensure the GIS is properly administered and 2) providing routine, on-going training.
The district splits responsibilities for administering the GIS between two primary divisions. Responsibility for maintaining the network and performing database and system administration is assigned to the IS Group, which is also responsible for administering the district�s office LAN/WAN and customer information system. Five LVMWD staff members assigned to the Planning division perform the technical administration and maintenance of the GIS. The Planning Administrator serves as the overall GIS program manager. The District�s GIS �guru� is a civil engineering associate who has received extensive training at the software vendor�s training facilities. Two drafting technicians oversee the day-to-day use of the GIS program as well as update existing databases related to various applications. The final user is the civil engineering assistant whose responsibilities deal primarily with district real estate functions such as easements, rights-of -way and the like.
What is notable about this institutional arrangement is that the district has not attempted to formally create a separate GIS division or hire additional staff. Rather, the GIS has been directly integrated into the ongoing work functions of the planning staff. The �pre-GIS� roles and responsibilities of these five individuals have not substantially changed. In the case of the planning administrator and the civil engineering associate, GIS responsibilities have been added to their previous work functions while the others who perform GIS functions and database updates have altered their current work methods using manual techniques or Computer Aided Drafting (CAD) and the like, to using the GIS to perform map and data updates.
LVMWD has also made a conscious commitment to provide on-going training and personal GIS skill development of the staff. The district budgets approximately $15,000 per year to send its GIS staff to GIS vendor training for core training and training updates as the vendor�s software evolves. The GIS program manager and �guru� also attend numerous sessions in advanced training with the vendor, professional conferences, and participation in related User Groups for water and wastewater industry GIS professionals. They also assume responsibility for the training and daily assistance to others in the effective utilization of the GIS. The district has also opened use of its GIS to other agencies in the area to perform training and prepare landbase-related studies and project work facilitated by the GIS format.
Phase 1:
- Develop base map
- Develop several high-visibility applications (land-based)
- Implement an initial configuration of GIS hardware and software
- Implement water and sewer data conversion pilot
Phase 2:
- Complete water and sewer geodatabase model
- Complete water and sewer data conversion
- Implement maintenance and basic user applications
- Expand the GIS hardware and software configuration to add users
Phase 3:
- Implement key system integration applications (link to customer information system and hydraulic modeling)
- Expand the GIS hardware and software configuration to add users
An issue confronted by all water utilities is that they need an up-to-date base map but their primary business has little to do with updating the base map�they are base map information users but not maintainers. The issue of most importance is maintaining current parcel-specific information for the parcels within the jurisdiction. Lot line splits, parcel consolidations, tract map recordation, and changes in parcel ownership occur often. LVMWD experiences a 10 to15% change in the parcels each year, yet it has no direct access to the data to know when these changes occur�it is information retained and updated by the County. Some water utilities bite the bullet and hire the staff needed to perform base map maintenance, while other water utilities make arrangements with local city or county agencies to receive periodic base map updates.
Since the majority of LVMWD�s service area was in Los Angeles County, an early plan involved purchasing the county�s base map and then receiving periodic updates. Upon investigation, however, a third-party company serving as a valued-added broker of the county�s base map information was located. The company provides a subscription service that provides an integrated map database of parcels, easements, street rights-of-way, Thomas Brothers map information (including street names, political jurisdictions, parklands, schools, and the like), assessor data, other county public works information, and a commercial-style real estate ownership data similar to TRW information about �improved properties.� The subscription was available with annual updates for approximately $50,000 per year for the District�s service area and buffer areas as well. LVMWD opted to use the subscription service because it delivered an immediately useable base map and avoided other more costly alternatives. Refer to Figure 3 (above) for the district service area of service and Figure 4 for the district�s parcel base map with the water distribution system superimposed.
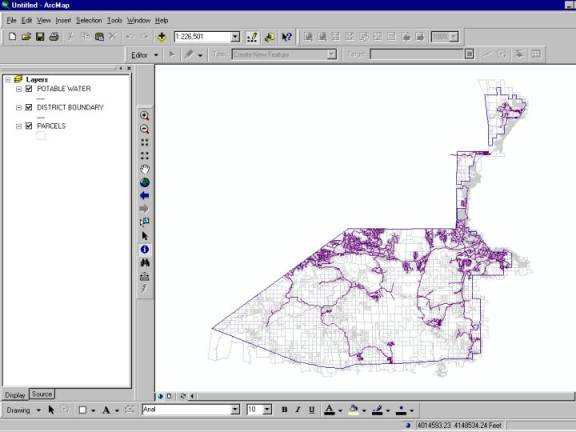
Figure 4: Water Distribution System and District Service Area
Achieving early success in acquiring a base map allowed the district to move quickly in developing several key applications that were highly visible and provided real value. During the early years of the GIS implementation program it was felt that these applications played an important role in showing early results. Particularly effective applications developed during this early time period included:
For this application product information collected from the registrar of votes was combined with the base map to prepare maps and data summaries of registered votes within the geographic divisions represented by each of our Board members. This application product allowed the Board members to see the power of the GIS and its ability to quickly produce information of real relevance to their view of the world (refer to Figure 5).
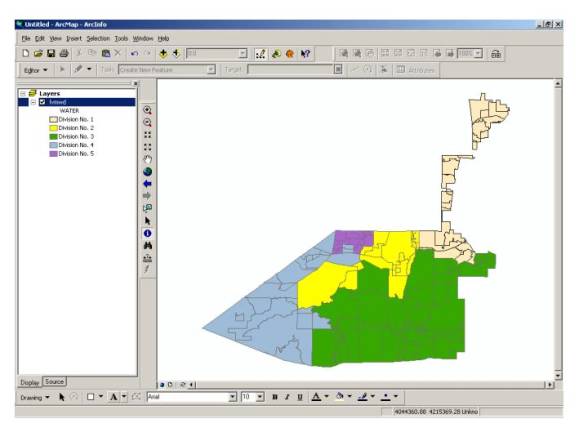
Figure 5: District Division Boundaries
As a regional entity, LVMWD has responsibility for tracking land development activity and periodically reporting this information to the local governments within its service area. Early in the program a tracking application was developed that allowed staff to prepare maps and data reports of the status of development activity within the region. This information is routinely provided to the governmental agencies in our service area, including the cities of Calabasas, Agoura Hills, Westlake Village and Hidden Hills, as well as the County of Los Angeles and other resource agencies (National Park Service, State Parks Service, and the like). This analysis also assists in district budget preparation by showing when various development fees may be received (refer to Figure 6).
Figure 6: Development Activity Tracking
LVMWD tracks new developments to determine if they are occurring in areas where sewer infrastructure had been built using bond funding. When new development occurs within these areas, fees must be calculated and assessed for the repayment of bonds by these new customers. Before GIS, this task had been a research-intensive process that required considerable time and effort. With the development of this application, the District�s management and Board were shown how GIS can create real work efficiencies and improve the District�s effectiveness in capturing revenues.
The district assesses a standby charge on all parcels in the district that either currently receive or have the potential to receive water service. Exemptions from this charge are possible based on certain criteria. The GIS was an ideal medium to show district management this parcel-specific information in a single glance. This graphic portrayal told the whole story in a single picture, while the related database provided accurate budget estimates of income from this revenue source (see Figure 7).
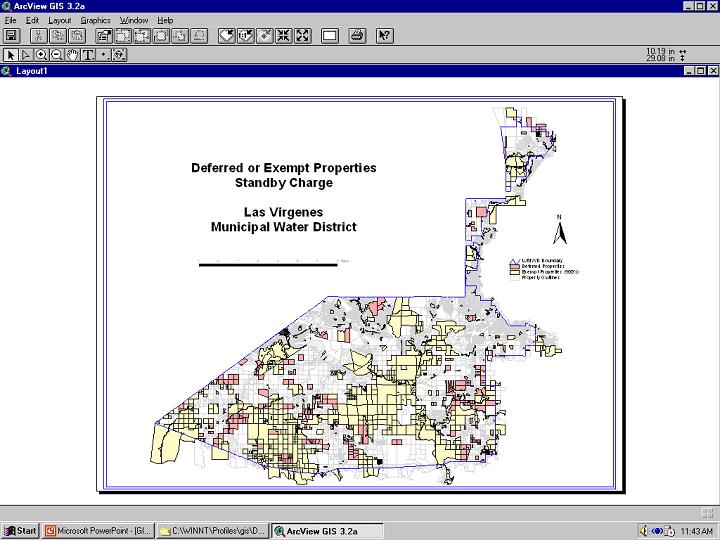
Figure 7: Water Standby Charge Properties
District staff has also performed many ad hoc queries and prepared numerous exhibits for presentations and other analyses with the GIS to support funding requests from outside agencies (federal and state grant funding), to develop management information tools for review and many representations of facilities mapping.
One small project done with the GIS compared various County regulations concerning disposal of wastewater bio-solids throughout the state of California. Data for this project was obtained from public Internet sources and publicly available mapping sources. The outcome was a map that clearly indicated the limitations on disposal methods and locations that may be available to the District.
Another useful application was relating tabular data developed to record the location and type of leaks that have occurred on district water mains and service lines. By integrating this database to the geographic locations shown in the base map information, it provided a very clear representation of potential problem areas that may need special attention in future repair and replacement programs for the district (refer to Figure 8).
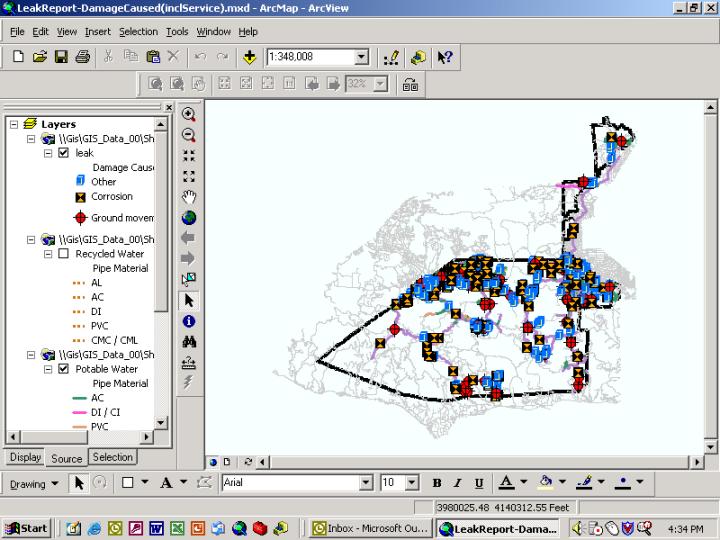
Figure 8: Leak Report Map
Currently, the district has completed Phase 1 of its GIS development program and is well into implementation of Phase 2. The base map has been developed and refined, land-based applications have been implemented, all record drawings have been scanned and indexed and are ready for data conversion, and the water and sewer system data conversion pilot has been completed.
The work done on the pilot data conversion project allowed the district to make considerable refinements to the data model that would be used for the overall data conversion effort. The software system bought and deployed by the District initially evolved through a significant upgrade and philosophical shift in data structure and design. Because of that, the District made the strategic decision to contract directly with the software vendor to complete the pilot data conversion effort.
When the initial pilot study and data conversion effort was begun, an older version of the operating Esri software was being used. However, the change in the software moved from a strategy of database design in a coverage system format to an object-oriented system with an associated geodatabase (which became ArcGIS 8). Concurrent with the pilot data conversion effort, the district became a "Beta" test site for the new software system. This partnership between the district and Esri led to numerous changes and refinements in the overall data model that were ultimately incorporated into the release of the new software system-wide for Esri. This whole effort was very rewarding for the district because it was in on the ground floor in developing the new data model. It was also decided to perform the pilot study utilizing the new data model and geodatabase rather than perform the data conversion in one system and then try to migrate into the new system at a later time.
The district recently awarded a contract to a consultant for full data conversion services directly into the new geodatabase structure utilizing the data model developed by the software vendor that has been customized by the district for particular local conditions. The overall data conversion work will take approximately eightto ten months. The resultant revisions made to the data model are shown in Figure 9.
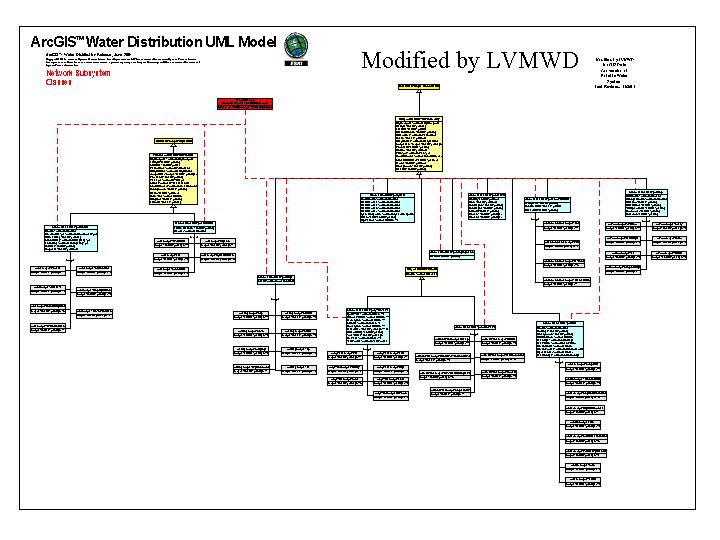
Figure 9: Water Data Model
With the completion of the water and sewer system data conversion, LVMWD will move into the third phase of its GIS, which will focus on achieving several key system integration goals. A primary goal will be to achieve a data-sharing interface between the customer information system and the GIS. This important point of integration will allows water use data to be collected and analyzed in support of the conservation program. It will also allow the District to quickly respond to customer information requests by providing a link between the customer database and the GIS facility database.
Another system integration priority at the District is achieving tighter data integration between the GIS and the hydraulic model. LVMWD is currently working with Haestad Methods to explore the best approach for sharing data between these two information systems. It is anticipated that a tighter integration between the GIS and the hydraulic model will improve the ability to update the hydraulic model, increase the ability to generate and analyze alternative system improvement scenarios, and enhance the ability to display and report the results of the water modeling.
Finally, District staff, with the help of selected special consultant effort, will also be creating new applications for use by all in the District to better manage the information and facility needs. There are also plans to link Internet capabilities into the GIS for not only internal use but for customers as well. One example of this effort will be developing further the intranet and Internet applications of the GIS to the internal and external customers for information about the district.
LVMWD�s experience with getting approval to implement GIS has and will continue to be an exercise in constant and determined effort that pays huge dividends. Realization of this dream � both in terms of finally realizing our GIS vision and in terms of implementing a system that is now recognized as making an important contribution to the District�s operations � is a story of success. Our experience, success, and honor of being recognized within the GIS industry as a leader and an award-winning program, provides other organizations with an example to follow. Those who find themselves in situations of �luke-warm� support for GIS implementation can benefit from our story and it provides encouragement and ideas for them to follow. Looking back, our current success seems to be attributable to several factors:
- Constantly keeping the message alive
- Working diligently and creatively to educate all levels of the organization
- Including the Board and top management in routine briefings on GIS
- Focusing on building understanding on how GIS would benefit the organization and developing a consensus to move forward
- Using the right mix of staff and consultants at key junctures of the program to develop the plan, assisting with winning approval, preparing a database design and data conversion services, developing custom applications, and follow the execution and implementation of the plan
- Seek opportunities to develop partnerships and direct contract support with software vendors to assist in implementation planning and execution (especially quality control measures)
- Generating early results that are meaningful and visible to the organization and management