I2VMS is a Windows-based application for facility, installation, and environmental management that combines the power of relational databases and geographic information systems to provide a user-friendly interface for organizing, storing, retrieving, and displaying environmental, facility, and maintenance data from a manager's desktop.
I2VMS is a custom solution for each client and can archive and display virtually any electronic information including word processing documents, spreadsheets, schedules, photographs, sound, video clips, CAD drawings, and the output of modeling programs. I2VMS can link to multiple dissimilar databases, retrieve and display information in custom or generic reporting formats, and can access information from remote resources.
This custom solution has been successfully deployed at nine DOD sites.
Pacific Western Technologies, headquarted in Lakewood, Colorado, provides innovative products and services in:
The Information Technology Solutions Group in Oak Ridge, Tennessee, offers:
I2VMS is an information visualization and management tool designed for decision makers. Managers and decision makers can mine and visualize information from multiple dissimilar databases to assist in making knowledge-based decisions.
I2VMS combines the power of relational databases and geographic information systems (GIS). It uses a Windows Explorer type data tree that is customizable and integrated with your site map, facility floor plans, equipment schematics, process flow diagrams, or other documents.
I2VMS is a Windows desktop application built with Microsoft Visual Basic and Esri's MapObjects 2.1.
I2VMS is modular in design so new functionality can be easily added to the core application. This approach to software design makes upgrades simple and provides expandability as your information requirements grow.
The Environmental Management Video demonstrates the general capabilities of
I2VMS as it was deployed at the Environmental Management Office at Fort Meade,
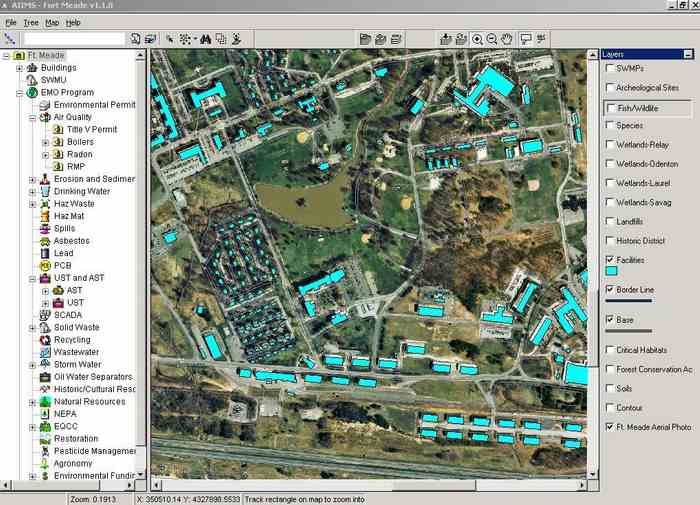
Maryland. Figure 1 illustrates the general layout of the I2VMS
application.
Figure 1. Screen shot of the I2VMS application as deployed at the Environmental Management Office at Fort Meade, Maryland.
As can be seen in the figure, I2VMS has a layout that should be familiar to users of Windows applications. In addition to the standard menubar and toolbar, an Explorer-like data tree occupies the left side of the application, a map view displays graphic features in the center of the application, and a layer list provides the user with the ability to show or hide particular data layers in addition to listing the layers that are currently available for display.
The most unique characteristic of I2VMS is the way that it links documents in the data tree to feature on the map. Menu items and tools on the toolbar also allow the user to zoom in to the map features associated with a particular document in the data tree.
The environmental management video begins with an overview of Fort Meade on the map, including base features such as roads, the installation boundary, and a "Facilities" layer which includes buildings within Fort Meade. The data tree is collapsed down to its root, a folder named "Ft. Meade."
The mouse pointer is used in the data tree, just as it is in Explorer, to open and close folders, and select documents within folders. The mouse pointer can also be used to select tools from the tool bar to change the map extent, select map features, and perform other standard map functions that are familiar to users of GIS software and are easily learned by less-experienced users.
The video shows the user zooming into a smaller map area, then unchecking the map layer containing an aerial image of Fort Meade to remove the image from the display.
I2VMS allows the user to save the appearance of the map at any time as a "view." A view is saved as an ArcXML file that defines all of the map characteristics necessary to recreate the appearance of the map when the view was saved, i.e., the map extent, what layers are visible, how map features are symbolized, and all other required information.
The Environmental management video illustrates retrieving a view that includes three groundwater management wells within a specified area of Fort Meade.
Views are not static. The user can modify the map at any time, including after retrieving a previously-saved view. This is illustrated in the video by adding a map layer containing contours to a retrieved view.
The data tree is also easily modifiable. The video illustrates adding a new folder to the data tree and adding a document to the new folder. Clicking on a document in the data tree opens the document in the application that Windows associates with the document type. This is illustrated in the video by opening a newly-added Word document, but the concept applies to any document with a defined association to an application in Windows. Examples include images, spreadsheets, databases, and video clips, but the range of document types that can be stored in the data tree and accessed in this manner is essentially unlimited.
The user can also use the data tree to control the map display. This is illustrated by searching for a building by entering the building number, 1900, and initiating the search with an icon on the tool bar. The data tree hierarchy opens to display and highlight the building folder.
Clicking on the building folder opens the folder to display any subfolders and documents it contains. Within this particular building, there is a "Radon Location" folder and a building floorplan. Clicking on the floorplan displays it.
This portion of the video also illustrates how the mouse can be used to display the attributes of a map feature by placing the mouse momentarily over a feature within the current map layer.
The Radon Location folder for this building contains a link to data about radon sampling results for the building. The data are displayed in a pop-up form referred to as an "information screen." Information screens are customized for the particular types of data a user needs to display.
After the user closes the radon information screen and illustrates how the features on individual map layers are only displayed at pre-defined map scales, the user returns the map view to the default view for Fort Meade to illustrate how features in the data tree that are represented on the map, such as buildings, can be located on the map.
The user right clicks on Building 1900 in the data tree and selects "Locate on Map" from the context menu that appears. This causes the building to be selected and highlighted on the map and the Environmental Management video ends.
The Ground Water Management Video illustrates a version of I2VMS
which was customized for ground water management in conjuction with the
closure of Loring Air Force Base in Maine. Figure 2 illustrates a view of
the I2VMS application as deployed for the Environmental Management Office
at Loring AFB. Notice that this version of I2VMS lacks the layer list.
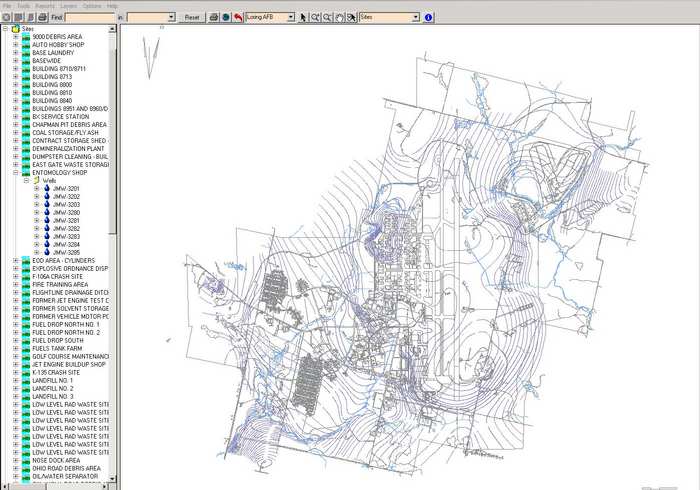
Figure 2. Screen shot of the I2VMS application as deployed for the Loring AFB Environmental Management Office.
In this video, the user illustrates how folders in the data tree contain different types of data, then drills down to the "Entomology Shop" in the "Sites" folder. When the user clicks on this folder, the view changes to show and highlight the entomology shop.
The user then clicks a folder named "Wells" within the Entomology Shop folder to display it's contents: subfolders for each well associated with the Entomology Shop. These subfolders contain further subfolders with water sampling data at various depths. After opening the folder for a depth of 41 feet, the user clicks the information tool on the toolbar and uses it to dislay the data for water samples from this depth and a graph of concentrations of trichloroethene on two sampling dates.
The video ends with the user returning the default view.
The Facility Management Management Video begins with a view of a
developed part of Kwajalein Island showing the shoreline, buildings, and
basemap features. The application as deployed for the United States Army
Kwajalean Atoll Environmental Management Office is illustrated in Figure
3.
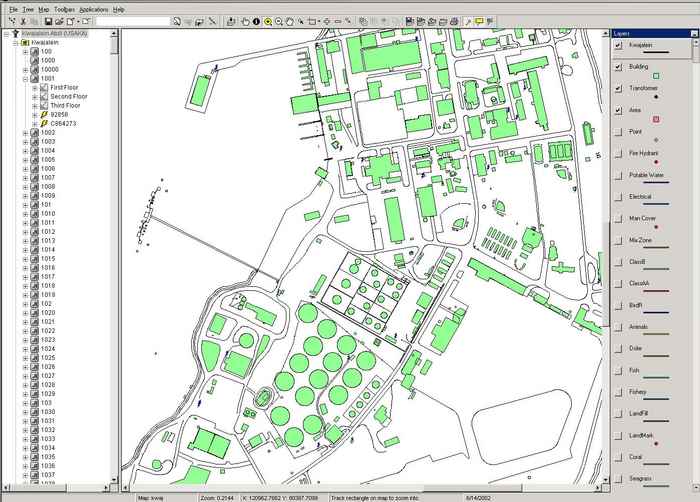
Figure 3. Screen shot of the I2VMS application as deployed for the United States Army Kwajalean Atoll Environmental Management Office.
The user then displays additional features by checking the check boxes next to the desired layers on the layer list.
A "Building Information Screen" is then displayed by clicking on Building 808 near the center of the map display.
After dismissing the Building Information Screen, the user selects the Transformers layer, and then clicks within Building 808 to display an information screen for the transformer located in this building.
The radius select tool on the tool bar is then used to select all transformers within a circular area. This action displays an information screen with multiple records listed, and the user illustrates how to display a tabular report suitable for printing.
Features can also be selected from the data tree hierarchy as the user illustrates by zooming to the tranformer assocaited with Building 1001. After zooming in to the transformer, the user zooms out to display the building along with the transformer.
This deployment of the I2VMS application included building floor plans. The user illustrates how these are displayed by selecting the First Floor folder within Building 1001, then proceeds to illustrate how the mouse can be used to identify features within the Room and Area layers in this view. The information screens for the hazardous materials locker within this building is also displayed and the video ends.
I2VMS has been successfully deployed at nine Department of Defense sites in a variety of roles including environmental management, groundwater management, and facilities management. The core application is designed to be customized for each client and access to each client's data is integrated into the customized application.
The modular design of I2VMS allows it to be easily customized to each
client's needs and to be expanded and upgraded as those needs change. The
easily-learned interface allows users to access and understand
data from a wide variety of sources without having to learn how to use the
more complex tools that data access and data integration normally require.