Kenneth L. Driese
Abstract
Spatial transport is critical for ecological processes, but ecologists lack a formal framework for modeling transport through heterogeneous environmental space. A new book on this topic introduces ecologists to strategies used to model transport in many fields (e.g. hydrology, atmospheric science) and comes with a CD that includes eight example models. We developed an ArcView interface that allows users to adjust model input variables and examine the changes in model output in a spatial context.
Events or conditions that occur at one place in environmental space have consequences elsewhere (Reiners and Driese 2001). The Hayman fire, initiated at a single location on the outskirts of Denver in the summer of 2002, sends a plume of smoke northeastward for hundreds of miles, obscuring sunlight and affecting air quality. The same wildfire transforms over 100,000 acres of land from dense forest to a mosaic of burned and unburned trees, setting the stage for succession in the decades to come. At its hottest, the fire volatilizes water from fuel and generates thunderstorms that produce rain and hail.
While ecologists recognize the importance of transport, they lack a consistent framework for conceptualizing and modeling the wide variety of transport mechanisms that interact in explicit heterogeneous space. Process based, distributed, spatially explicit models, frequently implemented in GIS, offer the opportunity for adding to our understanding of transport from an ecological perspective and for linking multiple vectors of transport that may act together in unexpected ways.
The Hayman fire, initiated at a single location, resulted in the transport of: 1) smoke and ash downwind (atmospheric transport), 2) energy as the burning fire spread and engulfed available fuels (transport by fire), 3) water as volatilized moisture created downwind thunderstorms (fluvial transport), 4) erosion due to the removal of stabilizing vegetation from slopes (fluvial transport), 5) mass movement as devegetated slopes experience slumps and slides (colluvial transport) and 6) animal transport as fleeing fauna carry with them the ecological consequences of animal movement. The point is that simple events in ecological space have both expected and unexpected consequences, and that the transport of matter, information and energy is profoundly affected by spatial heterogeneity.
A book on this topic (Reiners and Driese � in preparation) introduces a conceptual scheme to help ecologists develop spatially explicit models of transport processes. The first section of the book introduces this scheme and the second reviews transport and transport modeling from the perspectives of eight distinct transport "vectors." These include diffusion, wind, water, mass movement, animal movement, light, sound and fire. Each of these vectors has been studied by scientists in various disciplines and in some cases modeling strategies are well developed (e.g. hydrologic modeling, wildfire simulation, etc.). It is hoped that ecologists can apply modeling strategies from these diverse fields to ecological problems. The book includes a CD-ROM containing example models demonstrating spatial modeling strategies for each of the eight vectors. In this paper we discuss the overall purpose of these interactive models and the common model interface we developed in ArcView 3.2.
Objectives
Illustrating modeling strategies from diverse scientific fields requires satisfaction of several specific objectives. First, because one purpose of the book is to introduce modeling in explicit heterogeneous space, model input and output must be spatially explicit. Second, eight models written in a variety of programming languages must run seamlessly so that readers interact with only a few controls. Third, readers should ideally be presented with a standard interface, so that they do not have to learn new controls for each model. Finally, the software interface must be widely used so that many readers have access. ArcView 3.2 customized with Avenue satisfied these objectives and provided the platform that we use on the CD.
Methods
Model Acquisition and Description of Models
Demonstration models linked to each book chapter needed to be spatially explicit, run in a DOS environment (through MS Windows), illustrate each transport vector and run through an ArcView 3.2 interface. In total, eight simulation models were either borrowed with permission from their developers or, in three cases, developed specifically for the book (Table 1).
Table 1. Models included on the CD-ROM to be distributed with the book on transport modeling. The "Code-type" column contains the programming language used by the model and the "Reference" column gives a primary reference to the model developer(s) for each of the eight models.
| Model Name | Vector Represented | Code-type | Reference |
| SnowTran-3D | Wind transport | Fortran77 | Liston and Sturm (1998) |
| Arc.water.fea | Fluvial transport | Avenue | Vieux (2001) |
| Snowdiff | Diffusion | Fortran77 | Massman et al. (1995) |
| Debris-flow | Colluvial transport | Fortran90 | Benda and Cundy (1990) |
| Clarke model | Fire | C | Clarke et al. (1994) |
| Martin model | Animal Movement | Avenue | Phil Polzer (developed for book) |
| Peeper | Sound | C | Kirsten Parris (developed for book) |
| CanopyLight | Light | Fortran77 | Ken Driese (developed for book) |
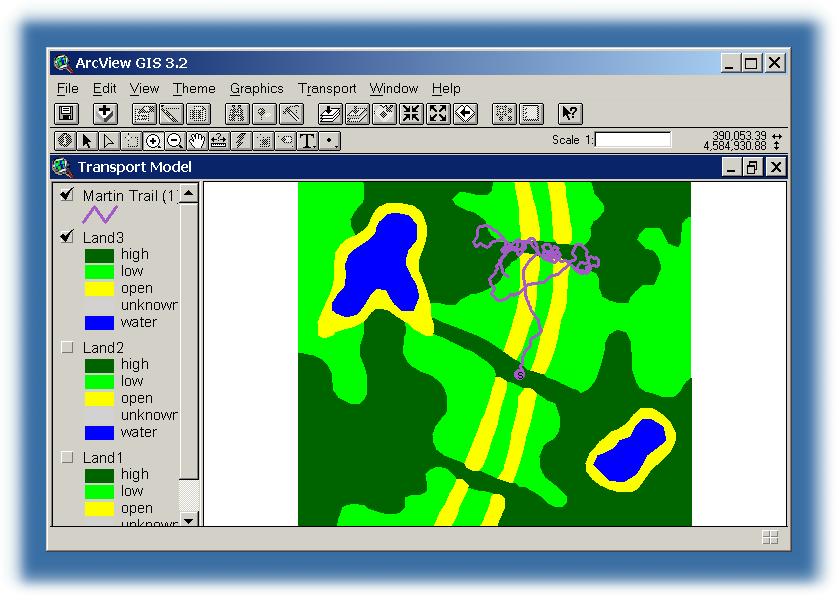
Models were written in several programming languages (Table 1) but all were modified and compiled to run in a DOS environment. Inputs and outputs were rasters in all cases except the animal movement model, which produced a vector trail showing the path followed by the animal as it moved about in simulated areas of variable habitat quality (Fig. 1).
Development of Interfaces
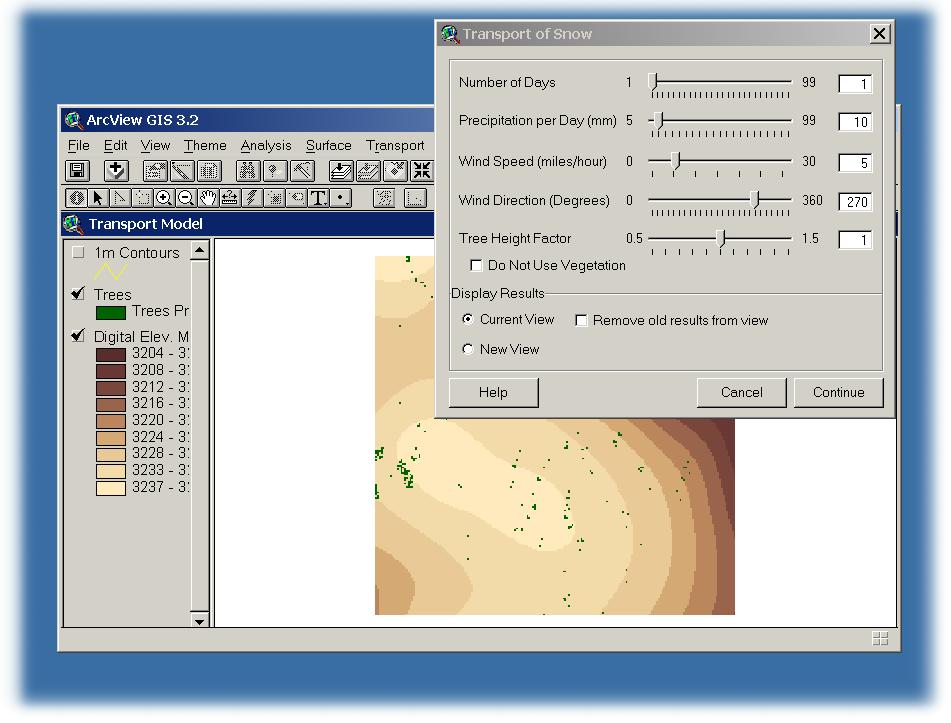
Many of the models used as examples of transport vectors discussed in the book are fully functional research or management tools, with the capability of handling complex inputs and outputs. Additionally, most of these models were built with long lists of input parameters and driving variables which could be tuned by sophisticated users and programmers. To give our readers the opportunity to test the sensitivity of spatial output to changes in only a few key driving variables without grappling with code or parameter files, we used Avenue to create simple, widget-driven interfaces with a common look for all of the models. The interfaces feature slider bars allowing adjustment of input variables within practical bounds. For example, the SnowTran-3D model (Liston and Sturm 1998) which simulates the redistribution of snow by wind on a broad subalpine ridge in Wyoming, is initiated by slider bars that tune the input variables controlling the number of simulated days, the amount of precipitation (snow) per day, the wind speed and direction, and the height of the trees in the model domain (Fig. 2).
Specifically, each model interface is saved on the CD as a separate project (.apr) file. A "Transport" pulldown menu allows the user to start the model interface associated with a transport vector. Once this "choice" (usually there is only a single choice) is made, a dialog box opens that includes the slider bars for adjusting the key input variables. Variable values set with the slider bars are written to an ASCII parameter file read by the model when it runs, thus saving the user from hand editing parameter files. Parameter files are written to a temporary directory on the user�s hard drive since a CD-ROM is unwritable.
A "Continue" button allows the model to run in a DOS window (Avenue ExecuteSynchronous statement) using the adjusted inputs. For some of the models, more complex inputs are adjusted in successive dialog boxes accessed by a "Next" button that leads the user through the process. Each dialog box includes a "Help" button that accesses very basic Help files with instructions and troubleshooting tips.
Several of the models require the user to choose initiation points for transport. The animal movement model, for example, allows the user to place the simulated pine marten at a particular place on the landscape and then simulate its movement beginning from that place. In this case the dialog box features a starting point button that the user pushes to interactively set the start point. This point is marked in the graphical display and retained in the output display after the model runs (Fig. 1).
Finally, the user can choose to retain old model runs for comparison between different input parameter values or to delete them. This is accomplished using radio buttons in the dialog box. A choice is made before running the model each time.
Portability
To ensure portability, the interface writes modified input files and newly created output files to the user�s hard drive. If the default C:\temp drive is not available, the user is prompted for an alternate location. When the user exits from the project, he or she is prompted to either delete or retain the temporary files so that model debris is not retained without their knowledge on their hard drives.
Conclusions
ArcView 3.2 provided an ideal platform for building interfaces to eight demonstration models accompanying a book on the topic of ecological transport in heterogeneous space. The widespread availability of ArcView 3.2 on ecologist�s desktops combined with the flexibility afforded by Avenue customization in a DOS/Windows environment allowed all of the models to be accessed interactively while maintaining a simple, intuitive front end. Slider bars and buttons allowed users to adjust key input variables for each model and observe the resulting change in spatially explicit, graphical output. All of the models and interfaces were easily included on a CD-ROM included with the book.
The interfaces for the models are simple, as they were intended to be. The objective of providing readers with easily manipulated example models with intuitive controls and interpretable inputs and outputs was accomplished using basic Avenue tools and the ArcView 3.2 graphical interface.
Acknowledgements
Thanks to the Andrew W. Mellon Foundation for funding the research that led to this paper. William Reiners is the first author of the associated book and developed much of the theoretical framework for conceptualizing ecological transport in heterogeneous spatial domains. Thanks also go to Phil Polzer for early work on the ArcView interface and to Fred Spataro at Esri Denver for cleaning up loose ends.
References
Benda, Lee E. and Terrance W. Cundy. 1990. Predicting deposition of debris flows in mountain channels. Can. Geotech. J. 27:409-417.
Clarke, K.C., J.A. Brass and P.A. Riggan. 1994. Refining a cellular automaton model of wildfire propagation and extinction. Photogrammetric Engineering and Remote Sensing 60(11):1355-1367.
Liston, G.E. and M. Sturm. 1998. A snow-transport model for complex terrain. Journal of Glaciology 44:498-516.
Massman, William, Richard Sommerfeld, Karl Zeller, Ted Hehn, Laura Hudnell and Shannon Rochelle. 1995. CO2 flux through a Wyoming seasonal snowpack: diffusional and pressure pumping effects. Pgs. 71-79 In Tonnessen, Kathy A., Mark W. Williams and Martyn Tranter (eds.), Biogeochemistry of Seasonally Snow-covered Catchments. IAHS Publication No. 28. IAHS Press, Institute of Hydrology, Wallingford, Oxfordshire, UK.
Reiners, Willam A. and Kenneth L. Driese. 2001. The propagation of ecological influences through heterogeneous environmental space. Bioscience 51(11):939-950.
Vieux, B.E. 2001. Distributed Hydrologic Modeling Using GIS. Kluwer Academic Press, Dordrecht, the Netherlands. Water and Science Technology Series.
Kenneth L. Driese
Assistant Professional Research Scientist
Wyoming Geographic Information Science Center (WyGISC)
Box 4008
University of Wyoming
Laramie, WY 82071-4008
(307) 766-3975 phone
(307) 766-2744 fax
kdriese@uwyo.edu