Architecture
for Managing Vector, Raster, and 3D Geometry in GIS
Dan Brockway, MultiGen-Paradigm, Inc.
Abstract
This paper addresses the creation of real-time 3D presentation graphics as an extension of 2D mapping. The architecture of a 3D GIS presentation system is presented, along with issues for using raster, vector, and 3D data in the development of a 3D real-time database. It addresses the performance trade-offs in the conversion of vector features to 3D geometry using 3D styles; the creation of high performance virtual textures from imagery; techniques for using commercial tools to manage rendering performance at multiple levels of detail; techniques for realtime communication between traditional GIS applications and 3D rendering applications to support correlated eyepoint control and theme/layer display.
Introduction
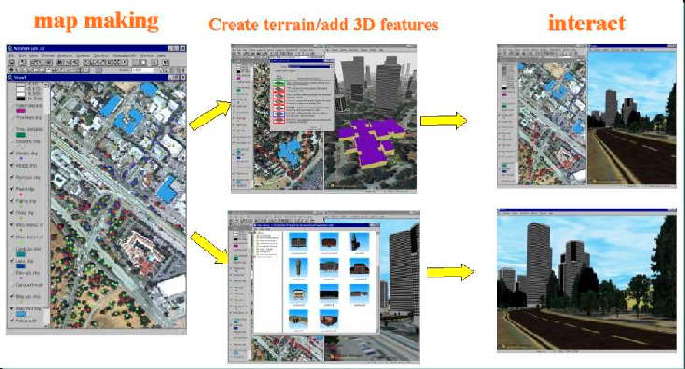
Making an interactive 3D presentation of GIS data is similar to making a 2D map. In both cases the appropriate GIS data layers are selected, attributed, symbolized, and rendered. There are two primary differences between a 2D map and a 3D presentation: time and perspective. Time: A map is a static image that may take minutes or hours to render. A 3D display is interactive, which means that the scene must be refreshed several to many times per second to create the illusion of relatively smooth motion. Perspective: A map is a top down view of the data at some map scale. This means that the GIS data can be treated with the same symbology everywhere on the map. A 3D display is perspective, which means the scale of the data varies with distance from the observer location. This means that there is an opportunity to change the symbology as a function of distance. A successful real-time 3D presentation must balance the desire to ōseeö all the GIS data with the computers inherent performance limitations.
Architecture of 3D GIS Presentation System
Esri has developed a powerful geodatabase model for describing and managing GIS layer data. To support that model, Esri had provided ArcCatalog to manage the data and metadata, ArcToolBox to manipulate the data, and ArcMap to display and edit the data. EsriÆs Geodatabase model provides direct access for all these applications. That is, each time an application needs data, it is fetched from the ōliveö geodatabase. This allows users to simultaneously add value to the geodatabase and to use the geodatabase. This is a very powerful approach and works very well for GIS applications.
Real-time 3D presentations, however, require that the GIS layer data be converted to a form more suitable to the graphics rendering software and hardware, in order to achieve truly interactive performance with life like scenes. EsriÆs 3D Analyst application makes this transformation as the application is running, thus achieving a compromise between having direct access to the Geodatabase and reasonable graphics performance. MultiGen-ParadigmÆs SiteBuilder 3D and Creator Terrain Studio applications use a ōcompiled 3D databaseö approach to achieve maximum graphics performance. In this approach, the GIS layer data is converted to the OpenFlightÖ file format and other graphics-ready formats in a Runtime-Database Generation phase, then the presentation system renders the OpenFlight database.
Both technologies have their place. Direct access to the geodatabase is clearly useful for conducting analysis in traditional GIS applications and compiling a real-time 3D database is required when the interactivity and visual quality of the presentation is of paramount importance. MultiGen-Paradigm has combined these two technologies with the SiteBuilder product. SiteBuilder is an extension to ArcView/ArcMap which uses DDE and Socket communication to maintain synchronization between the Arc Map and the 3D view. A view cone is displayed on the map view to convey the location and view direction of the 3D view. Data Layers from the map view use a 3D legend editor to define the 3D geometric representations much like the Legend editor maps features to map symbols. The 3D legend editor takes care of building the 3D geometry and loading it onto the 3D view.
3D Graphics Performance
Performance of real-time 3D presentation is governed by three primary factors: the performance of the graphics system resident on the hardware (ie the PC), the capabilities of the rendering software, and the content and structure of the 3D visual database. A better graphics card and faster CPU will allow more triangles to be rendered, faster texture downloads, and more texture memory. The rendering software determines the types of data capable of being displayed and the types of controls given to the user. MultiGen-Paradigm provides SiteBuilder 3D, an application for visualizing GIS data, as well as Vega Prime, a programming API toolkit for developing custom applications. Both of these solutions are based on scenegraph technology which employs a three stage rendering pipeline consisting of an ōapplicationö process for the main processing and control loop, a ōcullö process for determining which parts of the scene graph are in the view frustum, and a ōdrawö process for passing graphics primitives to the graphics card.Ā The third factor in the performance equation is the 3D database, which determines the extent and resolution of data to be rendered. No matter how fast the graphics card or how capable the rendering software, the database can always overwhelm the system and cripple performance by delivering excessive geometry or texture to the rendering hardware.. The user of the 3D visualization system can best manage performance by understanding how the database affects performance.
Trade-offs in Database Design
Long after the hardware and software have been acquired, the user will have data to manage and display. The rest of this paper presents strategies for manipulating GIS data so that it makes better 3D presentations.
Given finite graphics system performance, several trades can be made in the 3D database design. Essentially these trades boil down to ōextent vs. resolutionö. In the following illustration, lets assume that your PCÆs graphics card advertises 1.2 million triangles per second, and that you desire a 30 frames per second update rate. First, graphics card manufacturers provide benchmark performance numbers based on ideal conditions for the graphics card. Our experience tells us that a 3D visual database that represents a real place in the world uses triangles in a variety of less than ideal combinations. What this means is that you should expect no more than 25% of the cardÆs rated throughput. Therefore, in our example 1.2 million triangles become 300,000 triangles. Next, you need divide by the desired update rate. Therefore, 300,000 triangles per second become 10,000 triangles per update.Ā
Now that you have 10,000 triangles to work with, how will these triangles be distributed throughout the scene? All three of the diagrams below have the same number of triangles. The first and second diagrams use the single level of detail technique, which spreads the triangles out evenly across the field of view. You can see that with this approach you can have either a small area of high resolution or a larger area of lower resolution.
|
|
|
ĀĀĀĀĀĀĀĀĀĀĀĀĀĀĀĀĀĀĀĀĀĀĀĀĀĀĀĀ
The third diagram shows how the same number of triangles can be distributed over three levels of detail to achieve a large area and high resolution. The high resolution will only appear in the near field.
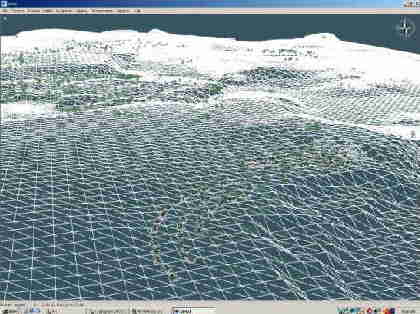
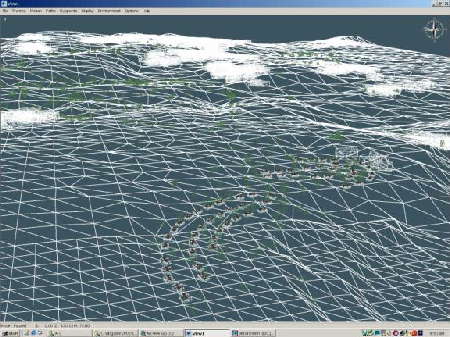
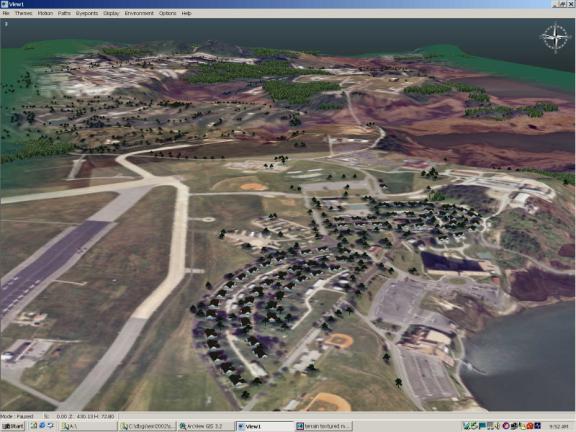
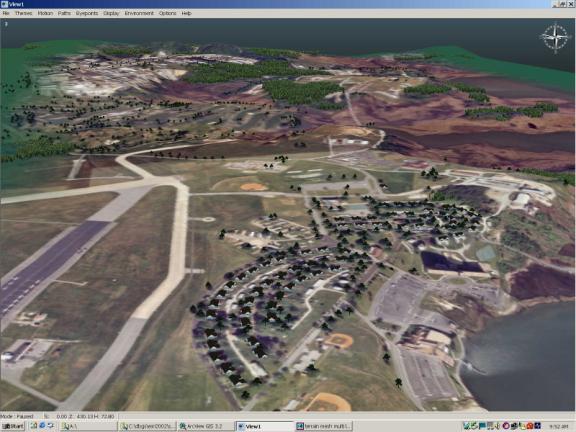
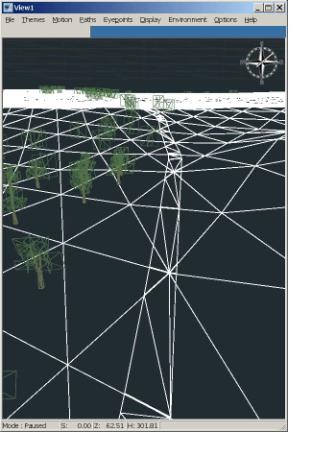
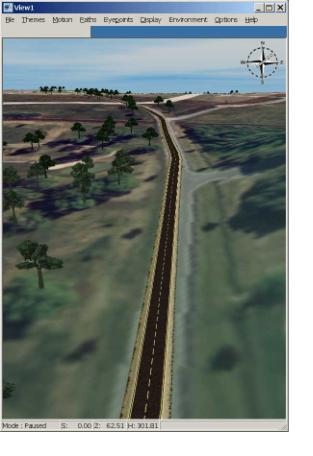
The following screen captures illustrate this point with real data.Ā Visually the same, however, the use of Levels of Detail provide an opportunity to significantly extend the geograph extents of what can be viewed without compromising fidelity in the foreground and performance.
Wireframe view of terrain with single LOD |
Wireframe view of terrain with 3 LODs |
|
|
|
|
Textured view of single LOD |
Textured view of 3 LODs |
|
|
|
Considerations for Vector Features
On a map vector features are represented as lines with various color, line style, thickness, polygons are filled with color and patterns, and 2D icons markers are used to represent points. These same vector features become ribbons of triangles to represent roads conforming to the terrain, or fences and walls on top of the terrain. Polygon features become 3D building extrusions or tree canopies. 3D models are used to represent point features.
All of these forms of 3D representation use triangles. And thus cause load in the graphics system. So, to minimize the load and increase the update rate, line and area features should be generalized (thinned) as much as possible. Each vertex in the vector will yield two triangles for each terrain triangle that it crosses.Ā
3D Models
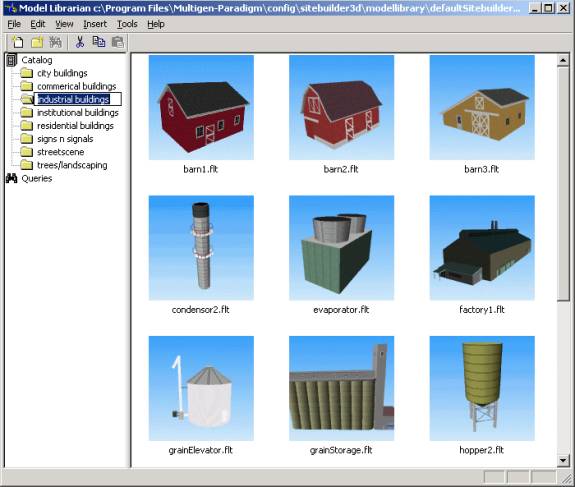
A map display is primarily a symbolic representation. Therefore a relatively small set of 2D icons, or symbols, can be used to represent the GIS features on the map. In 3D presentations, however, the desire to achieve a realistic appearance requires a library of ōtypical 3D modelsö as well as ōspecificö models to represent individual features. MultiGen-Paradigm, Inc. provides 3D model authoring tools, ModelBuilder 3D and MultiGen Creator, to facilitate the construction of 3D models and a Model Librarian tool to manage the library.
3D models have a considerable impact on the performance of the 3D presentation. Take for example a 3D database containing 20,000 tree models. If each tree model consists of 30 triangles, then the graphics system will have to render 600,000 triangles. On the other hand if the tree model consists of only two crossing triangles with a photo-texture of a tree, then the graphics system need only manage 40,000 triangles.
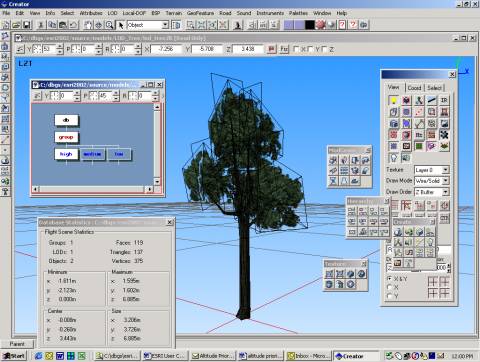
If the model is designed with multiple levels of detail (LOD), then the trees near the observer can contain a large number of triangles and the further trees (which are smaller due to perspective), can contain as few as two triangles, or even zero triangles to make it disappear completely.
|
This tree model uses 119 triangles at its highest level of detail (LOD)ģĀĀĀĀĀĀĀĀĀ |
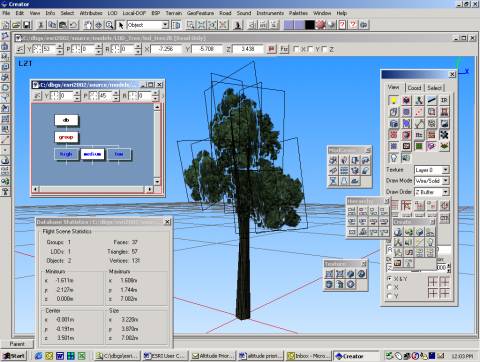
ģ it uses 37 triangles at its medium LOD ģ |
|
|
|
|
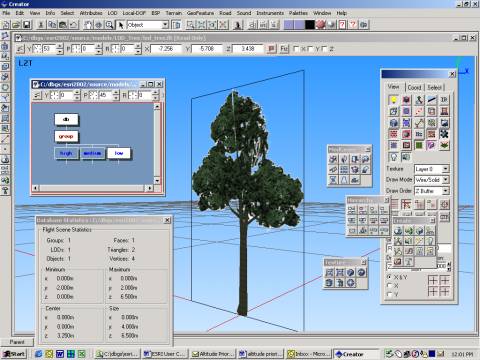
ģ and 2 triangles at its lowest LOD. |
|
|
|
|
Imagery
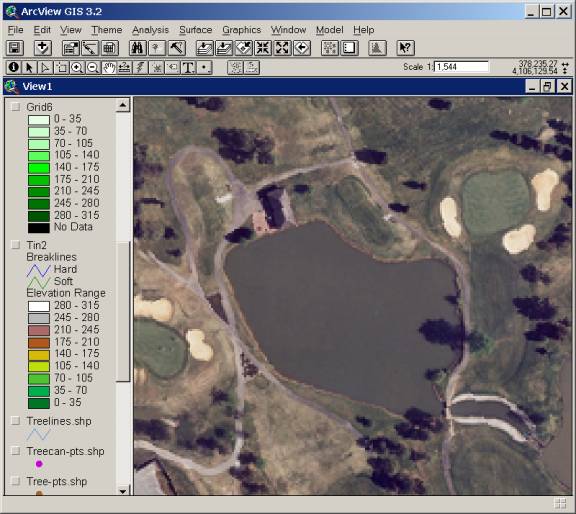
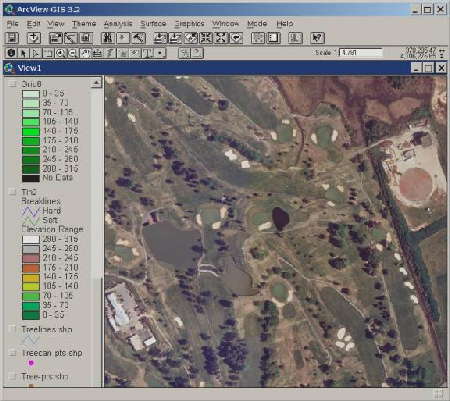
On a 2D map view, an image is rendered orthographically (top down) at a fixed resolution. The amount of data that must be fetched from disk is bounded by the geographic extent of the map view and the display resolution. For example, a map covering 10 miles squared and displayed on 528 pixels squared will need to fetch only the 100ft / pixel resolution of the image. (10mi = 52,800ft / 528 pixels = 100ft /pixel). If you zoom into the image to see the 1ft resolution, then the map display can only cover 580ft squared and thus needs to fetch a very small area within the image.
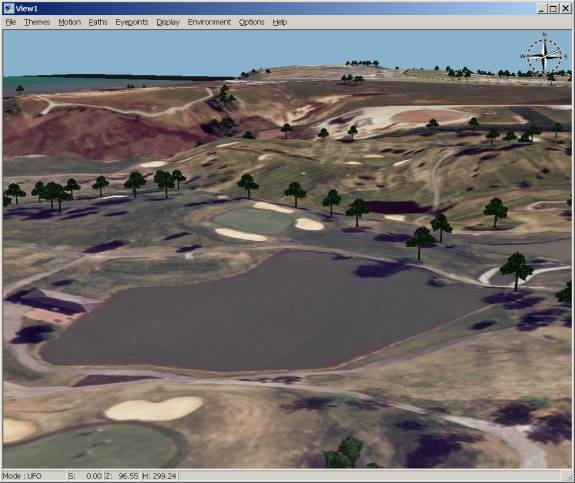
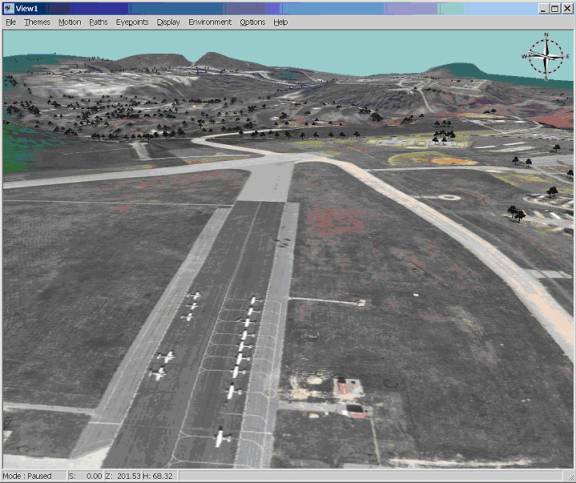
Now consider the perspective view. If the observer is near the ground, the bottom edge of the display may need to render 580 pixels of 1ft imagery. But as the view recedes into the distance the top edge of the display may need to render 580 pixels of 100ft imagery. This dynamic need for image pixels requires that an efficient tile paging algorithm be implemented. MultiGen-Paradigm applications use a technique we call Virtual Texture to achieve this. This approach allows the user to combine many images at various resolutions into a set of files that the graphics system can page independently.
The following ArcView screen shots illustrate the map display resolutions followed by screen shots from SiteBuilder 3D, which illustrate the perspective resolutions.
Ā
|
|
|
|
|
|
Conclusions
3D presentations are a logical extension of 2D mapping. In many ways, the processes of developing a map and a 3D presentation are the same or similar. Understanding the architecture of the 3D presentations system, the capabilities of modern graphics systems, the effect the perspective view has on data demands for the display, and the art of 3D modeling, will help the GIS user make the best of this exciting new frontier.
Author
Dan E. Brockway
Director, Database Products
MultiGen-Paradigm, Inc.
a Computer Associates Company