Abstract
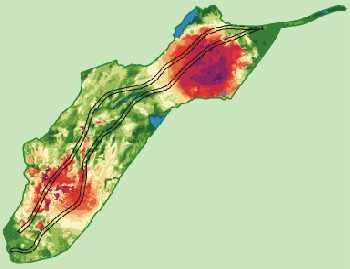
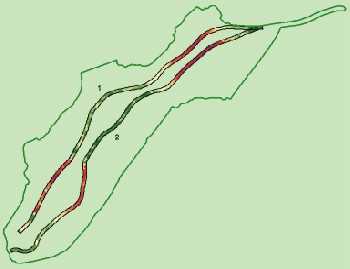
SCETAUROUTE, an international company based in France and specialising in transport infrastructure engineering, has developed a methodology for link selection using GIS/Esri software. A specific database is made-up including a constraints' typology based on a value distribution developed by SCETAUROUTE. With Arc-Spatial Analyst, a thematic constrains' map is realised (agriculture, etc.). Then, a synthesis map including all environmental topics reveals the corridor of lower constraints. Then, with 3D analyst, it is possible to define the "law cost" link. This method has been used with great success for studies (including public consultations) of several projects (high-speed railway, highways, waterways, etc.), in various countries.
The sensitivity of the citizen to the environmental concerns and, consequently the sensitivity of their elected officials, is increasingly sharper in road and motorway projects or railway projects (high speed or freight). The methods thus evolved to be increasingly transparent and solid on the technical and scientific levels. Thus, they are often several tens of layouts which it is necessary to study on the technical level and to test from the point of view of the environment in an iterative way with the interested parts (public, owner building, administrations, etc). It thus becomes current to study several thousands of linear kilometers for a project which comprises only 200 at the end.
Moreover, the always increasing mass of data to integrate, manage, interpret and cross between them, led to the use of Global Information System (GIS) like tool of decision-making aid. The Department Environment of SCETAUROUTE thus developed a methodology of environmental study multicriterion.
The building owners, confronted with tight dialogues and difficult choices, know that "the environment" includes in fact several fields (agriculture, ecology, landscape, habitat and noise, resources surface and underground waters, cultural inheritance, natural and technological risks, geomorphology and geology.) which are difficult to combine between them.
Thus, the ignorance or the undervaluation of the one of them can lead to erroneous choices difficult to correct later on. The overcosts become inevitable then for an effectiveness not always real. It thus appeared essential to release a functional approach of the crossed territory.
This method is pressed on the following bases:
1. A complete listing of the components of the environment: All the topics are concerned, the precision of the contents are adapted on the scale of the studies and the stage of analysis of the project. Each set of themes, corresponding to one (or several) layer(s) in the GIS, is represented by elements (spot, linear or surface shape).That leads to charts sets of themes.
2. The development, within each set of themes, of a matrix of weighting of the components of the environment. This exercise of weighting is the keystone of the method. It must be done on the basis of of strictly objective and factual criteria, and an absolutely transparent way. This weighting must make it possible to qualify the zone of study of kind to highlight the environmental involved sensitivities.The criteria of weighting will be, for example the lawful aspects, the intrinsic patrimonial value that the experts grant to the element considered, the existence of functional relations between the various components of the territory (biological, hydrogeologic, visual, etc)...
3. A clear clarification of the scales of value: What calls one a very strong constraint (even crippling), strong, average or low (even ordinary). Other scales are always possible, this one being given here as an example.
4. The concept of equity enters the various environmental topics: the most traditional error is to make a discrimination between the environmental topics.The hierarchy must be only carried out within each topic.
It is essential to insist on the importance of this step. It makes it possible to establish a true dialogue between the various actors of the project (owner building, public, administrations, associations), outcome with a solid consensus on the respective importance to grant to the various components of the environment. Once established and validated collectively with the whole of the interested parts, the matrix of weighting becomes a collective reference frame. Then, the results of are more easily accepted. Significant projects have benefited from this method during these four last years (preliminary studies and Summary Preliminary draft of the Line High Speed (LGV) Aquitanian, preliminary studies of the LGV Brittany Pays of the Loire, feasibility study within the framework of the public discussion of the southern branch of the LGV the Rhine-Rhone, opportunity study of the LGV Provence the Alps Rivieras, skirting freight of Lyon, etc).
Following a development carried out by SCETAUROUTE, the table assignee is coupled with the matrix of weighting by the GIS, which makes it possible to automatically balance the data charted. This weight, clarified in the matrix and validated collectively, allows obtaining a cartography of the sensitivities, directly resulting from the data-processing treatment and from the data carried out under the module Spatial Analyst. This chart thus constitutes the faithful reflection of the appreciation that the experts and the interested parts give collectively to each environmental parameter.
. The multicriterion synthesis of the sensitivities
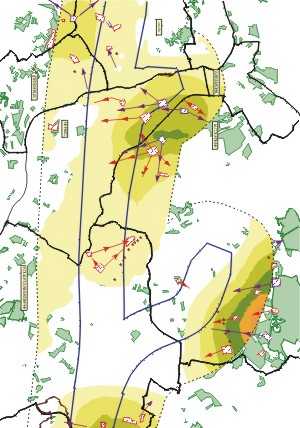
The multicriterion synthesis of the sensitivities results from the office plurality of the territorial sensitivities all confused topics. Each point of the studied surface translated into a value (or total level of sensitivity), the stakes sets of themes which are superimposed on it. In order to prevent that a constraint of very strong sensitivity is interpreted on the same level as an office plurality of sensitivities of quite lower values, a mathematical threshold makes it possible to maintain this distinction. The installation of this threshold between the four levels of sensitivity, which can be of a lawful nature, scientific, economic, and even psychological, is essential to the objectivity of the tool in term of regional planning. It indeed ensures the faithful retranscription of the analysis and the environmental expertise carried out at the time of the initial definition of the sensitivities for each set of themes layer.
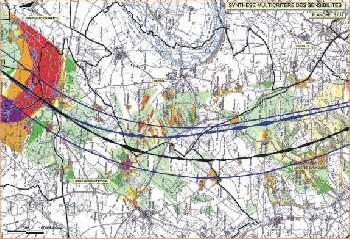
To achieve this goal, made cartographic of this multicriterion analysis is illustrated by means of a chromatic nuancier developed in several levels characterizing of the office pluralities of zones of of the same sensitivity classifies. This visual discrimination of the results makes it possible to minimize the risk of simplification of the stakes on the territory and to preserve a relevance of the tool during phases of decisional analysis and dialogue.
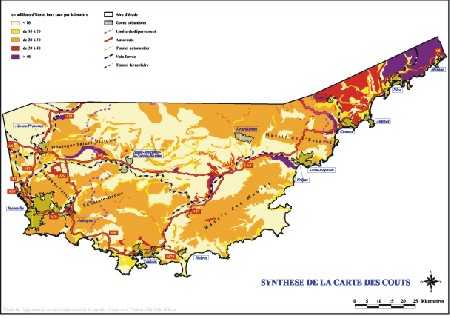
. Charts of cost
The same approach also makes it possible to carry out charts of costs. Experts of SCETAUROUTE determine, starting from the components of environment (slope, hydrography, geology, geotechnics, frame, etc), the cost on the infrastructure induced by each criterion, such as for example, the crossing of a sector of instability of slope. These criteria are then gathered in various sets of themes like land acquisitions, the structures, volumes of earthwork, etc. The superposition of these levels makes it possible to lead to a total chart of costs quantifying the whole of the surface of study from a financial point of view.
. Charts of covisibility
The direct use by the GIS of the digital model of ground (which one supplements by the rise in certain elements as the forests for example) makes it possible to carry out charts of covisibility on vast territories. By crossing between them the charts of analysis of the territories produced by the landscape designers (installed on the GIS), the charts of covisibility and the layouts in 3D, it becomes possible to highlight the conditions of insertion of the project on the landscape and visual levels (interception of significant landscapes, zones subjected to the sight since urbanized sectors or since of other infrastructures, etc).
. Concept of vicinity
The use of the module "Space Analyst" in the GIS also allows the application of the concept of vicinity which consists of the characterization of a unit of an area according to what surrounds. Within the framework of the studies of Summary Preliminary draft of the Southern LGV Atlantic Europe, the method of the " wooded indices ", which is a statistical method highlighting the function of wood in the exchanges between sources environment of the large fauna (wild boars, roe-deers, stags), was used. A "forest digital model" was thus calculated in order to seek the zones of corridors (zones of strong probability of presence of the forest species) and to locate thus the works of transparency specific to the large fauna.
. Statistical calculations
The capacities of calculations and enumeration of the SIG also make it possible to characterize each solution of layout and thus form integral part of the comparative studyes of alternatives. The SIG, supplied with data resulting from other software (Macao, Mithra.) and the environmental data makes it possible to carry out a certain number of calculation statistics contributing to the comparison of the alternatives of a layout, such as for example, of calculations of surface of influence, the enumeration of the number of dwellings concerned with a given isophone, etc.
Since their invention by Jack. DANGERMOND in 1969, the GIS experienced a very vast development in the regional planning. The greatest urban communities perfectly understand it and use it for the management of the land, for the networks and for the programming of installations. In the same way, in the field of the natural or technological risk management, the GIS offer a panel of functionalities extremely rich and useful.
At the Department Environment of SCETAUROUTE, the GIS thus became the core of a broader system of assistance to the design of project. Indeed, concerning the infrastructures of transport, these tools, been useful by serious methods of analysis of the environmental constraints open considerable possibilities: description of the environmental stakes, studies multicriterion, assistance with the design of project and communication/concertation, management and maintenance of the infrastructure in service.
Marc MEREAU
Docteur en biologie
Ingķnieur des travaux publics de l'ķtat
Chef du Dķpartement Environnement de SCETAUROUTE
Adress : Scetauroute, Dķpartement Environnment,
40 avenue de la Marne PB 87
59 442 Wasquehal Cedex
FRANCE
Call : ĀĀĀĀĀ(00 33) 3 20 69 24 19
m.mereau@scetauroute.fr