Kinya Kamishima , Koumura Keita
Pasco Corporation, System Engineering Division
In urban area in Japan, heat island phenomenon, in which heat is confined, is causing much
trouble. It is known that the repression of rise in temperature is effective by
green in urban area. Therefore, administrations proceed with the policy
increasing green. But, the distribution of green including that on the rooftops
has not been grasped precisely in the present condition.
green position character spatially, the places covered with green was extracted
from ADS40 image, and it was analyzed using GIS. As a result, we could find the
size of potential space to increase green. Analytic results by GIS became useful in order to increase green effectively.
In Japan, the heat island phenomenon is occurring in urban areas where heat builds up through the artificial ground surface cover, the increase in artificial waste heat, and the extreme advancement of the destruction of natural environment. This phenomenon is leading to social problems in the form of increased high temperatures during the daytime and tropical nights. In particular, the energy consumption rate for air conditioning during the summer months is increasing drastically, with the adding result of increased artificial heat loss, and marked increases in emissions of carbon dioxide.
In response to this social problem, Japan's administration is struggling to grasp the problem issues and studying what countermeasures to take.1 As one of effective countermeasures, greenery to urban cities through greening on the rooftops and walls is planned. Since there is little space for greenery particularly in urban areas due to continuing urbanization and construction of buildings closer and closer together, adding greenery to rooftops is currently taking high importance. Through actual experience and experimentation in rooftop greening systems by landscapers and materials makers, etc., it has been recognized that rooftop greening can contribute to lowering of daytime temperatures.
In order to increase the greenery in urban areas, one of the measures being implemented by the administration is to make it obligatory in the case of renovation or new construction of buildings with an area above a predetermined size to carry out rooftop and related greening.2 However, the actual conditions of rooftop greening and the portion of rooftops where greening is possible have not been sufficiently ascertained, and thus no appropriate urban greening measures have been implemented.
In the Tokyo Metropolis and other urban areas, aerial photographic surveys have been used to judge the distribution of urban greenery every few years. However, the extraction of greenery from aerial photographs not only entails a large amount of labor and time, but there are other problems that arise, such as variations in the accuracy depending on the persons making the judgment. In particular, there are many small scale green areas in a city, and it requires large volume and precision operations to digitize the results of these surveys. For that reason, there are few cases where digital data are being created. This means that the results of the surveys remain in a state where they are difficult to arrange and analyze, and are not being used sufficiently in the implementation of urban greening measures.
In recent years, with the widespread use of GIS, analyses of current land use conditions using GIS have been performed in various fields and the results used in city planning. Superimposition with other data, etc., it has made it clear that this is an effective means of analysis and evaluation. If it becomes possible to convert urban greenery information to digital data simply and accurately, it is thought that it will be possible to implement extremely detailed measures through the use of GIS in the field of urban greening.
In this article, we describe the extraction of green (vegetation) in an urban area automatically using highly sensitive digital aerial photography and the determination of current rooftop greening conditions. We also studied extracted rooftop space where greening is possible and performed calculations of the rooftop possible greening area as well as measures for applying these data to urban greening measures.
The ADS40 is based on the three-line-scanner principle, developed by LH Systems, and the linear arrays on the focal plane capture imagery looking forward, downwards and backwards from the aircraft. The sensor simultaneously captures strips of imagery with linear CCD arrays. Panchromatic imagery is captured looking forward, nadir and backward from the aircraft. Near infrared information is also captured nadir, whereas the red, green and blue color bands are forward looking. Therefore, it is possible to photograph a multi-spectral image with near infrared added to the red, green and blue RGB image. The result of enabling photography of near infrared images is that it is expected that the ADS40 will have potential not only for map making but also for other uses such as environmental monitoring. Since there is no titling of the light axis with respect to the direction of aircraft travel, the nadir images are said to have the feature where there is little falling away of buildings and trees due to center projection as in normal aerial photographs.
Image data from April 5, 2002 photographs were used as data.
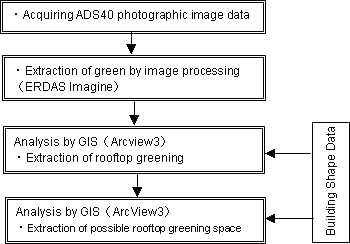
In order to acquire the distribution of green in the urban area rapidly and as highly accurate data, the following method was used for extracting the green (Figure 1).
Figure 1 Process flow
ADS40 Images were processed by ERDAS IMAGINE, with the green portions only extracted, then the data were converted as a shape file. The followings were conducted:
Acquiring of reference data which become the extraction object.
Acquiring of images based on the reference data.
Conversion to a shape file. (Shape files were written using ArcView Image Analysis.)
The green data extracted in the previous item were superimposed on building data using the GIS software ArcView3, then rooftop greening areas were extracted.
The green shape files (polygon) and building shape files (polygon) underwent clip processing.
We conceived of buildings not made with wood construction as buildings where greening could be implemented on the rooftop, then extraction was done in accordance with the building data. Next, while comparing the data with the ADS40 images, the spaces where greening was possible were extracted. The following points were given consideration when extracting spaces where greening was possible.
· Parts where the wall surfaces were inclined were excluded from the possible greening spaces through slanted line rules, etc.
· Of the parts of rooftops, the portions which could be distinguished as air conditioning facilities were excluded from possible greening spaces.
The images captured by the ADS40 were analyzed, then image data with only the green portions extracted were created. The files thus created were then converted to shape files by ArcView3 (Figure 2).
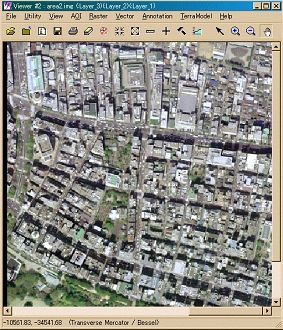
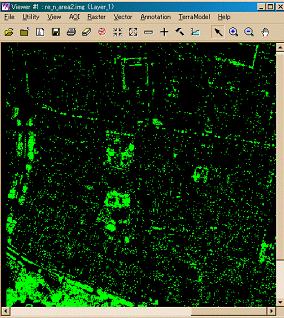
Figure 2 Green Extracted from Images
A 500 m x 500 m area was divided into 3 areas, then rooftop greening areas were extracted and shape files (polygon) were created. The surface area, etc. of the rooftop greening areas in each area were also calculated (Figure 3 and Table 1).
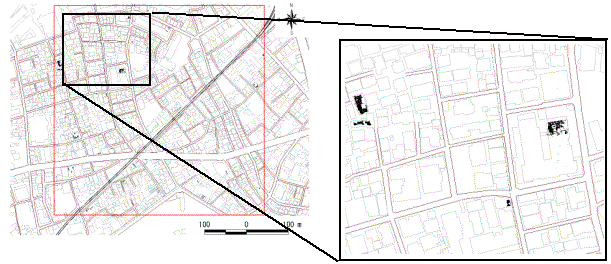
Figure 3 Extraction Result of Possible Rooftop Greening Space
Table 1 Green Surface Area in Each Area
|
Area Surface Area (A) |
Surface Area (B) |
Rooftop Greening Surface Area |
Green Rate (C)=(B)/(A) |
|
|
High Rise Building Area |
250,000m2 |
52,827m2 |
687m2 |
21.1% |
|
Office Building Area |
250,000m2 |
14,889m2 |
410m2 |
6.0% |
|
Residential Area |
250,000m2 |
17,896m2 |
350m2 |
7.2% |
The Figure 4 and Table 2 show the results of the greening areas.
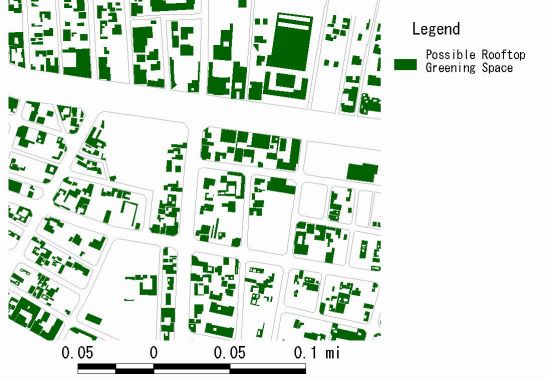
Figure 4 Extraction Result of Possible Rooftop Greening Space
Table 2 Rooftop Greening Surface Area by Area
|
Possible Greening Rooftop Surface Area (A) |
Rooftop Greening Surface Area (B) |
Rooftop Greening Rate (C) = (B)/(A) |
|
|
High Rise Building Area |
35,518m2 |
687m2 |
1.9% |
|
Office Building Area |
52,208m2 |
410m2 |
0.8% |
|
Residential Area |
32,086m2 |
350m2 |
1.1% |
The surface area where greening is possible is comparatively small because air conditioning and other facilities are located on the roof of high rise buildings.
There are a lot of strongly built medium high rise buildings, and the surface area where greening is possible is large compared to the other areas. There are also buildings where the walls are slanted due to slanting regulations, etc. and the rooftop area is small.
In this area, the proportion of homes with 2 or fewer floors and gable roofs is high. Strongly built buildings with flat roofs constitute about half of the structures in this area, so the rooftop surface area where greening is possible is small.
We calculated the possible greening rate for each area using the data created in the previous item, if greening is done on those rooftop areas where greening is possible.
In the possible greening rate calculations, we calculated three patterns, if we have 20% of rooftop greening surface area be used for greening, if we have 50% and if we have 100% (Table 3, Table 4 and Table 5).
Table 3 Possible rooftop greening area if 20% is used for greening
|
Units:m2 |
|
Area Surface Area |
Green Surface Area (Current Condition) |
Green Rate |
Surface Area of Rooftop Where Greening is Possible |
Green Surface Area (Planning green surface area) |
Green Rate |
|||
|
Rooftop Greening Portion |
Rooftop Greenery Portion |
|||||||
|
High Rise Building Area |
250,000 |
52,827 |
687 |
21.1% |
35,518 |
59,244 |
7,104 |
23.7% |
|
Office Building Area |
250,000 |
14,889 |
410 |
6.0% |
52,208 |
24,921 |
10,442 |
10.0% |
|
Residential Area |
250,000 |
17,896 |
350 |
7.2% |
32,086 |
23,963 |
6,417 |
9.6% |
Table 4 Possible rooftop greening area if 50% is used for greening
|
Units:m2 |
|
Area Surface Area |
Green Surface Area (Current Condition) |
Green Rate |
Surface Area of Rooftop Where Greening is Possible |
Green Surface Area (Planning green surface area) |
Green Rate |
|||
|
Rooftop Greening Portion |
Rooftop Greenery Portion |
|||||||
|
High Rise Building Area |
250,000 |
52,827 |
687 |
21.1% |
35,518 |
69,899 |
17,759 |
28.0% |
|
Office Building Area |
250,000 |
14,889 |
410 |
6.0% |
52,208 |
40,583 |
26,104 |
16.2% |
|
Residential Area |
250,000 |
17,896 |
350 |
7.2% |
32,086 |
33,589 |
16,043 |
13.4% |
Table 5 Possible rooftop greening area if 100% is used for greening
|
Units:m2 |
|
Area Surface Area |
Green Surface Area (Current Condition) |
Green Rate |
Surface Area of Rooftop Where Greening is Possible |
Green Surface Area (Planning green surface area) |
Green Rate |
|||
|
Rooftop Greening Portion |
Rooftop Greenery Portion |
|||||||
|
High Rise Building Area |
250,000 |
52,827 |
687 |
21.1% |
35,518 |
87,658 |
35,518 |
35.1% |
|
Office Building Area |
250,000 |
14,889 |
410 |
6.0% |
52,208 |
66,687 |
52,208 |
26.7% |
|
Residential Area |
250,000 |
17,896 |
350 |
7.2% |
32,086 |
49,632 |
32,086 |
19.9% |
Since the rooftop surface area where greening is possible in the high rise building area and the residential area is small, the increase in the possible greening rate due to rooftop greening would only be 2 - 3%, but in the office building area, the amount of possible roof area where greening can be implemented is comparatively large, so the rooftop possible greening rate is 4%.
In this way, if the amount of rooftop surface area where greening is possible is large, then rooftop greening can make a large contribution toward increasing the green rate for the area as a whole (Figure 5).
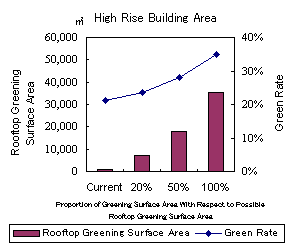
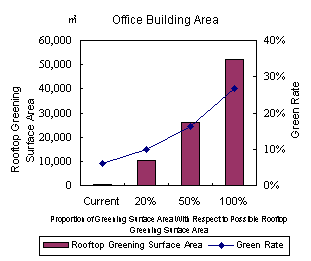
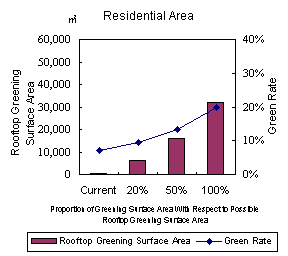
Figure 5 Relationship Between Rooftop Greening Surface Area and Green Rate
In areas which were not directly underneath the photography course, the buildings look like they are falling away. This deviation is particularly great in the case of high rise buildings, so there is some deviation between the building shape positions and the green on the rooftops.
In the case of parts with a lot of deviation, the green position was corrected to the building shape using ArcView3.
In parts which are in the shade, there is little difference between the parts that are covered with green and those that aren't, and a lot of reading of parts other than green areas occurred.
In large shaded areas, judgment of the images was made visually, then extraction was done of only those portions where green was recognized.
Since the distribution of green in the urban area could be created as digital data, it is possible to implement appropriate urban greening measures through the utilization of GIS. One concrete example of such utilization is shown below, with result that the amount of green can be increased.
By converting the green portions into digital data, then superimposing background data showing the shapes of buildings and roads, a simulation of greening can be performed easily on a personal computer. The rooftop greening surface area and other green areas can also be combined to calculate the green rate, so it is possible to set a definite greening target (Figure 6).
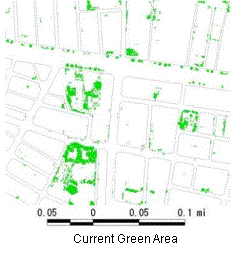
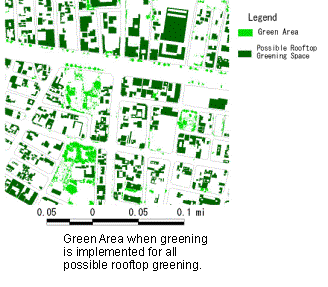
Figure 6 Simulation of rooftop greening
In an urban area, land use is fixed, and the possibility of creating new green areas, etc. is low, so the amount of green surface area that can be added through additional rooftop greening is great. For that reason, it is possible to set realistic high target values for green rates through estimation of the rooftop greening surface area. In addition, any pattern of rooftop greening proportions can be set and comparison made with the green rate.
It is also possible to combine the image in the case of rooftop greening implementation and a map. Since it is possible to show the public the visual results of greening as well as the necessity for rooftop greening, this can be used to heighten the awareness of the public to urban greening.
The necessity for green areas in cities through a basic green plan, etc. is being proclaimed from various viewpoints, such as improvement of the urban environment, fire prevention and sightseeing advantages, and there is a tendency toward preserving nature and increasing the amount of vegetation. However, there are very few examples of concrete greening measures being conducted, and of actual improvements in the urban environment that can be seen visually. In particular, urbanization is still continuing at an extremely high rate, and in urban areas where there is very little nature left, methods for accomplishing greening are limited, so it is quite difficult to see the results of urban greening come to the surface.
It is also difficult to see any awareness on the part of the public of results that they can actually see with their eyes, so even if they recognize the necessity of vegetation around them, the actual condition of most people is that their consciousness with respect to urban greening is low.
Through the methods demonstrated in this article, it has become possible to easily give a visual expression of the actual conditions of greenery in the city and the problems that we all face. We think that we can express the urgency of and results or urban greening in such a way that it is easy to understand, and that this will serve to heighten people's awareness of greening.
In addition, we think that if we increase the amount of greenery in urban areas by promoting rooftop greening and to monitor heat loss, the heat island phenomenon can be alleviated and this will contribute to improvements in the problem of global warming. For that reason, in the future, we would like to determine the extent to which the urban environment is improved by urban greening efforts, studying analysis and evaluation methods using GIS.
1) Year 2000 Report (Supplement edition) on an Analysis of the Actual State of the Heat Island Phenomenon and the Countermeasures the Need to be Taken October, 2001, Environment Ministry
"Tokyo Basic Environmental Plan" Tokyo Metropolis, January, 2002.
2) Preservation of Nature and Examples of Recovery in Tokyo (Revision) Tokyo Metropolis, December, 2001.