|
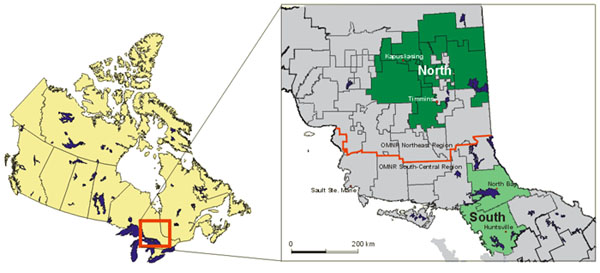
| Figure 1. Spatial feasibility assessment study area. |
We assessed the spatial feasibility for intensifying forest management for a forest area over 8 million ha in Ontario Canada. All land use policies and regulations were translated into spatially explicit rules and applied as a hierarchical filter based on compiled forest inventory and values data. In addition, we modelled several landscape ecological processes to provide biological context to evaluate legally feasible areas. GIS-based decision support tools were developed to interactively analyze feasibility scenarios at both strategic (corporate, regional) and tactical (management-unit) levels. We describe data compilation challenges, spatial filter construction, development of software tools, and use of the results.
Intensifying forest management (IFM) has become an increasingly important issue for forest managers. It is seen as one solution to meeting challenges of conservation, wood supply, and multiple use on the landscape. While recognized by recent provincial land use strategies such as Ontario's Living Legacy (OMNR 1999), the existing forest policy framework in Ontario does not contain provisions for IFM. In addition, most current policies have not been assessed spatially over large areas for their impact on current forestry or IFM. In this context, a method was needed assess the spatial feasibility of IFM to determine if policy and land use conflicts can be minimized while still providing ecologically optimal sites for IFM.
Tembec (one of the largest forest companies in Canada), the Ontario Ministry of Natural Resources (OMNR), the Canadian Forest Service (CFS), and the Canadian Ecology Center (CEC) developed a multi-year forestry research partnership to develop and conduct scientific investigations on intensive forest management (CEC 2000). Under this partnership, we developed a project to spatially assess the feasibility for intensifying forestry management on Tembec’s forest land base, given Ontario’s current forest policy framework. The goals of this study were to:
In this paper, we describe the data compilation challenges and GIS methods used in the assessment, the types of questions that can be answered with the information generated, and how the software tools can be used to assess IFM feasibility and generate spatially explicit strategies at multiple scales.
The spatial feasibility for IFM was assessed on over 8 million hectares of Tembec’s licenced area (Figure 1). Factors influencing the feasibility for intensifying forest management operate at many temporal and spatial scales. Spatially, these range from sub-stand scale factors such as species competition to regional-scale factors such as protected area strategies. Temporally, they range from seasonal factors such as forest protection from hazards, to long-term factors such as soil nutrient changes. Top-down, hierarchical approaches are often more effective in organizing multi-scale systems than bottom-up methods; they permit rapid assessment, allow efficient use of resources, and provide the necessary context to smaller-scale processes (e.g., O’Neill et al., 1986, Allen and Hoekstra 1992).
|
|
| Figure 1. Spatial feasibility assessment study area. |
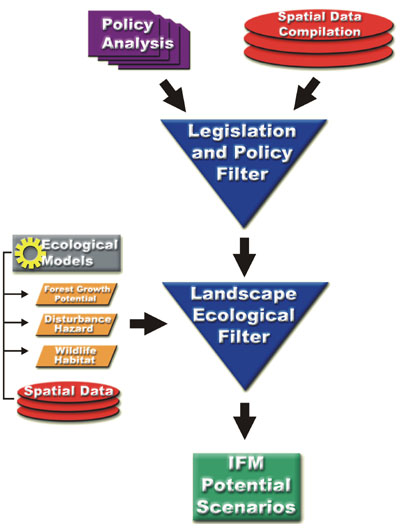
Using a top-down approach we developed an analysis framework (Figure 2) based on two hierarchical filters – a legislation and policy filter (existing legislation, policies, and guidelines influencing forestry) and a landscape ecological filter (large-scale ecological spatial data relevant ecological assessment of IFM areas). Each filter was developed using a suite of spatial data compilation and analysis steps. Application of these filters resulted in IFM potential scenarios developed using a suite of multi-scale, software tools created for this project.
|
| Figure 2. Spatial feasibility assessment analysis framework. |
A comprehensive set of federal, provincial, and municipal legislation, policies, and guidelines related to land use, wildlife, and forestry was examined. Large and medium-scale policies and guidelines were scrutinized for their ability to produce explicit spatial rules for analysis (e.g., 300 m area of concern buffer around nesting sites). Policies and guidelines which did not have any explicit spatial direction and those with spatial direction but without adequate supporting data were not included in the analyses. Fine-scale policies and guidelines related to species-specific silvicultural decisions made in the field were noted but not analyzed due to a lack of consistent fine-scale data.
A final set of over 200 spatially applicable policies and guidelines was reviewed by OMNR policy experts. These policies and guidelines were categorized into IFM feasibility classes based their specific limits on forest practices (e.g., spatial limits, harvest method limits, timing restriction limits). Three feasibility categories were developed:
Four main spatial data sets were used to translate the policies and guidelines into spatially explicit policy constraints for IFM:
These data represented a wide range of types (points, lines, polygons, rasters), formats (ArcInfo coverages, grids, export files, ArcView shapefiles), scales (1:20,000 – 1: 1,000,000), projections (UTM, OBM, Lambert), and datum (NAD 27, NAD 83). Data were compiled across each Tembec region to ensure consistent analyses, and to eliminate artificial boundaries in the data (e.g., Management Unit boundaries). Data were also obtained for the area surrounding each region whenever possible to minimize the effect of the study area boundary. Most of the data preparation involved obtaining data across each region, usually maintained by Ontario Base Map (OBM) 1:20,000 sheet, and joining them into regional data sets in the same projection. Although data content was not altered in this project, significant time was required to standardize data fields and attributes across all data sets for each region and remove overlapping data among districts or management units (MU).
Policies and guidelines from the policy analysis were combined with spatial data to create spatially explicit policy constraints for IFM. One of the most important principles in this process was the compilation of these explicit rules by region rather than individual MU. This was important to ensure that the influence of features from adjoining MU’s was captured in the final dataset for each MU.
Policy constraints were constructed from either features defined directly in the input data (e.g., park, wildlife wintering area), or from features derived from the input data, usually through buffering (e.g., nest buffers, aerial spray buffers). Most buffering was completed in ArcInfo 7.2, however some very detailed features including some of the parks and conservation reserves were too complex, causing ArcInfo to crash. In some cases, these features were singled out, buffered, then added back into the regional coverage. In some cases, single features were still too complex to buffer in ArcInfo probably due to the large number of vertices resulting from stream digitizing. Rather than compromise line accuracy by thinning the number of vertices, these features were buffered using ArcView 3.2 and added back to the regional coverage (ArcView does not have a vertex limitation but would have been much slower for performing all buffering).
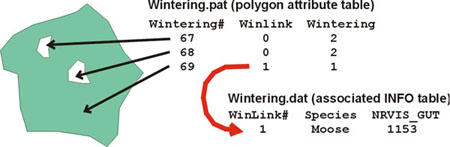
A separate regional layer was constructed for each policy constraint to facilitate updating by individual layer. Rather than maintain all detailed attributes from the input dataset in the regional layers, we removed these items and placed them in a separate INFO table (Figure 3). A unique identifier was included in the regional layer and the INFO table so that these attributes could be linked again for querying the final database. This simplified the standardization and overlaying of regional layers required to create the final dataset.
|
| Figure 3. Coding scheme for features to create regional layers. Information from the original wildlife wintering areas coverage (wintering.pat) was placed in a separate INFO table (wintering.dat) and new items were added to link to this information (winlink) and to specify within (wintering = 1) and non-constraint (wintering = 2) area. |
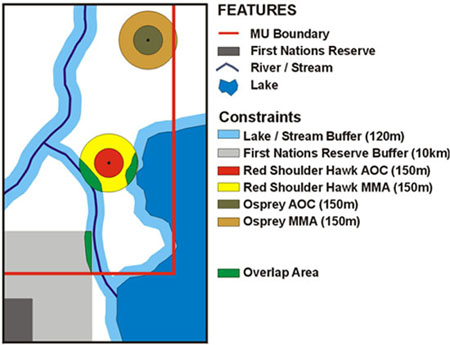
Regional constraint layers were combined using ArcInfo (union) to create a final policy layer. The data set included all constraints with items for each constraint and associated buffers, as well as items that link back to the detailed information tables for each regional constraint layer. This allowed us to query a single layer, while still maintaining information about all overlapping areas e.g., what constraint(s) affect or don’t affect every location in the study area (Figure 4). We could perform queries in two ways; by each constraint independently (e.g., find all area in park buffers), or by a spatial hierarchy to avoid duplication when the combined area for multiple constraints was calculated (e.g., find all areas in park buffers that are not also in stream buffers).
|
| Figure 4. Example of the final policy layer structure. All constraints were represented in a single layer with overlap areas containing information about all overlapping constraints. |
The regionally-constructed composite policy layer was cut by MU to distribute to each MU planning team. Each composite policy layer was combined with FRI to allow querying of FRI attributes such as species and age of forest within the various constraint categories. These final policy layers were converted to a raster to improve the efficiency of spatial querying. The large polygon data set includes many sliver polygons along common constraint edges. Many of these very small polygons were eliminated in the raster, while still maintaining fine detail with a grid of 10m x 10m resolution.
The ecological filter was developed to add ecological context and help refine IFM area selection. Spatial surfaces were generated to provide information on forest growth potential (e.g., growing degree days, soil moisture), disturbance hazards (e.g., fire hazard rating, budworm hazard rating), and wildlife habitat (e.g., capability for Marten). These surfaces were generated through a combination of existing data sets and output of ecological processes modelled at the regional level. For example, the growing degree day surface was obtained from an existing data set (OMNR 2000), while fire hazard was obtained through spatial simulations using the Boreal Forest Landscape Dynamics Simulator (BFOLDS) (Perera et al. In press).
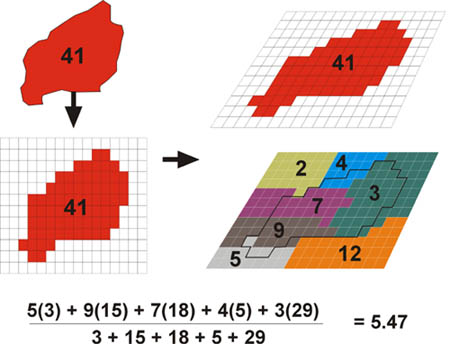
The ecological information was combined with the final policy constraint database to allow simultaneous querying of policy constraints and ecological conditions (e.g., high IFM potential and low fire hazard). A raster-based approach(Figure 5) was used to add these values based on area-weighted dominance for discrete surfaces (e.g., soil texture) and area-weighted means for continuous surfaces (e.g., growing degree days).
|
| Figure 5. Raster-based approach to adding ecological values to final data set polygons. Area-weighted mean of the continuous ecological values is calculated for the polygon. |
Using the combined policy and ecological datasets, we generated maps, tables, and graphs to summarize IFM feasibility by the various contexts (feasibility class, longevity, source) at the corporate, regional, and management unit level. The details of these analyses will not be discussed here, however, the means of consolidating this information is an important part of this project. The volume of data generated from these analyses and the number of spatial questions that could be answered using this information necessitated the creation of a set of multi-scale user tools.
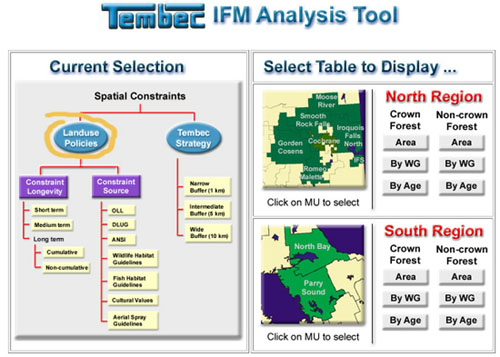
Two user tools were developed to query and summarize the spatial data and project results. A web- based tool was developed to navigate the final results tables for the project. This tool was designed for non-GIS users to summarize the IFM spatial feasibility at a corporate planning level. It allows rapid navigation of the results by policy context for the two Tembec regions as well as by MU (Figure 6). Results can be compared between regions and among MU's at the same time. Area within each feasibility level can be summarized by FRI age-class and working group. This tool was developed in HTML and requires a recent version of a common java-capable web browser (e.g., Netscape 5.0, IE 5.5).
|
| Figure 6. Web-based results query tool interface. |
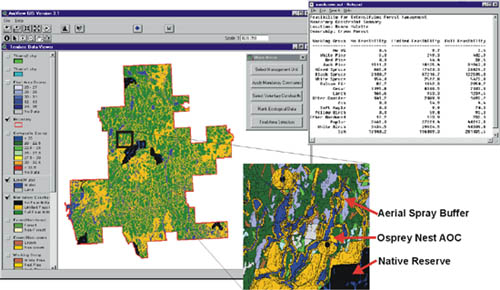
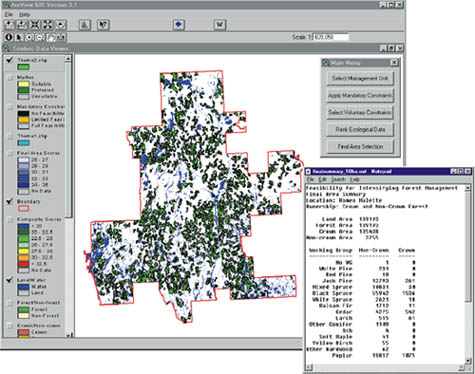
A spatial query tool was developed for GIS and non-GIS users at the MU level. This tool provides querying, ranking, summarizing, and visualization functions to access all policy constraints and landscape ecological data. Users can perform spatial queries, order and re-order spatial constraints, rank ecological layers and create composite scores for IFM area selection, and compare selected IFM areas to wildlife habitat maps. The tool is ArcView 3.2-based (written in Avenue) but does not assume the user knows ArcView. Non-essential functionality was removed to simplify the interface and the user is guided through the analysis process, with only the relevant options made available at each step. This tool uses raster data to provide queries and maps efficiently so that many scenarios can be analyzed and compared.
As mentioned, presenting the specific analyses and summaries prepared for the project is beyond the scope of this paper. We will instead present how the results can be used by Tembec, the types of questions that can be answered with the information generated, and how the software tools can be used to assess IFM feasibility and generate spatially explicit strategies from the corporate to MU scales.
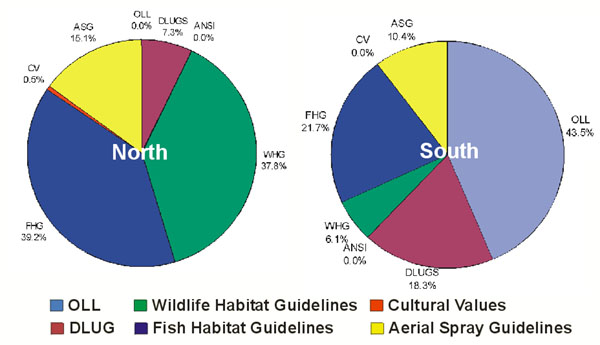
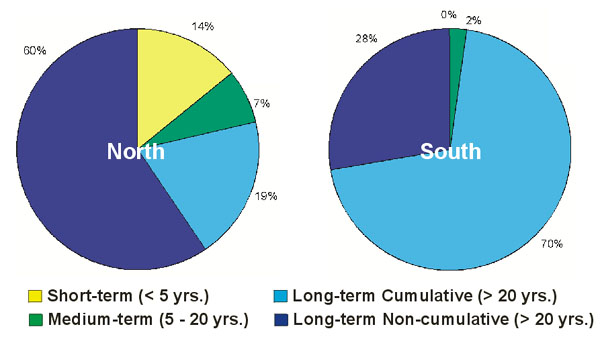
All policy constraints were grouped by their source to examine their relative impact. Knowing which group of policies (e.g. land use, wildlife habitat guidelines, aerial spray guidelines) constrains the most area and where, provides a focal point for future discussions around policy changes necessary to accommodate IFM (Figure 7). Similarly, knowing which policies constrain area over long periods of time versus more short-term constraints can be important for timing of IFM spatial strategies (Figure 8).
|
| Figure 7. Area by constraint source for Tembec North and South regions. |
|
| Figure 8. Area by constraint longevity for Tembec North and South regions. |
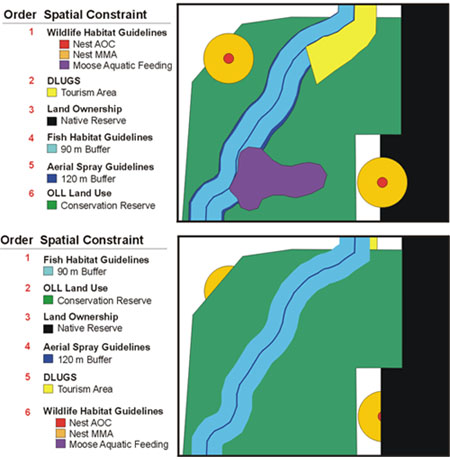
By maintaining detailed spatial information about each constraint at each location, the order that these constraints are applied can be altered to examine spatial hierarchies in constraint application (Figure 9). In many cases in the planning process, constraints are applied independently of each other. For example, a planner concerned with aerial pesticide application compliance may apply a 120 m buffer around a lake while at the same time a biologist may apply the necessary 80 m buffer for fish habitat concerns. In these cases, hierarchical application of constraints are efficient and indicate spatial redundancies in policies.
|
| Figure 9. Effect of changing the spatial order (hierarchy) of policy constraints. |
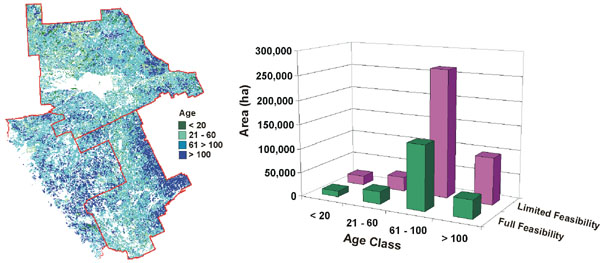
IFM feasibility categories can be compared to specific species and age classes by querying the combination of policy constraints and FRI attributes contained in the final data sets (Figure 10). Knowing the impact of the constraints on each species or age-class can assist in developing species-specific or age-specific spatial strategies. For example, if jack pine is heavily constrained in one area, investment in jack pine IFM may be better made in another area suitable for jack pine with fewer constraints.
|
| Figure 10. Spatial and graphic output useful for creating age-class strategies. |
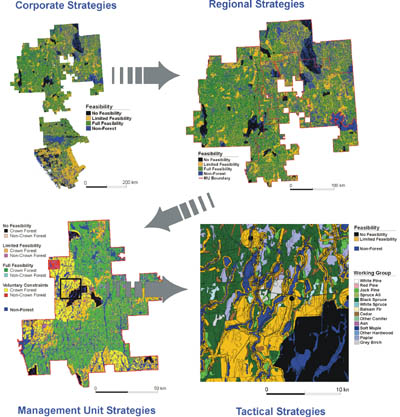
The data and analytical results compiled for this project allow consistent analysis of IFM feasibility assessment from the corporate level down to the detailed sub-MU level (Figure 11). This information can be used to answer different questions at different scales. For example, at the corporate level, planners may want to know if IFM is feasible as a company strategy (e.g., is there enough feasible forest area to warrant further research and investment. At regional levels, managers can compare among MU's to find the best potential for IFM within a given region and how it relates to sawmill and pulmill locations. At MU levels, managers can determine where IFM is most feasible, given the species composition and soil conditions within the unit. At tactical sub-MU levels, managers can locate specific spatial constraints to identify the best potential IFM sites in the area and evaluate risks on a site by site basis.
|
| Figure 11. Examples of multi-scale IFM assessment outputs. |
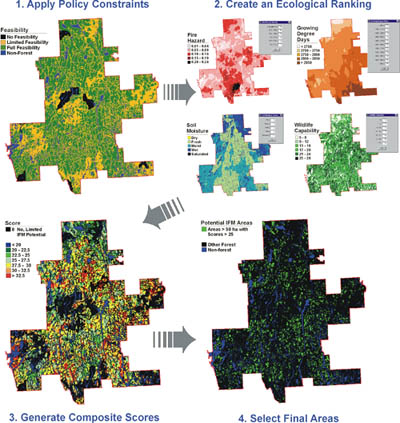
The combination of spatial policy constraints and landscape ecological data provides a basis to iteratively select areas for future IFM research and investment by ranking feasible areas by ecological optimality. Policy constraints can be applied, relative weights or scores can be developed among and within ecological layers to create composite scores, and sites can be selected based on this score in combination with area constraints. For example, selected IFM areas may be feasible areas greater than 50 ha that have a composite score of at least 25 based on low fire hazard, suitable growing degree days, good soil moisture, and low impact on wildlife habitat rankings (Figure 12). This process is easily performed iteratively using the spatial query tool.
|
| Figure 12. Steps in IFM area selection process. |
The spatial query tool consolidates all policy constraints and ecological data with tools to perform spatial queries, re-order constraints, summarize by FRI attributes, and rank IFM potential sites. Users can perform multi-scale spatial queries from an MU map of feasibility classes down to a specific nest area of concern buffer (Figure 13). The impact of constraints can be summarized by category (source, longevity) as well as individually. For example, the user can summarize the area in land use constraints as well as how much area is constrained by each individual Provincial Park. The spatial order of constraints can be changed to explore policy constraint hierarchies and overlaps (e.g., how much additional area is constrained by aerial spray buffers after the fish habitat guideline buffer has been applied).
|
| Figure 13. Multi-scale querying and area summary by FRI attributes using the spatial query tool. |
The most powerful capability of this tool is the iterative ranking of IFM areas using ecological data (Figure 14). Ranking schemes can be developed using any of the 17 ecological layers to determine which feasible sites provide the best ecological conditions. These rankings can be altered to immediately see the impact of constraining or relaxing ecological criteria. The rankings can also be saved for later use or for different areas. The tool also allows spatial comparison of final areas with wildlife habitat maps and the ability to export these areas to a Shapefile for use in other planning tools.
|
| Figure 14. Final IFM area selection using the spatial query tool. |
We demonstrated that spatial analytical techniques could be used to effectively assess the feasibility for IFM over very large areas, using existing data. The spatial query tool enables forest managers to interactively explore planning options for IFM with explicit spatial reference to policy constraints and ecological data. The raster-based approach and simple user interface provide a very effective means to work with very large datasets, while providing powerful multi-scale querying and ranking capabilities. Most importantly, managers can examine many scenarios to develop strategic corporate-wide strategies or detailed operational plans before making investments in the field.
This study also showed the need for forest land use policies to be spatially assessed for their redundancy, hierarchical order of precidence, longevity, and ambiguity prior to their implimentation. The efficiency of hierarchical top-down approach was confirmed by completing this assessment for 8 million hectares in less than one year.
Allen, T.F.H. and T.W. Hoekstra. 1992. Toward a Unified Ecology. Complexity in Ecological Systems Series. New York, New York: Columbia University Press. 384 pp.
OMNR. 2000. Ontario Climate Model, V.2.0 Ont. Min. Nat. Resour. Ont. For. Res. Inst., Sault Ste. Marie, ON. CD-ROM.
OMNR. 1999. Ontario's living legacy land use strategy. Natural Resource Information Centre. Peterborough, Ontario. 136 pp.
O'Neill, R.V., D.L. DeAngeles, J.B. Waide, and T.F.H. Allen. 1986. A hierarchical concept of ecosystems. Monographs in population Biology, 23:1-272.
Perera, Ajith H., D. Yemshanov, F. Schnekenburger, D.J.B. Baldwin, K. Weaver, and D. Boychuck. In Press. Spatial simulation of the large-scale forest fire regime in a boreal landscape. in Emulating Natural Forest Landscape Disturbance: Concepts and Applications. A.H. Perera, L. Buse, and M. Weber eds. Columbia University Press.