Managing Grizzly Bear GPS Data at the Foothills Model Forest
by: Julie DugasThe Foothills Model Forest (FMF) Grizzly Bear Research Project manages large data sets derived from GPS radio telemetry collars on grizzly bears. Efficient data handling and management techniques are essential in maintaining the integrity and accuracy of the data and to facilitate single-source spatial analysis, querying and reporting. Through ArcInfo and ODBC datasource connections with Microsoft Access, the raw GPS point data are imported, re-projected and stored directly in a database. Biologists and other scientific collaborators have benefited from the techniques and applications developed to address research questions. The FMF is a non-profit organization that works to advance the goal of sustainable forestry through on-the-ground research.
Introduction
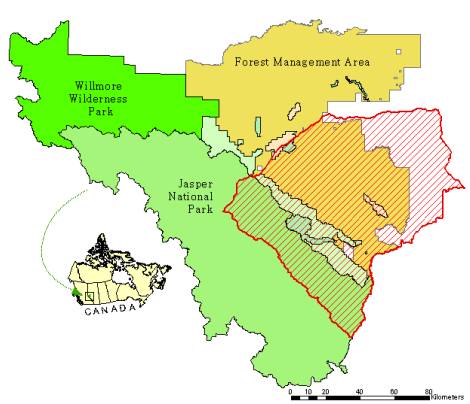
The Foothills Model Forest is a non-profit organization that works to advance the goal of sustainable forestry through on-the-ground research. Research projects are dedicated to understanding the landbase through the collection of data on wildlife, indigenous fish, plants, the role of natural disturbances such as fire, alternative forestry practices research, and the social and economic sustainability of resource based communities. At 2.75 million hectares (27,500 square kilometers), the Foothills Model Forest is the largest model forest in the world. It includes Jasper National Park (a World Heritage Site), Weldwood of Canada’s working forest, Willmore Wilderness Park and other provincial land areas. (Figure 1).
|
| Figure 1. The Foothills Model Forest landbase. |
In the Fall of 1998, the Foothills Model Forest and the Yellowhead Carnivore Working Group initiated a collaborative grizzly bear research project that would include five years of field data collection. The long-term objective is to provide land and resource managers with the knowledge and tools to ensure long-term conservation of grizzly bears in the west-central region of Alberta, Canada. Data collection began in April 1999. The year 2002 marks the project’s fourth year.
The grizzly bear project area shown in Figure 2 is 9,752 square kilometres and includes the eastern portion of Jasper National Park (24% of total). A quarter of the project area is also considered mountainous or greater than 1,800 meters in elevation. The working landbase supports forestry, mining, oil and gas development, tourism and recreational activities. The population within the project area is approximately 20,000, although more than 1.8 million people visit Jasper National Park on an annual basis. ( http://www.worldweb.com/ParksCanada-Jasper/visitor_information/visitor.html)
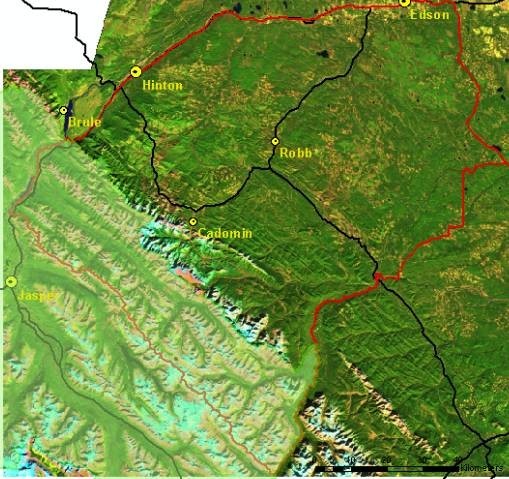 |
| Figure 2. The Grizzly Bear Research Project area. |
A wildlife project of this scale and magnitude using leading-edge technology generates an enormous amount of data that needs to be properly managed. Efficient data handling and management techniques are essential in maintaining the integrity and accuracy of the data and to facilitate spatial analysis, querying and reporting.
Data Collection
One of the key elements to the Grizzly Bear Research Project (outlined in Table 1) is the study and analysis of grizzly bear movements. Every year of the five-year project, grizzly bears are captured and equipped with GPS radio-telemetry collars. The movement data also serves to look at the other key elements of the program.
| Table 1. Key elements to project. | |||||
|
Beginning in 1999, multiple field crews were in full force collecting various types of data, including:
- GPS data from collared grizzly bears
- Grizzly bear capture information
- Blood samples from captures
- Hair sampling using barbed wire and bait
- Scat sampling using scat-sniffing canines
- Various lab results (DNA, blood and other)
Other types of data that have been collected as part of the project:
- Food-level vegetation
- Field work from various graduate student projects
- Bias testing for our GPS collars in various habitat types
- Keeping track of all our GPS collars
- Other
In the first year of data collection, the GIS staff had not anticipated the scope and implication of non-centrally managed data sets which in turn resulted in project-wide data management issues. Project staff, graduate students, consultants, lab technicians, and GIS staff - everyone had their own methods and ideas on data collection and storage. Trying to relate data from one sub-project to another became problematic and cumbersome. For example, trying to link hair sampling data with capture data when both were stored using different data standards or protocols.
Database Design
Most data collected is ultimately stored on site at the Foothills Model Forest. With the help of a database design reference book Database Design for Mere Mortals: A Hands-On Guide to Relational Database Design by Michael J. Hernandez, project proponents were interviewed to help define the mission statement, objectives and rules. Taking a step back, each type of dataset was examined to determine the table lists and structures needed.
The main objectives defined were:
- Functionality.
- Minimize data duplication and effort.
- Allow easy access and analysis
- Able to deliver a final product to resource managers.
The design of the database started in Spring 2000. The design, data import and testing had taken one year before the database could be operational. To enforce data integrity on the database, validation rules were given to most fields and data entry forms were designed to minimize data entry errors (i.e. lookup tables). Many users dealt with a learning curve, but soon discovered the advantages to a ‘tighter’ database.
User access management is needed to handle the various project proponents both on and off-site. Options being considered are database replication and online access. Database replication is currently being used for one of our project databases.
Protocols have been established to help deal with data collection methods, especially for storage formats. Participants are strongly encouraged to discuss their methods with GIS staff prior to data collection to help ensure data are collected and stored efficiently.
Microsoft Visio
Microsoft Visio was used to help visualize the database schema through reverse engineering, as shown in Figure 3. Microsoft Visio is a software application which supports database modeling and diagramming and can be used to create entity-relationship (ER) diagrams. It is also possible to generate a new database directly if your DBMS supports the direct creation of a new database. For example, the database model would be created in Visio and then used to generate the new database in Microsoft Access.
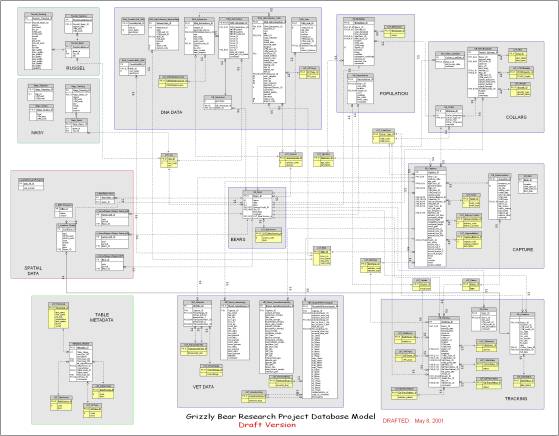 |
| Figure 3. Database schema created in Microsoft Visio through reverse engineering. |
Open Database Connectivity
Open Database Connectivity (ODBC) allows various software applications to access data from databases such as Microsoft Access, SQL, and Oracle. Databases can be accessed in ArcGIS, AML scripts, ArcView 3.x, statistical packages, Microsoft Visio, and many more. Although we have not moved towards geodatabase technology, the current database does, however, store coordinate information that allows the user to plot the information (in this case grizzly bear locations) by creating themes on-the-fly (event themes).
To set up an ODBC connection, you must add drivers to your computer system. This is done in the ODBC Data Source Administrator on a Microsoft operation system. For transferability and sharing of GIS map projects between users, each user accessing the database must use the same name for the ODBC connection. Linking to the database through ODBC also assures the user is using the most current data set (not a copy). The user can query as many tables as she/he needs as well as from multiple databases.
Grizzly Bear GPS Data
The bulk of the stored data is generated from the digital information retrieved from the project’s many GPS radio telemetry collars. On average, 8300 grizzly bear non-differentially corrected GPS locations and associated information (eg. date, time, dop and fix) are acquired every year from as many as 27 collared grizzly bears (see Table 2). Most collars are programmed to collect 6 locations a day (every four hours) while a few are programmed to acquire a location every 2 hours – 12 times a day. Data is typically collected from early May to late November for a given year. Unfortunately, not all GPS fixes are successful for various reasons (eg. dense forest cover). Other factors influencing our total number of locations acquired include the fact that some grizzly bears have managed to remove their collars, or the collars have been broken or fallen off prematurely. Some collars have malfunctioned altogether and the data is forever lost. Nonetheless, compared to earlier techniques of wildlife data collection through VHF radio collars, the amount of data collected is substantial.
| Table 2. Statistics | ||||||||||||
|
||||||||||||
| *as of May 15, 2002 |
Two types of GPS collars are being used. The first type allows the unit to be uploaded through an FM modular uplink from an aircraft or from the ground without having to retrieve the collar unit. These collars have been pre-programmed to deliver stored data at set times throughout it’s life on the grizzly bear. On average, an upload lasts about 16 minutes. The benefit of this type of GPS collar technology, is that data can be retrieved while the collar remains on the grizzly bear. The second type needs to be retrieved (via VHF radio signals) and uploaded directly from the collar to a computer. In the end, there are three different types of data files to work with (see table 3).
| Table 3. GPS radio telemetry collar types. | ||||||||||||
|
Populating the Database
To avoid data entry errors, the process of adding these data into the database has been programmatically automated with Arc Macro Language (AML) scripts and menus. Using ODBC connections, the data is ‘pushed’ into the database and directly updates the information in the appropriate table. Once the data is in the table, it can be accessed and analysed in many ways. Sample records from the different input data file types are shown in Figure 3. An AML script has been written to consider these three types of files.
|
|
| Figure 3. Sample of input file formats over the last few years. |
One of the side effects of leading-edge technology is the constant improvements made to the technology itself. Yearly technological advances are to be expected and affect the output data that is retrieved from the improved collars and/or software. New information is either added, or the format itself is changed or improved. This has become a managerial problem as different versions of the scripts must be archived to handle earlier data files if needed. Fine-tuning of the AML scripts is needed every year. This problem is not unique to any one of our GPS collar manufacturers and is not obvious until an AML script fails and needs to be verified.
Another challenge is the geographic datum used. Most GPS (if not all) use the lat/long WGS84 coordinate system. These coordinates must be transformed into our coordinate system: UTM 11N, NAD 83 (Canada). This is not so much a problem because it hasn’t changed over the last three years (thank goodness!). The challenge was finding the right tools to do the transformation as accurately as we can, even without having differential correction on our GPS locations.
The GPS collars that allow for scheduled uploads give us data ahead of time. It is possible that the collar may not be retrieved for another year or more, is lost, or malfunctions altogether. In the database, a field describes whether the data is REPORT data or DIRECT data. The DIRECT version is the final form of the data that is directly retrieved from the collar. When the final data set is retrieved from the collar, the REPORT data for that same collar/bear is removed from the database (deleted records) and replaced by the final data set. This method allows the most current data available to be present in the database. The report data commonly has missing, or corrupted data due to poor transmissions.
Before the raw data from the GPS collars is pushed into the database, the data is checked digitally and temporally against the known capture date and collar retrieval date. Once the battery is attached to a GPS collar (and for some, the magnet is removed), the collar collects data regardless if it’s on an animal or not. Spatially, especially with report data where errors may occur, the points are visually checked to see if they make ‘sense’. Once the data has been cleaned and prepped, it is pushed into the database. Figure 4 shows a sample of the AML code used to add the new GPS information into the database.
|
|
| Figure 4. AML code sample |
Summary
The techniques described in this paper have been successfully applied at one of the FMF’s partner agencies, Jasper National Park. The database schema has also been requested by various organisations to help them with their own database planning and designs. The techniques and ideas shared between organisations will help to better manage the large collection of wildlife data. In addition, biologists and other scientific collaborators have benefited from these techniques and applications to address research questions.
Managing grizzly bear data is a dynamic and evolving process that requires the flexibility of design changes and improvements to meet evolving research requirements. Complex forms, queries and reports are continually created to facilitate data entry and reporting. The outcome is a fully functional and managed database that can be accessed by most users and most software applications, including ArcInfo and ArcView.
Moving to incorporate all spatial data into the database using geodatabase technology is the next natural step. We must first though test the technology, move all our ArcView 3x users to ArcView 8x and assess if a personal geodatabase will suffice without having to purchase ArcSDE.
Overall, the managed grizzly bear database will provide land and resource managers with the knowledge and tools to ensure long-term conservation of grizzly bears in the west-central region of Alberta, Canada.
References
Visitor Information, Jasper National Park, http://www.worldweb.com/ParksCanada-Jasper/visitor_information/visitor.html.Julie Dugas
GIS Specialist
Foothills Model Forest
Hinton, Alberta, Canada
email: Julie.Dugas@gov.ab.ca
Julie is a GIS Specialist with the Foothills Model Forest in Hinton, Alberta, Canada. She has been with the organization since 1998 and provides GIS support to the Foothills Model Forest Grizzly Bear Research Project.