Dale V. Clancy, P.Eng.,
Infrastructure Services Department
Saskatoon, Canada
| Abstract |
|---|
| A holistic approach to managing infrastructure in a public right-of-way is achievable through ArcGIS�. The City of Saskatoon has developed an initial framework for considering spatial and temporal relationships between multiple assets for use in developing interdependent rehabilitation and funding strategies. ArcGIS� accounts for the influence of one asset on another through spatial relationships, leading to targeted work plans and more appropriate overall spending. |
Predictive and economic models have been developed to consider the long-term economics of individual assets or asset groups. In most cases, these models have been developed using asset-specific software. ArcGIS allows for integration of the modeling output using a common platform and a consistent spatial reference. This facilitates the development of rehabilitation plans beyond what will be done next year. With multi-year plans, other assets within the right-of-way can be considered well in advance of the planned rehabilitation date. Where information or analysis has not been completed, asset stakeholders can plan and budget for inspection, analysis, and rehabilitation that will complement the rehabilitation programs of all assets.
To ensure the sustainability of an asset, a long-term planning horizon is needed. Asset stakeholders need to know what work has been done, what work needs to be done, and to understand this information in a framework that considers all associated assets within the right-of-way. With ArcGIS, asset stakeholders can look beyond the confines of their specific responsibilities and can now consider information about other assets that may influence treatment selection and timing for their own assets. This leads to integrated action plans to improve inspection scheduling and rehabilitation decisions. While making optimum decisions is the goal in this work, making better decisions that result in better economic outcomes has considerable benefit.
After decades of system expansion combined with limited maintenance, the need for long-term preservation of existing assets was identified. Rehabilitation programs for assets such as cast iron water mains and Arterial roads were introduced in 1982, with additional programs for other assets added over time.
The need for better management tools was acknowledged with the development of Geographic Information Systems to map the City's infrastructure. As technology developed, the City moved from a paper-based information system to a database system for the storage of asset data, including inventory, condition, and maintenance and rehabilitation treatments. Although this work was done in the same department, these databases were developed separately and in different formats.Comparable initiatives were occurring throughout the organization and the need for a common corporate platform was identified. In 2001, ArcGIS was chosen. This created an opportunity to bring information about different assets together into a single platform. The first key GIS components to be identified corporately were the parcel and transportation models. Training on Esri software began in the summer of 2001.
Organizationally, changes were also happening that would make integration more feasible. In 1997, as part of the corporate strategic plan, an Asset Preservation Group was formed within the Public Works Branch with a mandate to provide:This group combined expertise in design, construction, and operations of both surface and underground infrastructure with expertise in economic decision analysis and statistics. Economics is the group's primary consideration.
In keeping with its mandate, the group develops decision models that focus on minimizing the long-term costs, i.e. current plus discounted future costs. These models take into consideration minimum acceptable levels of service and budget/resources as constraints on the possible choices. In implementing the models, the starting point for minimum acceptable levels of service is determined by legislative requirements, e.g. safety, current practice and precedence, or that which is achievable using current budget/resources. This usually results in a backlog. City Council is initially asked to approve a financial and resource plan to eliminate the backlog as soon as possible. After the backlog has been eliminated, City Council is asked to consider improvements in the minimum acceptable levels of service in relation to the increase in budgets/resources required to achieve them.The group has implemented models for cast iron water mains (Gustafson, Clancy1) and roads. Work is also underway on development of models for the evaluation of sewer mains (Clancy, Gustafson, Higgins2) and sidewalks. Future models are expected to consider valves, manholes, service connections, and hydrants.
Utilities such as water and sewer mains are typically installed beneath the road. In some cities, these are under the boulevard to reduce utility-driven damage to the roads. The spatial influence of all these assets is illustrated in Figure 1, a typical cross section through a right-of-way in Saskatoon. Work on any of the underground assets not only can drastically affect the road structure above, but the proximity of underground assets to one another can affect how the treatment of one impacts another.
In Figure 1, the inverted triangles indicate the trench that would result if the water, sewer, or storm sewer main were rehabilitated by open cut excavation. Where the trenches overlap, some backfill material would be re-excavated if the mains were replaced separately. The diagram also illustrates the extent of road that would be removed for an open cut excavation. There are trench overlaps in Figure 1 representing the extent of road that would be disturbed by asset rehabilitations at different times. The City of Saskatoon owns and operates its own water distribution system and the sanitary and storm sewer collection systems. This may make asset integration in a public right-of-way more feasible than when multiple agencies are involved. The analysis presented will focus on the relationship between the water and sewer utilities and roads, but the process is anticipated to eventually include all assets within the right-of-way.
The integration framework proposes to take the outputs of these independent strategies and collectively consider the best overall choices for all assets.
The City of Saskatoon has developed a 3-year road rehabilitation program for longer-term logistics planning and to facilitate multi-asset integration. Figure 4 illustrates part of the output from the Road Rehabilitation Model. Planned 2002 work is shown in green, 2003 work in blue, and 2004 work in red.
Total and peak scores are considered in the development of a rehabilitation program. For concrete sewers where deterioration is due to corrosion and tends to be more or less consistent along the entire length of the pipe, the total score is considered and full linings are normally selected. Lining alternatives that utilize particular treatments are considered first in rehabilitation of clay tile sewer mains where defects are localized along pipe lengths.
Figure 5 illustrates the output of the modified NAAPI-based evaluation process. The higher NAAPI score indicates where the risk of failure is the highest and lining would be done soon.
In the top-to-bottom strategy, the road agency considers the remaining life of underground utilities in its strategy planning. Where the surface asset will be impacted by an underground utility within the expected life of the rehabilitation treatment, consideration should be given to selecting a less costly, intermediate road treatment that still achieves safe driving conditions.
Traditionally, road agencies would replace a road's riding surface and sometimes the underlying structure when the road could no longer be economically maintained. Now there are intermediate treatments that can be utilized to maintain the investment in the road. Each has different best intervention timing, cost, life expectancy, and economic value. It may be economically appropriate to use one of these treatments to extend the life of the surface until the underground utility approaches the end of its economic life. In the best outcome, the surface asset would be maintained in safe condition at the least cost until optimal timing for renewal of the underground asset is reached. Alternatively, it could be a better economic decision to undertake the road rehabilitation early, foregoing the remaining economic life of the underground asset, where the cost of maintaining the road in a safe condition exceeds the value of the remaining life of the underground asset.In the past decade, sewer rehabilitation has focused on trenchless technologies to deal with the high cost of open cut and trench box strategies. Where the main can be effectively rehabilitated using a trenchless strategy, the decision can be made to proceed with a higher cost road treatment. There is still some risk that the decision could lead to emergency and planned excavations if the sewer is not lined before the surface is rehabilitated. However, this would be expected to be a localized event that does not alter expectations for a good economic decision.
In a bottom-to-top approach, an underground asset is nearing the end of its economic life. Any rehabilitation strategy decision will impact the surface asset in key ways. In maintaining the water and sewer service, emergency and planned repairs will be required, resulting in excavations in the road. Failure of the water system may result in the slow escape of water into the road's structure. This increases the moisture content of the trench backfill, affecting not only the localized area of the failure, but potentially weakening the road structure along the length of the pipe as water seeps along on the outside of the water pipe.If the deteriorated asset is the water main, rehabilitation choices are currently limited to open cut, trench box, or shaft-and-auger. The road surface is likely to have deteriorated due to past repairs to the water main. If the sewer asset is deteriorated and sewer lining is not expected to be an alternative in the future, replacing both the water and the sewer main at the same time may be the best decision. Conversely, it may be more economical to defer the water main and incur additional failures. This may be a good economic decision but is not without risk due to the costs of emergency repairs and the inconvenience to the customers that must also be considered.
For a deteriorating sewer main, the same excavation treatments are available as for water mains, but with the emergence of trenchless technologies, utilities have additional alternatives. If the sewer can be lined, it may still be more economical to replace the water main in one open cut or it may be more economical to wait until the road surface had deteriorated further before carrying out any underground rehabilitation.Whether considering a top-to-bottom or bottom-to-top approach, the rehabilitation decisions are dependent on not only the asset being at the end of its economical life, but also on the existence and condition of all the other assets within the right-of-way. ArcGIS provides a platform to consider all assets within an urban right-of-way. Where the analysis has been carried out, the opportunity exists to account for the condition and expected performance of other assets on the decisions regarding one particular asset. This facilitates the development of integrated Asset Preservation Plans for a given right-of-way.
This spatial representation replaces the lengthy lists used in the previous non-integrated asset preservation process. Our former process was generally top-to-bottom with asset stakeholders operating independently. The list of proposed road rehabilitation locations was circulated to the other asset managers, who then independently assessed this information against their own planned programs. Considerable time was spent collecting targeted condition information and proposing revisions to treatments or their timing based upon this current knowledge. This meant that the original programs could be revised frequently as conflicts and issues were dealt with. Eventually, a comprehensive map would be created for that year's work and publicly released. This process was largely inefficient with a potential to lead to uneconomic decisions.
With ArcGIS, integration begins with the comprehensive map to identify areas of conflict for checking. Our initial framework was structured to consider all other assets around those locations where major - expensive and longest-lasting - road treatments such as overlays and reconstruction were scheduled. Any impact due to work on other assets could prove costly.At all of these locations, a series of questions are answered, based on the level of knowledge about all assets, treatment choices, and particularly about the economic implications of options, regardless of which asset is driving the final treatment choices. From the roadwork perspective, for example, these questions would be:
"Is the asset condition such that
it should be dealt with prior to the road work?"
"Are there factors that justify altering
the selected road treatment?"
Other appurtenances can also be identified and evaluated with this process. The water and sewer repair database is accessed to determine all appurtenances recently rehabilitated or repaired and to show these for each road segment under consideration.
Table 1 shows that those water mains which had any breaks at all still have a low probability that they would have enough breaks to justify replacement within the expected 20 year life of the overlay. This does not, however, preclude the possibility that there may still be some water main breaks sometime within the life of the overlay, but this risk is considered acceptable.
Table 1: Water Main Break Analysis - 25th Street.
| ID | TYPE | SIZE | BREAKS | CONDITION FINDINGS |
|---|---|---|---|---|
| 550 | ci | 300 | 1 | 3 % probability of replacement |
| 551 | steel | 600 | 1 | Not included in analysis |
| 552 | steel | 750 | 7 | Not included in analysis |
| 553 | ci | 150 | 1 | 1% probability of replacement |
| 554 | ci | 300 | 0 | Not under consideration for replacement |
| 555 | ci | 300 | 2 | 9 % probability of replacement |
| 556 | ci | 100 | 0 | Not under consideration for replacement |
| 557 | steel | 750 | 0 | Not included in analysis |
| 558 | ci | 150 | 0 | Not under consideration for replacement |
| 559 | steel | 750 | 0 | Not included in analysis |
| 560 | ci | 300 | 0 | Not under consideration for replacement |
| 561 | ci | 300 | 0 | Not under consideration for replacement |
| 562 | ci | 200 | 1 | 1% probability of replacement |
| 563 | steel | 750 | 0 | Not included in analysis |
| 564 | steel | 750 | 0 | Not included in analysis |
| 565 | ci | 200 | 1 | 1 % probability of replacement |
| 566 | ci | 300 | 0 | Not under consideration for replacement |
| 569 | steel | 750 | 0 | Not included in analysis |
| 570 | ci | 300 | 1 | 18 % probability of replacement |
| 571 | ci | 300 | 0 | Not under consideration for replacement |
| 572 | steel | 750 | 0 | Not included in analysis |
The video camera inspection database for sewers is also accessed as part of the process to form an Asset Preservation Plan. Those sewer mains that have been video inspected are colour-coded by the year of the last inspection as shown in Figure 7. Dotted lines indicate sewers that have not been inspected and, therefore, require a complete investigation. For this example, all of the sewers have been recently inspected and no work is required on any of them.
Time becomes a factor in the video inspection decision. If the video inspection had been done too long ago, it is possible for conditions to change sufficiently to justify another inspection. This reflects the comfort levels within the decision - the age of the data versus the importance of the treatment. We have identified the need to set parameters relative to this factor, but have not formally documented them.
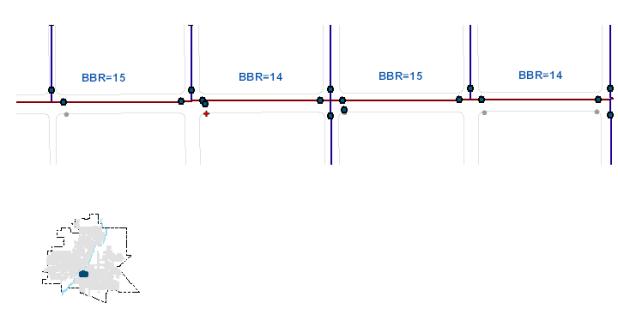
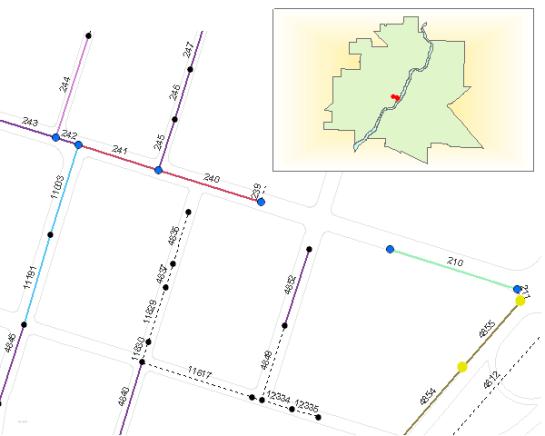
In Figure 8, the Select by Attributes feature in ArcMap is used to first identify the manholes falling within the roadwork limits that have already been inspected. The majority of manhole inspections are carried out as part of an ongoing cleaning process for maintaining sewer mains. The inspection database is attached to the manhole layer and those manholes that have been inspected are shown in yellow and a required treatment for each manhole has been identified. Most of the manholes along 25th Street have not yet been inspected; these are indicated in blue. Manholes outside of the scope of the roadwork are smaller black dots.
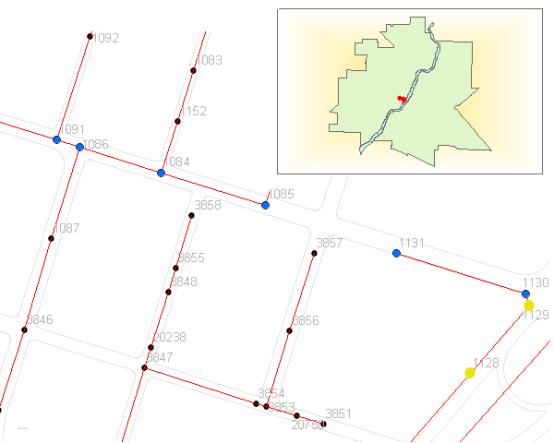
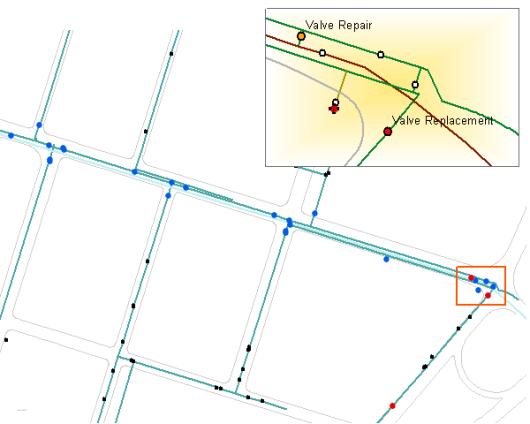
Similarly, we looked at valve maintenance and repair records to determine the extent of work needed prior to the overlay. The inset in Figure 9 shows a close-up of the east end of 25th Street where the two valves shown in red have been repaired or replaced within the past five years. All valves needing inspection are shown in blue with valves outside of the scope of the area of roadwork shown as smaller black dots.
All of this information is combined into a composite Asset Preservation Plan for the right-of-way along 25th Street from the University Bridge to 1st Avenue. The Asset Preservation Plan indicates that the planned overlay can proceed with the following work needed beforehand:
Implicit in this Asset Preservation Plan is the belief that, within the planned 20-year life of this overlay, there is not likely to be a water main or sewer main replacement required, although spot repairs may be needed.
Knowing all this information about this location has enabled us to respond readily when we were advised of the intention by another Branch in our Department to modify the geometrics of this road. Because this work is not expected to proceed for two to ten years, we will not do the overlay as planned, but will simply do extensive patching - a less expensive, shorter-duration solution to maintain the road's quality temporarily.
The planned treatment for this road is seal. Under our previous process, a seal wouldn't justify any in-depth review of the condition of underground mains. However, we have recently begun to utilize emerging technology to view the structural condition of the road and create a comprehensive picture of the overall road condition. This process is being adopted for all of our high volume, heavy load roads.
Figure 10: Plot of Road Structure using Ground Penetrating Radar- 8th Street Eastbound (Courtesy of Pavement Scientific International Inc.).
Figure 10 shows the underground structure of 8th Street. From this structural plot, we can determine if the road has any weak areas and if these areas are isolated or widespread. Because this plot is only indicative of a single wheel path, we extrapolate the information, deciding if further investigation is needed. From this information, we can plan the type and extent of treatment appropriate to the overall road condition. Then we use ArcGIS to illustrate the findings of the ground penetrating radar, pinpointing areas of suspected structural weakness. The intent is to locate and repair any weak areas before treating the surface of the road. In some cases, it is certainly possible that the structural repairs will be extensive enough to eliminate the need for the surface treatment.With dynamic segmentation, isolated structurally weak areas can be plotted against the sewer condition results shown in Figure 11. The red flags in Figure 11 indicate spot locations needing specific repairs before the road is sealed and the red lines are suggested lining locations.
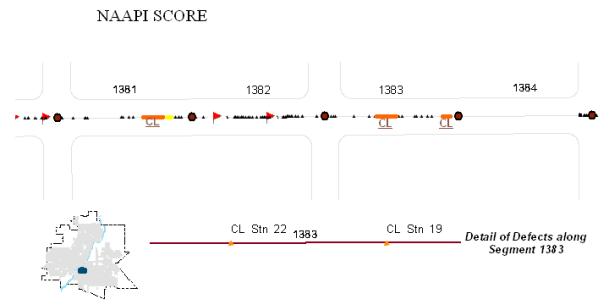
Figure 11: Sewer Condition and Defects - 8th Street.
Similarly, although not shown, water main details can also be plotted, creating a comprehensive "photo" of the right-of-way. Once the specific treatments needed for the individual assets have been determined, through economic analysis a targeted action plan for all affected assets can be determined that will achieve the best sequence of treatments and timing to achieve the greatest overall benefit for all assets.
We are making small decisions for now, but have begun the framework for more comprehensive integrated future decisions. Much of the information needed to make better decisions is already available, although not always in a readily-useable format. ArcGIS is the tool to use to make integrated decision-making in an urban right-of-way feasible.