|
|
|
|
Old centerline route system |
New bi-directional route system (with ramps) |
GIS advocates in the transportation industry have long recognized the benefits of using GIS "route systems" to model their linear referencing systems. Using dynamic segmentation, these route systems help agencies locate a variety of features and conditions listed in corporate databases by simply indicating a route and measurement for each database record. Traditionally, many state transportation agencies have modeled their route systems based on a road centerline. The current trend is towards more detailed and accurate mapping. In 2001, the New York State Thruway Authority instituted a new bi-directional route system. The new route system models each direction of travel as a separate alignment. This paper explores how the Thruway implemented the new route system and the various benefits that employees are reaping from the new model.
The New York State Thruway Authority is an Independent Public Benefit Corporation that owns and maintains several major highways in New York State. The New York State Thruway extends nearly 600 miles, crossing the entire state from New York City to Buffalo and points west. In addition to this roadway, the Authority owns several shorter connector highways, and holds maintenance responsibility for two highways that the NY State Department of Transportation (NYSDOT) owns. All told, there are seven highways—the Thruway itself (a.k.a. the Mainline), Berkshire Spur, Niagara Section, New England Section, Garden State Parkway Connector, I-84, and the Cross Westchester Expressway. All of the roads are divided highways, with full-control of access (via interchanges). Typically, the roads have a large median separating each direction of travel.
As with most transportation agencies, the Thruway maintains a linear referencing system (LRS). This system is distinct from the designations for other state highways in New York. The Thruway’s milepost system consists of markers field-posted every tenth mile, which indicate the total distance traveled along each roadway. The mileposts are identical in opposite directions of travel. For instance, milepost 204.7 is in the same general geographic location on both the eastbound and westbound roads. Although the Thruway spans both Interstates 87 and 90 in New York, the Authority uses one continuous milepost sequence across the entire Mainline. Roads not considered part of the Thruway’s Mainline use an alphabetic abbreviation for the road. For instance, milepost 12.3 on the Berkshire Spur displays "B 12.3". Rather than a character abbreviation, many of the Authority’s databases use an offset to provide a unique numeric milepost for every location along a Thruway road. For instance, the Berkshire Spur has an offset of 800. Therefore, many use the unique number 812.3 to refer to the milepost labeled "B 12.3" on the roadway.
The GIS program at the Thruway Authority started in late 1999. At that time, a consultant built a route system in Esri, Inc.’s coverage format. This followed the same model that NYSDOT had been using. A centerline graphic (nominally at 1:24,000 scale) from NYSDOT’s GIS files served as the base. The New York State GIS Data Sharing Cooperative facilitated use of this data. Both agencies are members of this statewide initiative, which allows the free exchange of data between member entities. Once built, the Authority’s route system consisted of seven routes—one for each highway. The route system was later refined and recalibrated in late 2000, but essentially followed the same principle; It portrayed a "centerline" route system, modeling a theoretical centerline between the two roadways of each of the divided highways.
In the summer of 2001, data collection began for a new Computer Aided Dispatch (CAD) system for the Thruway. As a part of this project, the vendor was responsible for assembling an accurate digital representation of each direction of travel for the Thruway’s roads. From the inception, the GIS team had plans to leverage this data for a new bi-directional route system, to use in the Authority’s GIS applications.
To acquire the data, the consultant used the Thruway’s vehicle-mounted Trimble Pathfinder ProXRS GPS receiver. The signal was recorded every second, while the vehicle data maintained an average driving speed of 60 MPH. Data was real-time corrected using the U.S. Coast Guard NAV beacon signal. Collected in this fashion, the horizontal positional accuracy of the data is within two meters of true location. Driving in the rightmost lane, with the GPS receiver mounted on the right hand side of the car, the resulting alignment maps the white line on the right side of the road. This was the easiest way to consistently collect data along a roadway whose width often changes from two to three lanes.
Although the GIS group considered adjusting this line to the center of the roadway, left as is the data provides a number of benefits. First, it avoids a time-consuming process to determine precisely where and how much to adjust the lines, while maintaining a smooth character. Next, this helps to maximize the amount of visual separation of the roadways, for easier distinction of data events displayed on the graphics with dynamic segmentation. In addition, mapping the highway shoulder improves the quality of road geometry with intersecting ramp alignments. By doing this, there is no need to artificially extend the ramps (falsely increasing their overall length) to intersect the main roadway alignment. Finally, the average distance from the center of the roadway is only about 12 feet (one lane width). With the given accuracy, this is still far superior to the vast majority of other statewide datasets that compliment the data for GIS analysis. Typically, the highest accuracy data is from 1:24,000 scale mapping, with a horizontal accuracy of +/-40 feet. Even if the new road alignments are off by 22 feet (distance from shoulder line to center of a three-lane road, plus maximum error in GPS coordinates), this layer would still be the "strongest link", having higher positional accuracy than its fellow GIS layers.
Further processing the resultant files removed stray values and extraneous vertices, which did not markedly change the character of the roadway. Internal staff then built a route system, using known endpoint measurements and known mileposts of overhead bridges. These bridges provided high quality calibration points, since their measurements are recorded to the nearest hundredth mile and the positions do not change. By contrast, the mileposts on the roadway may not be exactly a tenth of a mile apart, and may move during construction or after being hit by plows or other vehicles. The density of these bridges also provides a good concentration of control, with an average of about one mile between calibration points.
In addition to modeling each direction of travel, project staff collected and processed ramp alignments, crossovers (connections from one travel direction to the other), and service area roads (Figure 1). Although no LRSs currently exist on these types of roads, building each of these as additional route subclasses allows end users to easily isolate the roadways, permits a unique set of attributes for these road types, and accommodates the potential for the display of future datasets. For ramps and service area roads, the final routes also include direction of these one-way alignments (see Figure 2). In addition, there is a new centerline route subclass included. This is similar to the old route system, but with superior graphic quality to match the new bi-directional alignments (since it was automatically generated from these graphics). This permits users to display data when a directional component is not included. It is also particularly useful for small-scale mapping, when the two roadways may appear as one.
|
|
|
|
Old centerline route system |
New bi-directional route system (with ramps) |
Figure 1.
This area is where the Mainline (I-90) intersects with the Niagara Section (I-190), just north of Buffalo. The graphic improvement is obvious.
Figure 2.
This shows ramp configuration on I-84, with arrows at the end of the ramps, to show directionality.GIS staff used the coverage format and route system model to allow for greater flexibly in building and using the system. At the time, several Thruway employees were still using ArcView 3.2. This precluded use of the newer ArcGIS geodatabase model to model an LRS. Although under development for ArcGIS geodatabase, the tool set for refining the route system was also much more refined for coverages at the time. This suite of tools also excluded the use of measured shapefiles (using a PolyLineM feature type).
Previously, the Thruway used seven centerline routes. Most data displayed only along these centerlines. However, directionality was often included in the databases. If a user wanted to show this directional component, the representation had to be "faked" using a complex system of specific offsets. These varied from one road to the next, and the magnitude of the offset varied based on the desired visual gap between directions. Table 1 shows the routes and offsets used.
|
Name |
Abbreviation ("route" field) |
From Milepost |
To Milepost (for linear data) |
|
Mainline |
ML |
0.00 |
496.00 |
|
I-84 |
84 |
500.00 |
571.51 |
|
New England Section |
NE |
600.00 |
615.10 |
|
Cross Westchester Expressway |
CW |
620.00 |
630.90 |
|
Garden State Parkway Connector |
GS |
640.00 |
642.40 |
|
Berkshire Spur |
B |
800.00 |
824.30 |
|
Niagara Section |
N |
900.00 |
921.21 |
Table 1.
Routes used on centerline route system.
With directional components included, the number of routes now totals 16. (The Mainline shifts from north/south to an east/west alignment at Albany; all other highways have only two directions of travel). Therefore, implementing the new route system required a change in the "route" field of each of the databases. This proved to be a relatively minor task, as the new route designation merely includes an appended hyphen and a one-character directional indicator. Table 2 shows the new route system requirements. Since the databases already contained the direction information, the two fields merely needed to be concatenated.
|
Name |
Abbreviation ("route" field) |
From Milepost |
To Milepost (for linear data) |
|
Mainline |
ML-N ML-S ML-E ML-W |
0.00 0.00 148.15 148.15 |
148.15 148.15 496.00 496.00 |
|
I-84 |
84-E 84-W |
500.00 500.00 |
571.51 571.51 |
|
New England Section |
NE-N NE-S |
600.00 600.00 |
615.10 615.10 |
|
Cross Westchester Expressway |
CW-E CW-W |
620.00 620.00 |
630.90 630.90 |
|
Garden State Parkway Connector |
GS-N GS-S |
640.00 640.00 |
642.40 642.40 |
|
Berkshire Spur |
B-E B-W |
800.00 800.00 |
824.30 824.30 |
|
Niagara Section |
N-N N-S |
900.00 900.00 |
921.21 921.21 |
Table 2.
Routes used on bi-directional route system.
The data that the Thruway maintains has always been bi-directional. In effect, the 650 miles of centerline highway is 1300 miles of individual roads. The irony is that from the inception of GIS at the Thruway, GIS users viewed the data on a generalized centerline roadway. Obviously, there were significant drawbacks to this approach. Before creating the bi-directional route system, the GIS Team suggested a number of cumbersome workarounds. These ranged from mapping information in only one direction at a time, to adding artificial offsets to the databases, to ignoring the directional component completely. Each of these methods, in effect, downgraded the accuracy of the data in order to show it on the map.
One nice effect of bi-directional mapping is that the information better matches other source materials. Orthoimagery for instance, often serves as a backdrop for GIS applications in New York State. The new route alignments match the orthophotos quite well. This helps to lend credibility to the GIS displays, especially for those new to GIS. Newcomers more readily accept the value of GIS when they see the road alignments match the photograph, instead of suspecting a problem when the linework and image do not correspond.
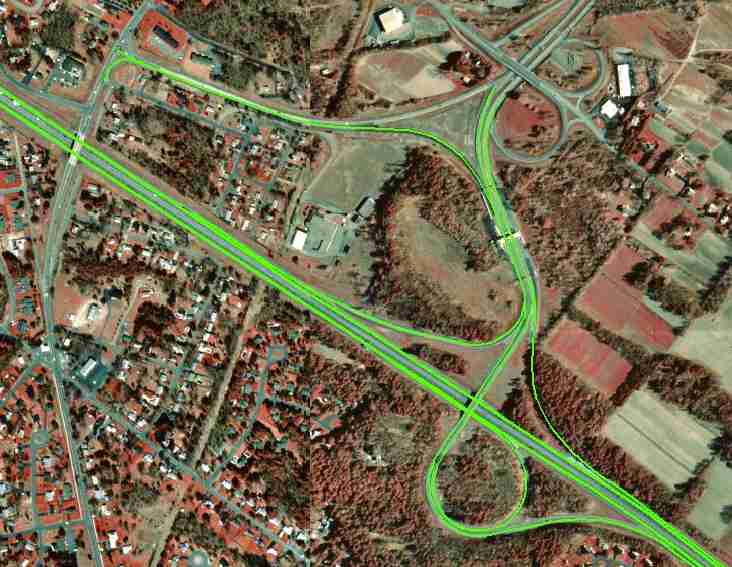
Figure 3. Bi-directional route system shown against an orthophotograph backdrop.
Another benefit is that the detail of extra roadways (i.e., crossovers and ramps) provides a truer representation of the highway network, and helps to explain phenomena that are not otherwise evident (for example, a snow plow route that ends at a crossover, instead of a highway interchange). The addition of ramps also allows users to render data on these ramps. The system can now show many databases describing highway projects, maintenance activities, or accidents that occur on these roadways. Using a traditional centerline route is not well suited to showing these ramps, or at least showing them accurately. In many of these situations, ramps may extend much longer than their true lengths, to show connectivity to an imaginary centerline.
The largest benefits for a system like this are obvious. After creating and implementing the bi-directional system, the data at the Thruway began to spring to life—displaying on the specific roadway to which it applied. This aids tremendously in the ability to analyze the information more effectively. The applications cover the usual gambit of transportation interests, including accident locations, pavement conditions, traffic volumes, and other information.
One example of how Thruway analysis has improved is with lane closures. Lane closures are very specific to certain directions of travel. Only specific directions are typically affected, and to minimize the effects of traffic delays, bi-directional closures may still vary, based on time of day. Being able to display these distinctions in GIS is tremendously beneficial.
Figure 4. Lane closures in Ontario County, which vary by travel direction.
The Thruway uses a robust Oracle database to keep track of daily maintenance work done along the highway. This Maintenance Management System (MMS) has customized Oracle Views, which allow GIS users to easily view this information. The data applications vary widely, ranging from employee location to equipment location, roadwork repair to landscaping, and lawn mowing to bridge cleaning.
Figure 5.
Guiderail work from milepost 362 to 363, in the westbound travel direction.
Intelligent Transportation System (ITS) elements often exist directly in or on the pavement (e.g., traffic counter loops), on a specific side of the highway (e.g., variable message signs), or in the median (e.g., video cameras). The benefits of using a bi-directional route system to show this kind of information are obvious. It helps distinguish between on and off-pavement events and the data show up on the map in their true physical locations. In fact, previous displays of ITS elements on the Thruway’s centerline were misleading, and made it appear that a stretch of highway was being served by specific ITS elements, when in fact, only one direction may have been.
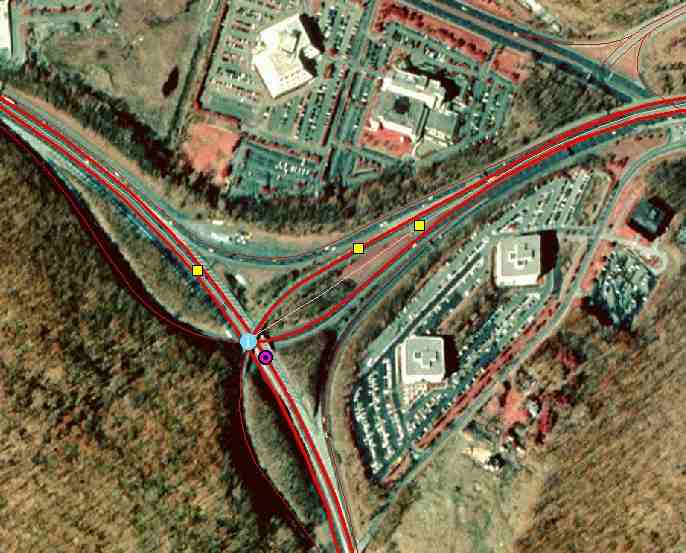
Figure 6.
Location of various ITS elements on the highway.
Nuances of change in jurisdiction also become evident. For instance, due to ramp and highway configurations, a police beat may cover one range of mileposts in one direction, but a different range in the other. These subtleties now show up.
Geometry of the LRS also improves with this type of system. Two curves, calibrated at the same points, more accurately depict the shorter distances (and, therefore, different marker placement) along the "inside track". Offsets are also much more accurate. A database of off-road items (billboards, for example) can now contain a true measurement from the edge of pavement, rather than a false offset from an artificial centerline, just to get it to display in the correct location.
Although careful planning went into the new route system, and it has proved to be extremely valuable, a number of items became evident after its creation. Each of these items offers a valuable lesson, useful to others considering the creation of a similar model.
One item that became clear was the need to have a keen knowledge of the roadways. In the case of the Thruway, the original alignments modeled the true limits of the highway. In other words, the graphics and measurements ended at the state line. In practice, however, information such as accident and maintenance records extend beyond the state line, ending at more realistic natural break points (i.e., one roadway extends into Connecticut to end at the far side of a bridge structure, and another in Massachusetts, at a convenient crossover location). Data collected at these "out of state" locations could not be mapped as the system was originally built, and the entire system needed to be extended to account for these. Another artifact was changes in nomenclature. For instance, the New England Section, which travels in a northeasterly direction through the state, uses north/south directions. Some historic information did not show up on the map, since it was recorded with the road’s previous (pre-1997) directional descriptions of east and west. Even the historic plans for the highway have even come into account. Although the GIS group has modeled an exact centerline of the highway (derived as the mathematical center of the bi-directional alignments), the original surveyed "baseline" of the highway would have been more desirable for many end users. Original plans placed numerous facilities in relation to this "theoretical centerline", and several users have been disappointed to learn that "route. centerline" does not, in fact, depict the surveyed line.
Another major lesson is the attention needed to database requirements. A great model of a roadway’s LRS means nothing, if the agency’s databases are not set up to support it. In the case of the Thruway, since there was no prior need for consistency. Corporate databases varied widely in terms of naming conventions for roadways (e.g., "New England Section", "New England", "NEW", "NES", "NE", and "E" could all be found as references to the same highway). Even the measurements were inconsistent, as departments used varying prefix values or offsets for specific a milepost. For instance, milepost 14.3 on the Berkshire Spur might be 14.3, B14.3, B-14.3, 614.3, or 814.3. With the advent of implementing an enterprise-wide GIS model on which people could display their datasets, the GIS group needed to establish a consistent naming and measurement convention and publicized it. Although the original centerline route system forced the establishment of a standard, databases had to change once again, to incorporate the new bi-directional conventions. Working with the organization’s database administrators proved invaluable for this exercise. Of course, even with the adoption of specific standards, many databases simply needed to be cleaned up. For example, it was not uncommon to find data listed as "B-S" in a database, when the only valid directions for the Berkshire Spur ("B") are east ("B-E") and west ("B-W").
Closely related to establishing standards, is the critical concept of educating users. All of the standards in the world are useless, if people are not aware of them. At the Thruway, it was a tremendous aid to publish the GIS database requirements on the Intranet. This continues to provide a place for people to discover information on their own, an easy location to direct new users, and a valuable reference source for those who need reminding. It was important to make the instructions as explicit and as straightforward as possible, to provide information, and not appear discouragingly difficult. Simplicity has indeed turned out to be the key. Even with specific instructions for adding route events, users overwhelmingly prefer the easier task of loading a single layer file. This file stores references to the event data source and how to map it, so mapping the event is inherent. Another important educational item is making sure that end users are aware that not all of their data may show up on the map. Users should look for this, and be able to diagnose problems (misidentified or missing directions, erroneous measurement ranges, etc.). For example, it becomes a real problem if a user maps a database and makes critical decisions based solely on the map display, completely unaware that only 27 of their 29 data records display on the map.
Beyond simple education, it is critical to understand the useful limits of your route system. In some cases, dynamic segmentation may not always be desired. Some users at the Thruway still prefer to map existing information based on unique link identifiers. Their data does not vary from one exit to the next on the controlled access highway. In many cases a simple join to a database is more appropriate. For instance, GIS users at the Thruway, display data concerning bridge information based on a unique bridge identifier, not the milepost. This avoids unnecessary positional inaccuracies, caused by restricting data to fall upon the roadway. The following figure shows a single bridge two ways. The red point shows the position based on its recorded milepost (141.73), using dynamic segmentation. The blue point shows the true location of the bridge. Mapping a feature like this as an event limits the bridge to the highway. Instead, joining a database to a more accurately placed graphic with on a common identifier field, allows better analysis of the data.
Figure 7.
The red point shows the bridge location based on its milepost. The blue point shows the bridge’s true location.A final element to recognize is that as useful as a bi-directional system is, it is important to also maintain a centerline system. Often a centerline is all that a user needs. Data (like daily traffic volume) could be the same on both sides, or the user may want to produce a generalized, small-scale map. In addition, not all events occur on a roadway (e.g., lawn mowing or landscaping in the median, camera or radio tower elements between lanes, etc.). The most versatile means of mapping events is by using both the centerline and bi-directional routes concurrently. This method can indicate whether or not there is a directional component to the data, and is also valuable for showing databases that are being enhanced, by the addition of a directional component. If mapping with live events of both a bi-directional and centerline system, the information will "pop" to the correct roadway as database managers enhance their records with a directional attribute. For instance, route "ML" suddenly changes to "ML-N", letting the true value of live event mapping to show through, as the latest changes to the databases are instantly reflected in the mapping. The Thruway has found that the best way to do this is with a single route subclass that contains both the centerline and the directions of travel. For display purposes, the user can change the centerline symbol with a dimmed hue (as in Figure 6), or no color at all. For application purposes, however, data shows up on the map whether it has a directional component or not. Both the "ML" data and the "ML-N" data show up on the map, and the user maps the event database only one time to see both.
Without a doubt, a bi-directional route system offers substantial benefits over the traditional centerline approach. It allows the transportation GIS community to perform analyses via a much more insightful and informative approach. However, it is important to keep in mind that bi-directionality cannot solve all problems. The best approach is to provide multiple route systems for the end-user community, and through proper education, let them decide which is the most appropriate for analyzing their own data. With three routes—centerline, bi-directional, and both—all built on the same graphics, users have the flexibility to use the system that works best for them. At the Thruway, the approach now recommend, includes using the combined bi-directional/centerline route system, and with symbology, making the imaginary centerline "invisible". This recreates what, in effect, is happening in real life.