ABSTRACT
In many GIS application, it is essential to perform an accuracy assessment analysis which basically relies on sampling method and number of selected samples. This paper outlines the process of employing simple and stratified random sampling and finding the optimum sample size in GIS. Two sampling methods such as simple and stratified random sampling are implemented on G³venc Creek Basin, Ankara, Turkey in order to draw samples for the elevation variable in GIS environment. For various sample sizes the optimum sample size is established for each sampling scheme as well as assessing the efficiency of the sampling methods.
1. Introduction
Determination of required sample size is a very important task in many spatial problems, since the accuracy of estimations about the population is basically dependent on the sample size. Although there are some rules of thumb on the required sample size in conventional data analysis (Walfond, 1995), when sampling frame is spatial the optimum sample size relies on the area of concern.
In this study, a GIS-based methodology is proposed for implementing the simple and stratified random sampling techniques. The optimum sample sizes from both sampling methods are determined by using ArcGIS for the elevation variable. The two sampling methods are implemented on G³venc Creek Basin, Turkey, in order to draw elevation samples in GIS environment. For various sample sizes, summary statistics such as mean, mode, variance standard deviation are obtained as well as computing the confidence intervals. The optimum sample size for each sampling scheme is found based on the length of confidence interval and standard error of the mean. The performance of two sampling methods is evaluated by comparing the sample statistics with the population parameters.
Moreover, the G³venc Creek BasinÆs mean elevation found from hypsometric curve is compared with the ones obtained from both sampling methods implemented in GIS framework. In addition to that, the elevations of existing five rain gauge stations are evaluated in terms of their representative ability of the Basin.
2. Sampling Methods
The sampling methods are basically divided into two categories such as, probability and non-probability sampling. The non-probability sampling is based on subjective judgement, while the probability sampling uses random chance as determining factor for an observation to be involved in the sample (Walford, 1995). In this respect, probabilistic sampling has advantages over non-probabilistic sampling since it ensures that all the population members have equal chance of being included in the sample. It also minimizes the bias introduced into the sample by subjective judgement of the researcher.
There are mainly five sampling tyres in probabilistic sampling scheme, namely:
- Simple
- Stratified
- Nested
- Cluster
- Systematic
Among these methods of sampling, stratified and simple random sampling techniques are the two of most widely used ones. The simple random sampling is usually used for the situations where the population size is known. In this method each member of the population is identified and assigned a unique reference number. Then, based on randomly generated numbers, samples are drawn from the population. Principally, simple random sampling forms the basis of other probabilistic sampling methods. Stratified random sampling is composed of grouping the members of the population into strata. By using simple random sampling scheme, samples are drawn from each stratum and than the selected observations are pooled to form a single sample set.
3. Description of the Basin and the Methodology
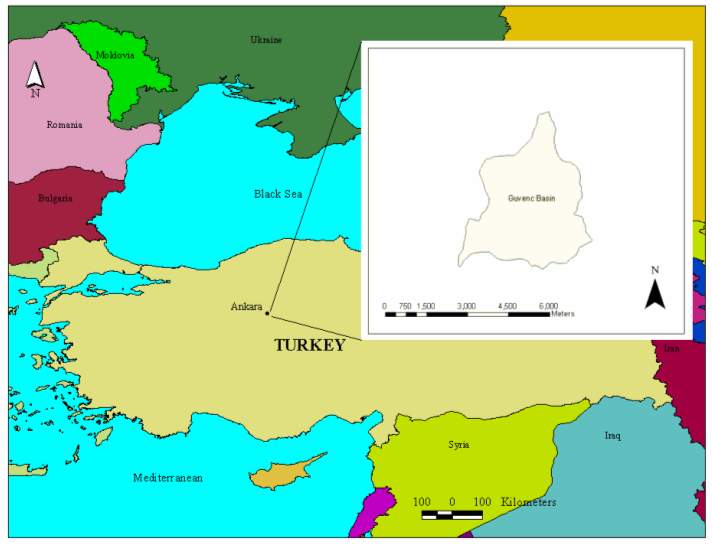
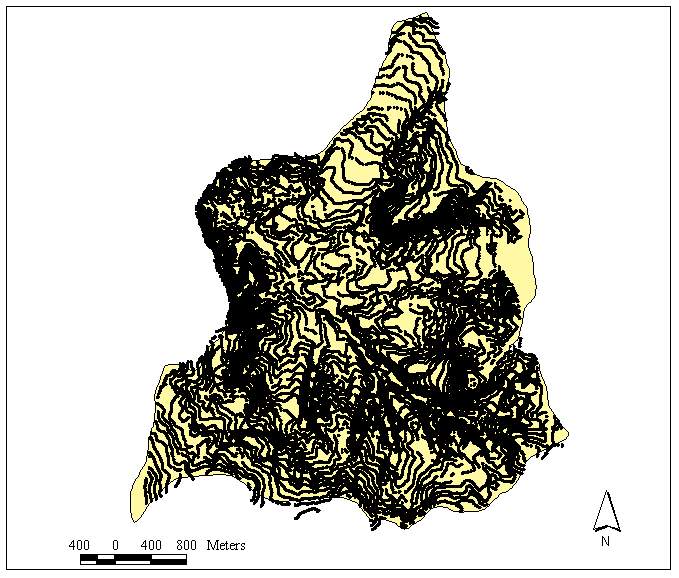
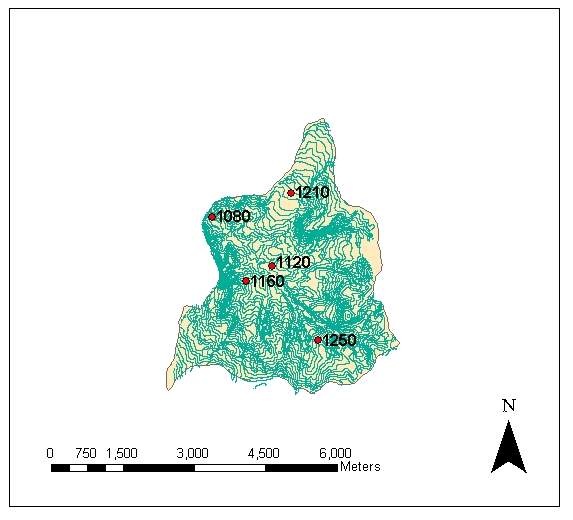
G³venc Basin is located at G³venc Village of Yenimahalle, Ankara,in Middle Anatolia region of Turkey (Kupcu, 1996). The basin has an area and perimeter of 15.9 km2 and 19.5 km, respectively.The location of the basin in Turkey and its shape is given in Figure 1. There are five rain gauge stations installed in the basin (Figure 2).
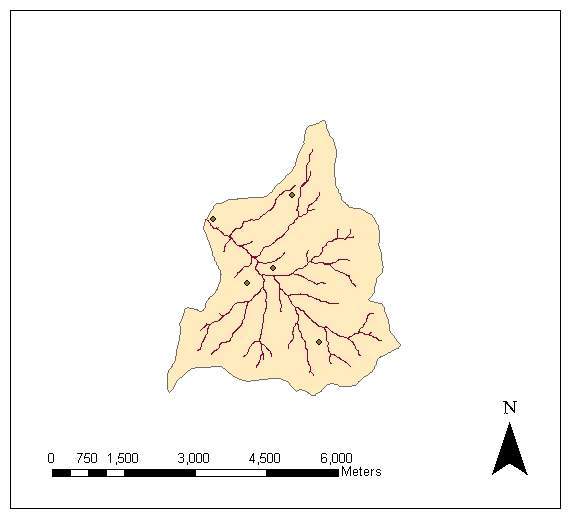
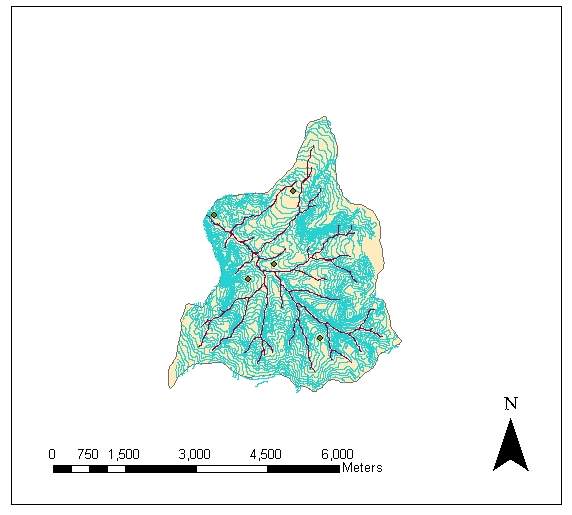
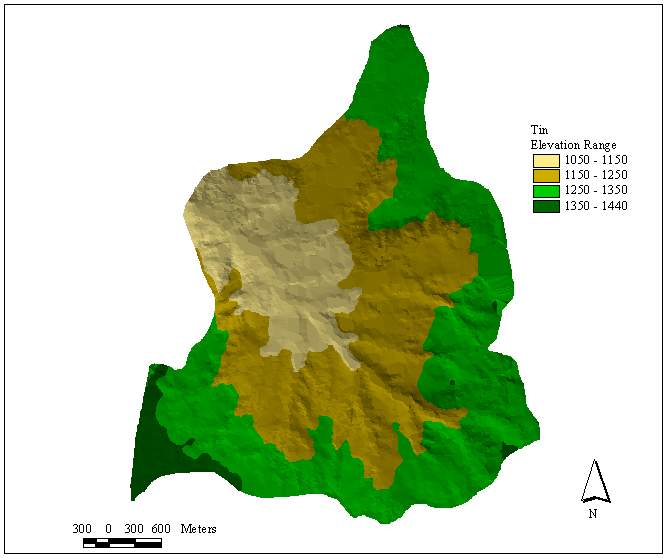
The available data for the basin were in the form of digital contour line information (Figure 3). In order to apply both sampling methods, the area of the basin is converted into set of points with attributes of elevation. For this purpose, first a TIN layer from the contours is created (Figure 4). Then the raster TIN layer is transformed into a vector layer of points (Figure 5). Later the points in Figure 4 are associated with the elevation attributes by using the ōJoinö operation in ArcGIS. In joining the elevation attributes to the points, each point is given a mean elevation value from the contour lines (Esri, 2000) The newly obtained layer in Figure 5 is composed of 89728 points with elevation values. Point density in the basin is 177.7 points/m2. The mean elevation for G³venc Basin is found to be 1230.06 m with a standard deviation of 73.92 m, which corresponds to coefficient of variation (c.o.v.) of 6%. The minimum and maximum elevation values in the basin are 1050 and 1440 m, respectively. In the basin, 17% of the area has elevation less than 1150 m, 42 % has elevation range between 1150 m and 1250 m, 38 % has elevation between 1250 m and 1350 m and finally, 3 %, has elevation greater than 1350 m. In other words, 80 % of the elevation values in the basin change between 1150 and 1350 m range.
Having obtained basin area in the form of points, the next step is to implement simple and stratified random sampling methods. For this purpose, Visual Basic scripts are coded within ArcMap. The following algorithm is used for simple random sampling:
1. Generate random numbers between the coordinate ranges of the points
2. Search the total population and find the corresponding point which has coordinates generated randomly in step 1
3. Record the elevation of the selected point
4. Repeat steps 1-3 until desired number of samples are selected.
An example for simple random sampling with sample size of 10% of 89728 points is given in Figure 6.
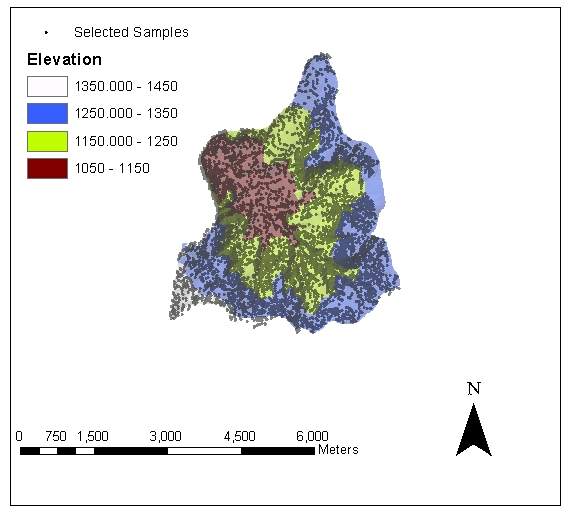
For stratified random sampling, the basin is classified into four strata based on the elevation. The first stratum is composed of elevation value less than 1150 m, the second and third ones contain points with elevation values changing between 1150-1250 m and 1250-1350 m, respectively. Finally the forth stratum consists of elevation values greater than 1350 m. In this sampling scheme, 17 % of the total sample size is selected from the first stratum, 42 % and 38 % of the total sample size are obtained from the second and third strata, respectively. The rest (3 %) is drawn from the forth stratum.
The algorithm developed for stratified random sampling is similar to the simple random sampling and as follows:
1. Generate random numbers between the coordinate ranges of the points
2. Search the total population and find the corresponding point which has coordinates generated randomly in step 1.
3. Read the elevation of the selected point.
4. Locate the point into one of the four of the strata by checking the elevation value.
5. Repeat steps 1-4 until each stratum contains required number of samples.
4. Determination of Optimum Sample Size
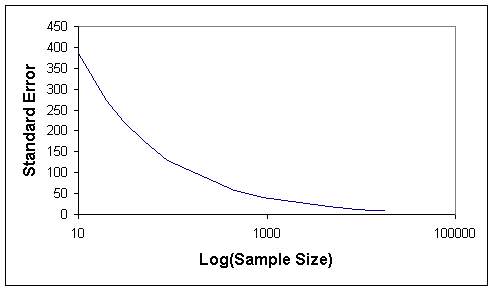
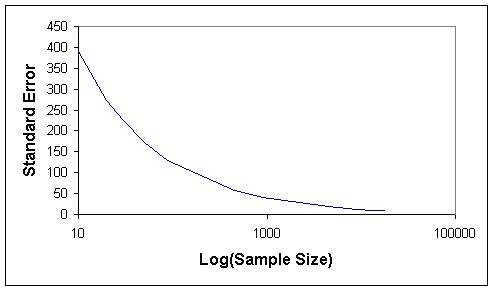
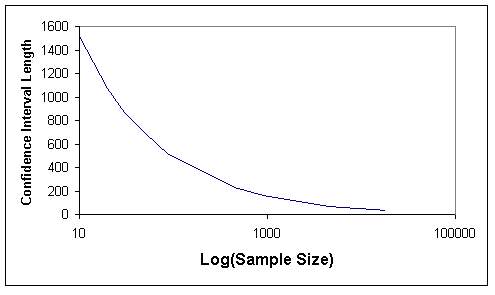
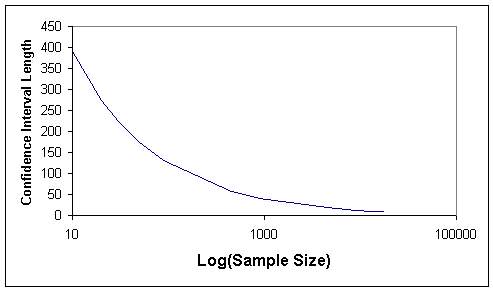
In order to determine optimum sample size, several number of samples are drawn based on each sampling method. Statistics such as, mean (s), standard deviation (s), variance (s2), mode, minimum (min), maximum (max) and standard error of the mean (ss) are computed as well as establishing the confidence intervals. The results are tabulated in Tables 1 and 2 for simple and stratified random sampling methods,respectively.
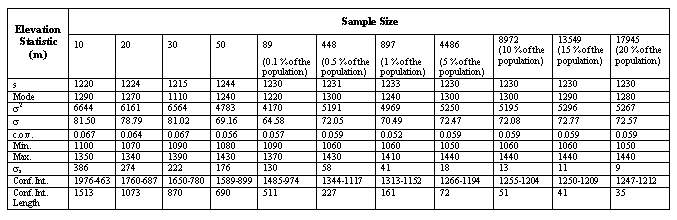
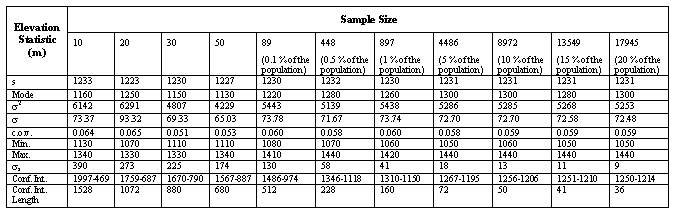
Tables 1 and 2 indicate that when the sample size increases, the length of confidence internal and the standard error decrease, as expected. The graphs of sample size versus standard error (Figures 7 and 8) and sample size versus confidence interval length (Figures 9 and 10) for both sampling methods show that sample size of 5 % of total population (4486) can be considered as optimum sample size, since the curves start levelling out at this sample size. This fact can also be seen from Figures 11 and 12, where the means from both sampling schemes become constant at the sample size of 4486.
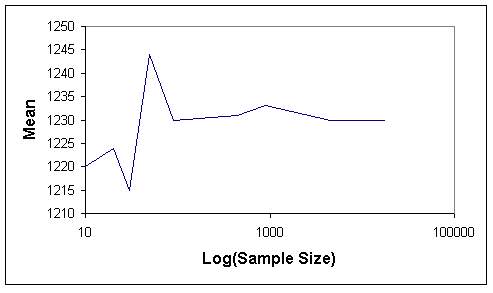
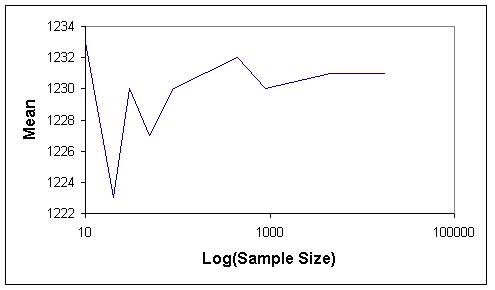
Moreover when the standard error of the mean values of the two sampling techniques are compared, it is seen that they give almost the same values. Hence this indicates that, both sampling schemes can be effectively used in such analyses. However simple random sampling is computationally more efficient. Based on the proposed methodology, in this study the mean elevation is found to be 1230 m. On the other hand, the mean elevation computed by Denli et al. (1996) is 1256m, where the median elevation of 1235 m is obtained from hypsometric curve (Kupcu, 1996), which is closer to the one computed in this study (1230 m).
As it is mentioned before, the 80 % of the basin area has elevation ranging between 1150 and 1350 m. When the elevation of rain gauge stations are examined (Figure 13) it can easily be seen that elevation values of four, out of five stations are in this range.
5. Conclusion
This study presents a GIS-based methodology for estimating the mean elevation in a river basin. In hydrology, there are various methods for the determination of mean basin elevation and other parameters related to the basin and these methods are usually cumbersome, especially the basin is large. If better and easier methods can be found by using GIS techniques, it will help hydrologist a lot. In this respect, the proposed methodology is in fact a general and a straight forward one and can also be used for estimating other properties of basins such as total basin slope and aspect variables.
The proposed methodology is implemented on a small basin in Turkey. The mean elevation is estimated based on simple and stratified random sampling methods. However, it can be applied by using other sampling methods by coding appropriate scripts.
The optimum sample size for both sampling schemes is determined based on the standard error of the mean and the length of the confidence intervals. Since G³venc Creek Basin is relatively homogeneous in terms of elevation with c.o.v. of 6 % the optimum sample size is obtained at 5 % of total population. However note that for basins having elevation more variable than G³venc, the optimum number of samples would subject to change. On the other hand, since the methodology is a general one it can easily be implemented on greater basins.
6. References
Denli, O., Tekeli, I., Demirkiran, O. and Sevinc, N., 1996. Research on Rainfall and Flow Characteristics of Ankara-Yemimahalle-Guvenc Basin, Annual Final Report of General Directorate of Rural Services (in Turkish).
Esri, 2000. ArcGIS User Manual, Esri Publications, Redland, USA
Kupcu, O., 1996. Application of GIS Techniques to Derive SCS Synthetic Unit Hydrograph, Master of Science Thesis, Middle East Technical University, Ankara, Turkey.
Walford, N.,1995. Geographical Data Analysis, John Wiley and Sons Inc., New York, USA.
Authors
H. Sebnem D³zg³n
Dr.
Geodetic and Geographic Information Technologies
Middle East Technical University
Civil Eng. Water Resources Lab.
K4-123 06531 Ankara Turkey
Tel: +90-312-2105415
Fax: +90-312-2101002
duzgun@metu.edu.tr
Nur³nnisa Usul
Assoc. Prof. Dr.
METU, Civil Engineering Dept.
Ankara, 06531, Turkey
nurusul@metu.edu.tr