How to Reduce Your
Data Management Costs:
Examples from the Brazil Offshore Regional Interpretation Project
Donald W. Downey
Abstract
A demonstration of ArcView techniques to georeference geologic maps and overlay ChevronTexaco Data Browser well locations and seismic shot points will show how the data ordering process was significantly enhanced using low-cost software tools.� A demonstration of Microsoft Access will show how a relational database can be used to merge well header data from diverse sources.� Following data merging, clean-up and organization in Access, the data can be analyzed and graphically displayed using ArcView.� An example of well location clean-up from the Brazil Offshore Santos Basin will illustrate the usefulness of statistical analysis and graphical display of data errors using ArcView.
Managing geologic data for interpretation
This talk focuses on the GIS needs of earth scientists who merge many types of geologic data to find, evaluate and produce hydrocarbon reservoirs.� These earth scientists needed a data management tool to prepare their data for interpretation databases.� ArcView has proven to be the best tool to analyze and merge various datasets before loading to the workstation.
The Brazil Offshore Regional Study offers several examples of how to manage a large interpretation project.� The primary challenge was the integration of data from many sources.� Using in-place software applications, we were able to halve the time required to integrate data from diverse sources into our interpretation database.
Who is responsible for data management?� At ChevronTexaco, each interpreter is the owner of their data.� No one knows the data as they do.� Interpreters work as individuals with total ownership of the data and IT functions as a team without ownership of the data.� Even though the IT staff functions as a team, there is no generic �data management plan� or group that quality-checks and loads data without specific requests from an interpreter.� Because of these inherent organization styles, we must include IT staff early in our project planning meetings. �
A typical project goes through 3 phases: (1) bid-round block evaluation, (2) leased block evaluation with exploration well planning and drilling, (3) development well-planning, drilling and production.� The Brazil Offshore project has gone through a block evaluation phase where bid-round data was loaded rapidly and with little quality control.� After we acquired some acreage, we started to order additional well and seismic data to do a regional evaluation.� These changes in focus require us to quality-check and update the project databases to match the needs of the interpreters.
The high cost of data management
Data management costs are often underestimated.� An hour of data management costs as much as an hour of interpretation!� Data management is a clear area for productivity gains; we are basically just transferring information from their computer database to our computer database.� Much of our savings is �low-hanging fruit� from improved communication and data management tools.� There are three main areas of cost savings: (1) using data vendors to pre-format data, (2) data scrubbing using ArcView and Access to quality-check well and seismic shot point data and (3) organizing and managing files for a team-based work environment.
Problems with merging data from many diverse sources
The most significant problem associated with merging the data were the file formats.� For example, we received successive sets of bid round data from ANP (Brazilian Oil Ministry) in tiff format, then Word format, and then in security-locked pdf file and within each of these documents there are different data formats!
Example of data sources for the Brazil project
|
Data source |
Available data |
|
ANP (Brazilian Oil Ministry) |
Bid packages |
|
Petrobras |
Competitor/Partner data |
|
IHS Energy |
Petroconsultants data |
|
Chevron interpreters |
Well and seismic picks |
|
Core Labs |
Sequence Stratigraphy Study |
|
Robertson Research |
Paleo data, Sequence Strat Study |
|
Other oil companies |
Well trades |
|
Texaco |
List of data purchased |
|
Veritas |
2D and 3D data over shallow-water blocks |
|
ANP |
Bid package data over bid-round blocks |
|
Petrobras |
Partner data for shared blocks, studies |
|
TGS/Nopec |
2D data over shallow-water blocks |
|
LePlac |
2D data over deep-water blocks |
|
GULFREX |
2D data over deep-water blocks |
Issues such as language translation, units, cartographic datum, seismic shot point reference point, stratigraphic nomenclature, well log versions, seismic versions must be accounted for.� The well data types that need a plan are well locations, directional surveys, elevations (KB, DF, SL, WD, and TD), logs, picks, time-depth, lithology, pressure, temperature, and shows.� Decisions will need to be made up front about cartographic datum, stratigraphic columns and well log templates, OpenWorks� project management, project synchronization, and fault handling.� Planning for seismic data management should include detailed seismic basemaps, knowledge of navigation data and processing/balancing corrections.
Techniques for Managing Data
Each type of data to be including in the geologic interpretation should have a data management workflow with a plan (data ordering), execution (receipt of data and data loading) and ending (quality-checking and interpretation).� An example of a workflow is the adding of competitor activities to the database.� Often, even if we get a well location, we do not get the datum information.� We also neglected to remember the real purpose of keeping track of competitor activities � to find out what kind of prospect they were drilling and what worked or did not work for the competitor.� If we could find the datum, we would load the well location, but did not follow-up with an examination of the seismic data, and we did not pass this information on the interpreters who were working the area.� Look for these kinds of �black holes� that are swallowing your data before it gets where it needs to be.�
Flowchart of well data for competitor activity displays of play-type on seismic section.
Planning for data management while ordering geologic data
Before signing a contract for external data services there are several thoughts to keep in mind: (1) we are the driver of the data transfer process and (2) if we have to re-format data, additional data management costs will be incurred loading the data.� The service companies are in the business of helping make our data management cheaper and they are waiting for our suggestions to make their services better,
Spending some time on the data order document and distribute it to the people who will handle your data.� This is a quick way to plan for the management of your data as you order it.� Here is a table of staff members and what information they could use when you order seismic data.
|
Staff |
Their Duties |
Interpreter�s Responsibility |
|
Interpreters |
Evaluate data needs, select data to buy |
Use ArcView tools to find available data, data we have requested, data we have loaded.� Create order request with detailed information on data types and formats.� Develop a data management plan to be used by the rest of team. |
|
Management |
Make decision to buy data |
Use email and PowerPoint presentation to make decision. |
|
Finance-Legal departments |
Process order |
Carefully document the data ordered.� Do not just highlight lines on a seismic basemap. |
|
Data vendor or contractor |
Prepare data, transmit to customer |
Put your expectations from the vendor up-front and in writing.� Use the contractors to do work of re-formatting data so that the data can be loaded directly from the dataset passed to ChevronTexaco. |
|
Data loading staff |
Log-in data, re-format data, load data |
Ask the data management staff what data formats they can load to the workstation fastest before you request the data from the vendor.� Digital tape types should also be specified as our ability to read each tape type is machine (location) dependent. |
|
Technical records staff |
Log-in data |
The data order should be copied to the data loaders, so they can check the data when it arrives.� Data should be clearly labeled with detailed transmittals. |
Receiving and loading data to ChevronTexaco�s interpretation system
We must have a detailed record of what data we ordered to determine if we have received all of the data we have paid for.� Use the existing document record system (Well File Index System (WFIS), Field Files (GGIS) to index digital reports on CD or tape.� All data received by Chevron should have detailed transmittals and labels that can be matched to the data order.�
Data merging and quality-checking
The offshore Brazil project is an example of a large project with 3000 kilometers of coastline and 17,000 wells drilled.� There is simply too much data to check �by-hand�.� We must use data management tools to analyze the data both statistically and visually.
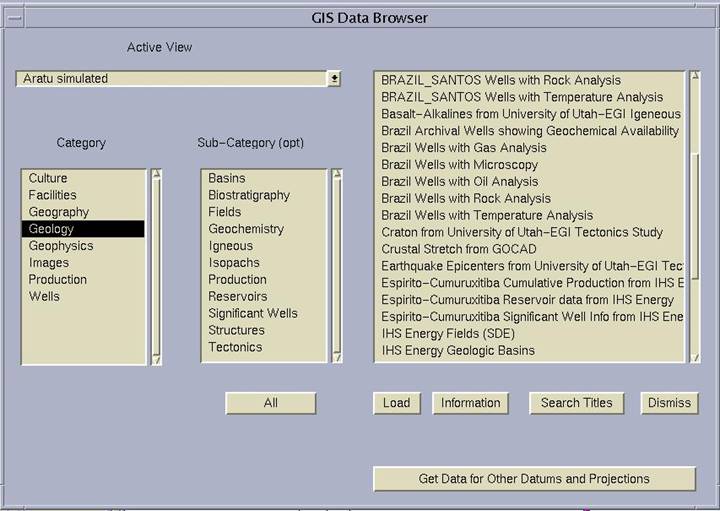
ChevronTexaco has developed external tools to hot-link to the OpenWorks� database.� These tools include web-based reports, ArcView mapping extensions (Data Browser), cartographic projection tools, and Excel-Access databases.� We need to develop additional data scrubbing tools and we need to continue to enhance project synchronization.� Planning to load all of the required data at once simplifies the data loading process.� For example, to place a well on a map, cross section and seismic section we need the cartographic datum, well location, well elevation, deviation survey, well log, and time-depth data.� It is easier to request all of this data at once for each well.
The ChevronTexaco ArcView GIS Data Browser is a quick way to download many diverse types of data into ArcView.� If datum information is provided, all types of geologic data can be viewed in the same spatial reference frame.� This tool has proved to be especially useful for seismic data ordering where we can view available seismic lines, lines we have ordered, lines we have in-house and overlay this seismic navigation data on a geologic map showing the potential hydrocarbon-bearing structure of interest.
Updating versus loading data to a database
Let�s remember one basic fact about data loading.� We are just moving digits from one database to another.� Understanding the data model is important to mapping the transfer of data between databases.
Table of a portion of the Landmark OpenWorks� database
|
COLUMN NAME |
DEFINITION |
|
WELL_ID |
The system-assigned, unique identifier for a well. |
|
DATA_ACQ_CO_ID |
The system-assigned, unique identifier for a company. |
|
DATA_ACQUISITION_TYPE |
The type of data acquisition. |
|
COUNTRY_ID |
This is the system-assigned, unique identifier for a country. |
|
INITIAL_CLASS_ID |
This is the unique identifier for a well class. |
|
CURRENT_CLASS_ID |
This is the unique identifier for a well class. |
|
INITIAL_STATUS_ID |
This is the unique identifier of a status code for a well. |
|
CURRENT_STATUS_ID |
This is the unique identifier of a status code for a well. |
|
CURRENT_STATUS_DATE |
This is the effective date of the current well status. |
|
CURRENT_STATUS(IE8) |
This is the current status of this well. |
|
WELL_SYMBOL_CODE |
This is a unique identifier of the symbol assigned. |
|
DATA_SOURCE |
The person, vendor, interpreter of information. |
It is much more difficult to update a database than to load new data into an empty database!� Software is needed to quickly quality-check large datasets (examples: regional projects, large fields).� Hand-editing is needed for �problem wells�.� My advice is to export existing data, analyze the data in ArcView and/or Access, merge the datasets and re-load the new updated dataset.
Inevitably, there will be �problem wells� that do not have a clear answer.� My advice is to go for the 80% solution, get most of the wells loaded, and then re-visit the problem locations.� Overlay multiple sources of data and inspect visually to find the correct answer. �Do some detective work; go back to the original paper well files and maps.� Use ArcView tools to analyze data and find errors.�
If one dataset is not always correct, we must merge data from several different sources.� The data should be analyzed to identify the correct well locations.� The source of the data must be identified in case we need to back-track and re-check the dataset.
Matching well database keys
The workflow to match wells from different databases is:� (1) Import Excel files to Access, (2) build relationships between keys, (3) build queries, (4) export report.� The trick to merging well locations databases to edit the wellnames until you have created a key that can be matched.� Run the two databases (now with matching wellnames) through an Access query or ArcView join.� Take the remaining Wellnames that did not initially match and re-edit to create a match.� Check the match by comparing the well locations.� Wells with significant differences in well locations may have been miss-matched.� Loop through this process until all wells are matched.� Some wells may not match, and will be put in the problem well category.�
Quality indices derived from data analysis
Some quality indices may be derived from this analysis.� The number of sources that contain the data may be considered a type of quality index.� The error distance between well locations can be a quality index.� These levels of data quality can be shown on a map using color and size parameters.�
Sorting to quality-check database
It is amazing how much bad data can be present in a database.� I recommend that you sort the data in the database to allow bad data to �pop� to the top of database.� Look for bad well locations, misspelled wellnames, missing basic data (KB, WD, TD), proposed wells, well plans, bad REFNOs (improperly indexed well ID keys).� You may ask, �If no one has noticed the bad data, why worry about it?�� The problem is that the interpretation software runs much better with clean data than with dirty data, even if the problem well is not of immediate interest.� In addition, the geologic interpretation is much easier with clean data.� I often hear �The well correlation to the seismic data is clear, now that we have cleaned up the data!�
Statistical analysis and visualization using Esri ArcView GIS software
The ArcView well location error-checking workflow is (1) load dbf spreadsheet of well locations to ArcView data table, (2) run ArcView extension that calculates distance and direction between two different well locations drawn from different sources (ANP Brazil data, IHS-Petroconsultants and Chevron OpenWorks�), (3) graphically display error results in View window with lines between old location and correct location.
The example of the left shows wells with gross errors in well location, the example on the right shows a well with a datum-shift error.� The blue dots are our original locations; the red triangles are the correct locations.� Calculating the distance and direction of well locations errors allow us to break the errors into (1) gross errors, (2) datum shift errors, and (3) �close enough�.
Interpretation and project handoff
File Management
ArcView and other geologic interpretation applications create many files.� These files must be organized and indexed.� Maintenance of records during the life of an interpretation project facilitates proper project handoff. �Because we work in widely-spaced offices in a team-based work environment where interpreters come and go frequently, we must be prepared to handoff a project to the next worker.� Interpreters need to manage and handoff these files while �hot� so that they can use the project charge code to wrap up their project.
Technology Seeding
Payoff on a single project is can be significant, so use the same technology on successive projects.� We want to �seed� this technology by making applications portable and flexible.� Publicize the techniques that work and get management buy-in to continue development and maintenance of the applications.
Conclusions
Loading basic well information is taking too much time, especially for large regional projects.� Industry needs to share basic data (well locations, elevations, total depth) that we are already reporting to governmental agencies.� We need to create and follow industry standards.� Service companies need to stop �competing� with each other by restricting data models and data transfer.� We must use data analysis to find patterns of errors in our digital data files.� We need work as a team by communicating with our group and handing-off data correctly.� Focus on your interpretation needs, not on the software application�s limitations.
Acknowledgements
Chevron/ChevronTexaco
Mark Choiniere, Brad Dean, Dave Stodola, Larry Espinosa - ArcView Browser
Ron Clemons - Seismic Navigation
Bach Dao - Cartography
Karen Andelin - Data Loading
Extensions used in analysis
Identify Features Within Distance ArcView 3.1 extension by:
Jeff Jenness
3020 N. Schevene Blvd.
Flagstaff, AZ� 86004
USA
http://jennessent.com/arcview/arcview_extensions.htm