GIS-ROUT:
Integration of ArcIMS and a River Water Quality Model
Xinhao Wang, Changming Du, Mike Homer,
Scott D. Dyer, and Charlotte White-Hull
ABSTRACT
Scientists
often use mathematical models to assess river water quality. The study presented
in this paper links ArcIMS to ROUT, a river model
evolved from the U.S. Environmental Protection Agency�s Water Use Improvement
and Impairment Model, to create a Web-GIS based river
simulation model - GIS-ROUT.� GIS-ROUT
predicts consumer product ingredient concentrations in surface waters in the United States that receive one or more discharges from
publicly owned wastewater treatment plants. The integration of spatial data,
GIS, and analytical models in GIS-ROUT makes it possible to examine and share
the results of dynamic linkages between water quality and human activities to
support environmental risk assessment by scientists in different locations.
INTRODUCTION
Municipal wastewater treatment plants (WWTP)
serve approximately 72 percent of population in the United
States. Typically, effluent from WWTPs is discharged directly into surface waters, such as
rivers.� Consequently the quality of
receiving waters is affected by human activities via WWTPs
(O'Neill et al., 1997).� Water quality
can be assessed based on its function to maintaining diverse and abundant
ecological systems and to supply safe drinking water. Water sources and uses
are intertwined. Tools that take this relationship into account are needed for
the proper management of water resources. Our team took the approach of
developing an integrated modeling system that consists of consumer use of
household down-the-drain chemicals, river modeling, Geographic Information
System (GIS), and WWW technology.
Although many models have been developed to
simulate the chemical concentrations in rivers, the use of the models has
traditionally been limited to a few professionals and limited to a narrow
spatial scope. This could be attributed to the difficulty of use and
interpretation of simulation models. For example, model input and output are
normally provided in text file format, both are difficult to prepare and be
interpreted. Along with recent technological advancements, especially the
increased availability and relative affordability of GIS, many GIS-based
surface and subsurface water models have been applied in resource and
environmental management (Cowen et.al., 1995;
Merchant, 1994; Smith and Vidmar, 1994; Warwick and Haness, 1994; Ross and Tara, 1993; Greene and Cruise, 1995;
Bennett, 1997; Djokic and Maidment,
1993; Shamsi, 1996; Goodchild,
Parks and Steyaert, 1993; Poiani
and Bedford, 1995; USEPA 2001). Researchers have indicated the necessity of
such integration with best available technology to overcome the barriers that
hinder the use of analytical models (Coroza, Evans
and Bishop, 1997; Sui and Maggio,
1999).
Recently the use of the World
Wide Web (WWW) has increased enormously in almost every field. The most
significant contribution of WWW is that it helps to remove the barrier of physical
distance. People in different parts of the world can share data and other
digital information via WWW, thus allowing them to present and disseminate
information and interact with others. Literature has demonstrated the potential
of WWW being used as a distribution mechanism for GIS applications (Huang 2001,
Doyle 1998, Kingston 2000). Most of the WWW related GIS applications are
dominated by static map images (Morrison 2002).
For consumer product
manufacture, use and disposal, a significant effort for scientists and managers
is conducting environmental and human exposure and risk assessments. For
environmental assessments risk is characterized by comparing the predicted
exposure concentrations (PEC) with the predicted no effect concentrations
(PNEC) for ingredients used in consumer products. Normally, one PEC value is
calculated for the entire country using a tabular approach based on national
dilution factors. Unfortunately, this approach does not consider regional
variation and the potential cumulative effects of persistent and poorly removed
ingredients. In addition, it is impossible to assess water quality at drinking
water intakes, which is an important facet of indirect human exposure
measurement.
Within this context, a research
team consisting of scientists at the University of Cincinnati and The Procter & Gamble Company
developed a system that integrates an existing model, ROUT, with GIS and the
Internet. This Web-GIS-based river water quality model (GIS-ROUT) provides a
flexible tool for risk assessors to determine the potential of consumer product
ingredient contributions to surface water quality in the United States. The objective of this study is to explore
the efficacy of a fully integrated GIS-ROUT as a user-friendly decision-support
tool. While ROUT predicts the environmental fate of consumer product-derived
constituents found in municipal wastewater and receiving rivers, the addition
of a GIS to ROUT, allows for spatial analysis such as query and overlay. The
WWW technology provides a gateway for users in different parts of the world to
remotely access the GIS-ROUT model to answer �What if�� questions related to
risk assessment and human exposure.
The GIS-ROUT Model
Since consumer product
ingredients can be discharged to the environment via municipal treatment
facilities, studies of the fate of these ingredients in receiving waters have
focused primarily on calculating concentrations immediately below municipal
outfall mixing zones (McAvoy et al., 1993, Rapaport, 1988). To understand the water chemistry
concentration in a broader view, WUI2 - Water Use Improvement and Impairment
Model was developed by the U.S. Environmental Protection Agency (USEPA). WUI2
is a steady-state water quality model incorporating wastewater treatment
infrastructure, industrial point sources, and hydrologic and water quality data
of receiving water bodies to assess potential water quality impacts of existing
and proposed wastewater treatment plants (USEPA, 1984). Due to the wide
geographic distribution of consumer product use, ROUT, was subsequently evolved
from WUI2 and several USEPA databases to incorporate population-based consumer
product loadings in addition to these conventional pollutants.� (Dyer and Caprara, 1997, Hennes and Rapaport, 1989).�
These predicted exposure concentrations can then be compared to
predicted toxicological endpoints to determine the magnitude of risk.
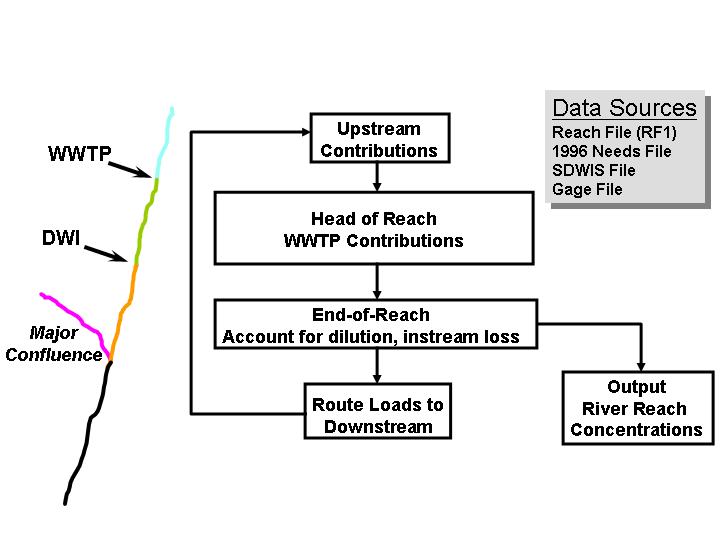
Figure 1. GIS-ROUT modeling process
Figure 1 illustrates the GIS-ROUT modeling
process. The Reach File 1 (RF1), a hydrological vector database of about
700,000 miles of the surface waters in the continental United States Rivers
forms the river network for the model. RF1 rivers are
broken into reaches at river confluences, WWTP discharges, and drinking water
intakes (DWI), where major chemical or flow changes may occur. Other files used
in GIS-ROUT are large USEPA data sets including: GAGE, containing mean and low
(7Q10) river flow data (USEPA 1995); the 1996 USEPA Clean Water Needs Survey
(NEEDS File) containing treatment process data for more than 32,000
publicly-owned sewage collection and treatment facilities (USEPA 1997); and the Safe Drinking Water Information System File (SDWIS),
describing locations and characteristics for drinking water intakes (USEPA
1998). All data were linked to the RF1 network via latitude/longitude location
or unique river segment number. To estimate in-stream concentrations, the model
begins at a head-water reach and proceeds downstream, one reach at a time,
until the terminal reach of a river. After reading data from various data files
for a reach, GIS-ROUT computes the head-of-reach concentrations, i.e.,
concentration at the beginning of a reach, by accounting for population based
WWTP input and upstream concentrations. End-of-reach concentrations are determined
by accounting for dilution and first-order loss. Concentrations at drinking
water intakes are also calculated.� The
concentrations are saved into an output file and used as upstream contributions
for the downstream reach. A detailed description of the ROUT model algorithm
can be found in Wang et al. (2000).
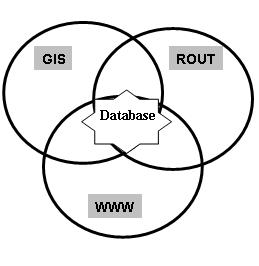
Figure 2. Conceptual design of GIS-ROUT
GIS-ROUT SYSTEM DESIGN
Figure 2 represents the design
concept of the GIS-ROUT system. In the center of the system is a digital
database. The database, which contains both spatial and non-spatial data,
contains data for rivers segments, wastewater treatment plants, and drinking
water intakes. This database is used to prepare input data for the ROUT
model. ROUT simulates river quality for
each river segment for the entire country or one or more predetermined major
hydrological basins. The modeling output is captured, stored in the database
and linked back to the geographically-referenced rivers, WWTPs,
and DWIs. The World Wide Web, coupled with a
web-based map server, provides the capability of analyzing and displaying water
quality by river segment and at each WWTP or DWI point.� The output can also be downloaded into
various statistical packages (e.g., EXCEL macros) to determine concentration
distribution curves.
The
system design improves efficiency and effectiveness of using simulation models
for decision-making. It offers a number of superior set of features over
standalone simulations, or the coupling of GIS and simulation models. The
Server-Client environment with the WWW technology does not require high
computing power of the client computers. Databases and models are maintained on
the server, which ensures an up-to-date and uniform quality. An easy access to
modeling results provides a platform for a user to define simulation scenarios,
such as the area (national or regional), parameters (chemical and physical
characteristics), and loadings (consumer population and per capita
consumption). Saving simulation results on the server provides system users the
flexibility of sharing and comparing different model simulations.
GIS-ROUT SYSTEM DEVELOPMENT AND APPLICATION
The original ROUT model, written in C++, retrieves and stores data in an Access
database. The model was modified to establish the linkage between the ROUT
model and GIS data layers. The WWTP and DWI point files were converted
to ARC/INFO point coverages using ARC/INFO's geocoding function. River
segments were created based on spatial information of the U.S. River Reach 1
river files and the location of WWTP and DWI points on the river. That is, a
river is divided into two segments if one of the following conditions is met: a
river confluence, a WWTP discharge point, or a DWI. The river segments were
grouped into routes based on the USEPA river reach number. Each segment is
assigned a unique identifier. This ID provides the link between the database
and the ROUT model. In addition, the database contains a polygon file of major
drainage basins and a polygon file of market region.
Active Serve Page (ASP) is used
to develop a series of user interface screens for data input, scenario
selection, download, hard copy output, and to execute the Rout model. ArcIMS provides functions for publishing maps and tables
through the WWW, such as querying attributes, display data layers, and zooming
and panning. The following figures illustrate a sample application of GIS-ROUT.
A user needs to logon with a unique user ID (Figure 3). This serves two
purposes. The system can keep track of its users. This also allows each user run
the model and view the modeling results independently. From the system home
page, a user may specify an area and select to run the model, or to display a
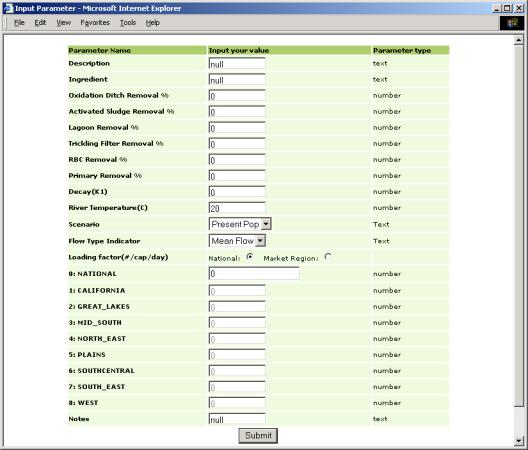
previously completed model simulation (Figure 4). If the user elects to run the
model, an input sheet will be presented for the user to enter relevant
parameters (Figure 5). After the simulation is complete, the user may load the
result for display (Figure 6). By linking the simulation result to the GIS
database, the user can clearly review the spatial distribution of river water
quality (Figure 7). When the river layer is overlaid with WWTP data layer, one
can quickly reveal the spatial connection between WWTP effluent concentrations
and river concentrations (Figure 8). By comparing the receiving river quality
from different scenarios, the impact of WWTP concentrations can be observed
(Figure 9).
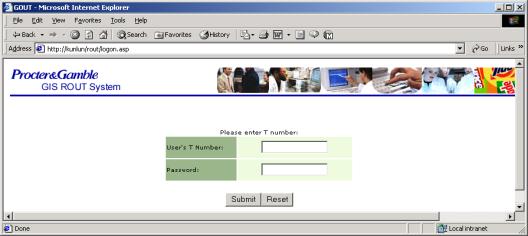
Figure 3.
GIS-ROUT user sign-on
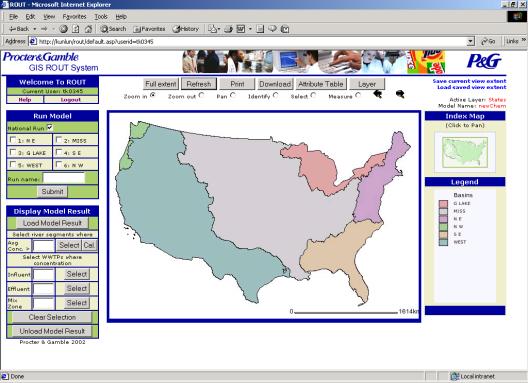
Figure 4.
GIS-ROUT home page
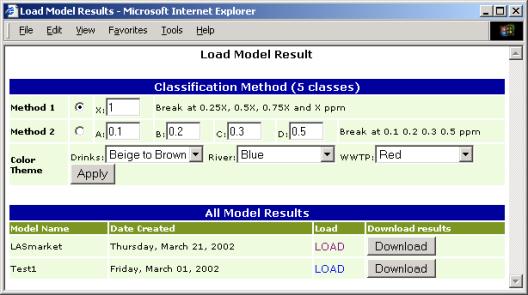
Figure 6. Load model result
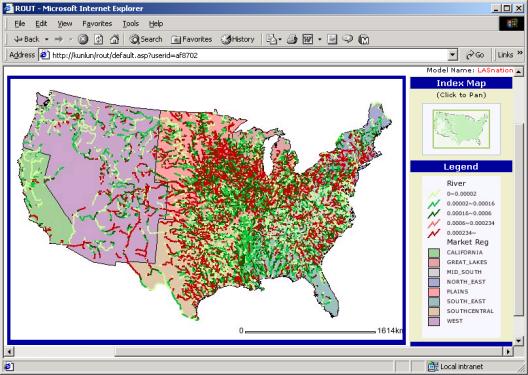
Figure 7. A sample simulation
result
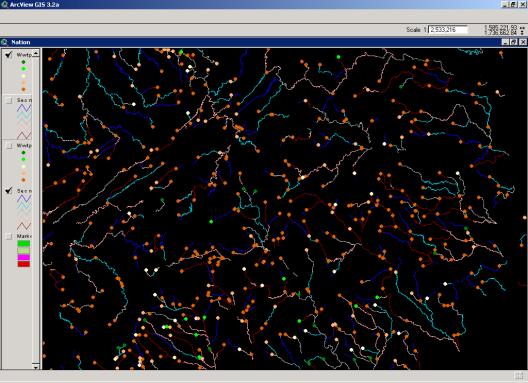
Figure 8. Overlay of river water concentration layer
with WWTP effluent concentration layer
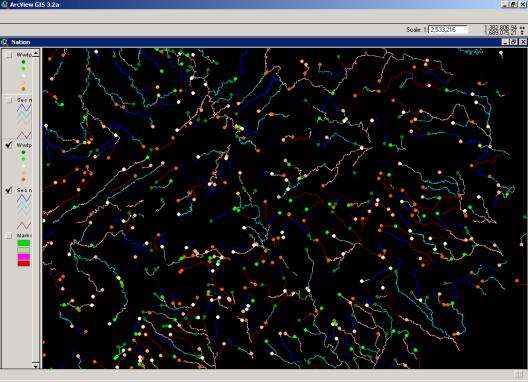
Figure 9. Affect of change of
WWTP effluent on river concentration
CONCLUSIONS
This paper presents a web based
GIS modeling system, GIS-ROUT, and its application in simulating water quality
in rivers in the United States. One important feature of this system is
that the system components are integrated and at the same time, independent
from each other. While the database is the centerpiece of the system, it is
developed independent of the simulation model. This adds the flexibility of future application of the system
in a different area. ROUT simulation is also separated from viewing modeling results. This feature avoids duplicated simulations and provides
opportunities for comparing different scenarios. All functions will be accessible through buttons
and interactive user input
screens. The system represents an effort to make simulation models available to
model users who know the purposes of simulation and may not have used the
models because of the requirements of special skills. By making the model
application and interpretation more user friendly with GIS, we expect to broaden
the uses of simulation models. The remote access provided by WWW serves the
same purpose.
REFERENCE
Bennett, D. A. 1997. A framework
for the integration of geographical information systems and model base
management, International Journal of
Geographical Information Science 11(4):
337�357.
Cowen, D. J., J. R. Jensen, P. J. Bresnahan,
G. B. Ehler, D. Graves, X. Huang, C. Wiesner, and H. E. Mackey. 1995. The design and
implementation of an integrated geographic information system for environmental
applications, Photogrammetric Engineering and Remote Sensing 61(11): 1393�1404.
Coroza, O., D. Evans, and I. Bishop. 1997. Enhancing runoff modeling with GIS, Landscape and Urban Planning 38: 13�23.
Djokic, D. and D. R. Maidment. 1993. Application of GIS network routines
for water flow and transport, Journal of
Water Resources Planning and Management 119(2): 229�245.
Doyle, S. 1998. The Potential of
Web-Based Mapping and Virtual Reality Technologies for Modelling
Urban Environments, Computer, Environment, and Urban Systems 22(2):
137�155.
Dyer, S. D. and
R. J. Caprara. 1997. A method for evaluating
consumer product ingredient contributions to surface and drinking water: boron
as a test case, Environmental Toxicology
and Chemistry 16(10): 2070�2081.
Goodchild, M. F., B. O. Parks, and
L. T. Steyaert. 1993. Environmental modeling with GIS. New York,
NY: Oxford
University Press.
Greene, R. G. and
J. F. Cruise. 1995. Urban watershed modeling using geographic
information system, Journal of Water
Resources Planning and Management 121:
318�325.
Hennes, E. C. and R. A. Rapaport. 1989. Calculation and analytical
verification of LAS concentrations in surface waters sediment and soil, Tenside Surfactants Detergents 26(2): 141�147.
Huang, B. 2001. An Integration of GIS, Virtual Reality
and the Internet for Visualization, Analysis and Exploration of Spatial Data International
Journal of Geographical Information Science 15(5): 439�456.
Kingston, R.
2000. Web-Based Public Participation GIS: An Aid to Local Environmental
Decision-Making, Computers, Environment, and Urban Systems 24(2):
109�125.
McAvoy, D. C., W. S. Eckhoff,
and R. A. Rapaport. 1993. Fate of linear alkylbenzene
sulfonate in the environment, Environmental Toxicology and Chemistry 12: 977�987.
Merchant, J. W. 1994. GIS‑based groundwater pollution hazard
assessment: a critical review of the DRASTIC model, Photogrammetric Engineering and Remote Sensing 60(9): 1117�1127.
Morrison, K. W. 2002. Customizable
Landscape Visualizations: Implementation, Application and Testing of a
Web-Based Tool, Computers, Environment, and Urban Systems 26(2/3):
163�183.
O'Neill,
R. V., C. T. Hunsaker, K. B. Jones, K. H. Riitters, J. D. Wickham, P. M.
Schwartz, I. A. Goodman, B. L. Jackson, and W. S. Baillargeon.
1997. Monitoring environmental quality at the landscape scale, BioScience 47(8): 513�519.
Poiani, K. A. and B. L. Bedford. 1995. GIS‑based nonpoint
source pollution modeling: Considerations for wetlands, Journal of Soil & Water Conservation 50(6): 613�619.
Rapaport,
R. A. 1988. Prediction of consumer product chemical concentrations as a
function of publicly owned treatment works, treatment type and riverine dilution, Environmental
Toxicology and Chemistry 7:
107�115.
Ross, M. A. and O. D. Tara. 1993. Integrated hydrologic modeling with geographic information
systems, Journal of Water Resources
Planning and Management 119(2):
129�140.
Shamsi,
U. M. 1996. Storm-water management implementation through modeling and GIS, Journal of Water Resources Planning and Management
122(2): 114�127.
Smith, M. B. and A. Vidmar.
1994. Data set derivation for GIS‑based urban hydrological Modeling, Photogrammetric Engineering and Remote Sensing 60(1): 67�76.
Sui, D. Z. and R. C. Maggio. 1999. Integrating GIS with hydrological modeling:
practices, problems, and prospects, Computers,
Environment and Urban Systems 23(1):
33�51.
USEPA. 1995. STORET/BIOS/ODES/WQAS Tool Inventory. Washington, DC: U.S. Environmental Protection Agency.
USEPA. 1997. 1996 Clean Water Needs Survey Report to
Congress: Assessment of Needs for Publicly Owned Wastewater Treatment
Facilities, Correction of Combined Sewer Overflows, and management of Storm
Water and Nonpoint Source Pollution in the United
States. Washington, DC: U.S. Environmental Protection Agency. EPA/832/R-97/003.
USEPA 1998. Safe Drinking Water
Information System (SDWIS). Washington, DC: U.S. Environmental Protection Agency. EPA/816/F-98-006.
USEPA 2001. Better Assessment Science Integrating
point and Nonpoint Sources. Washington, DC: U.S. Environmental Protection Agency. EPA-823-B-01-001, http://www.epa.gov/OST/BASINS/
Wang,
X., C. White-Hull, S. Dyer, and Y Yang. 2000. GIS-ROUT: a River Model for Watershed
Planning, Environment and Planning B:
Planning and Design 27: 231�246.
Warwick, J. J. and S. J. Haness. 1994. Efficacy of ARC/INFO GIS application
to hydrologic modeling, Journal of Water
Resources Planning and Management 120(3):
366�381.
Xinhao Wang, Ph.D. and Changming Du
School of Planning
University of Cincinnati
Cincinnati, OH 45221-0016
Phone: 513-556-0497
Fax: 513-556-1274
Email: xinhao.wang@uc.edu
Mike Homer, Scott D. Dyer, Ph.D.
and Charlotte White-Hull
The Procter &
Gamble Co.
Miami Valley Laboratories
P.O. Box 538707
Cincinnati, OH� 45253
T:�
513-627-1163
F:�
513-627-1208
Email:�
dyer.sd@pg.com