 †
†Figure 1-- Area of Study: Philadelphia County
The control of antisocial violence has been a significant issue in American politics and society since the inception of the United States.† However, only in the last three or four decades has the previously minority view, that antisocial violence can only be controlled through the total suppression of all violence, become the dominant paradigm of major governmental and educational organizations.† A concerted and growing effort has been made to alter the nature of American culture through teaching conflict resolution techniques as an alternative to physical confrontation, systematically punishing all physical aggression, removing access to weapons, and encouraging the media to reduce the amount of violence portrayed in their products.† The relative ineffectiveness of these measures has been explained by their incomplete application, which argues for a more aggressive and widespread program of implementation.†
However, cross cultural comparisons demonstrate that societies which systematically suppress all forms of violence, while their daily existence is generally more pacific than that of cultures that do not, are susceptible to periods of randomly focused and disproportionate violence when individuals, pushed by circumstances into physical aggression, find they have no cultural mechanism to distinguish between appropriate and inappropriate violent acts.† Thus, cultural disapprobation of all violence only alters the form of physical aggression in a community.† The policy implications of this model, should it be applicable to the American experience, are profound; restructuring American education to suppress violence as a legitimate social mechanism will serve to make violent outbursts more unpredictable and destructive even as it reduces their frequency.† The issue of violence will have to be addressed in terms of what kind of violence is preferable, rather than in terms of eliminating violence entirely.†
If this model is applicable to American culture, then certain patterns in the distribution of violent acts should be apparent.† Synchronically, communities with cultural attitudes toward violence significantly different from the American norm (for instance, groups like the Amish or the Quakers) should show a pattern and type of violence distinct from the surrounding community, with fewer and more brutal events.† Diachronically, American communities in general should show an increasing proportion of random and disproportionate violent acts (even though the total number of violent acts may decrease) as the effects of cultural conversion are felt.†
Realistically, discerning those patterns, if they exist, can be problematical.† Violence undoubtedly has a cultural source, but other factors, such as economics and psychology, have an equally decisive impact.† Even more disconcerting, the United States is in the process of cultural transition, potentially reflecting the effects of both systems.† Children are presented very different messages by parents who still value the tradition of aggressive self-defense, movies that alternately portray violent protagonists as heroes or as equivalent to the villains, and a school system that teaches absolute nonviolence.† The situations of many subgroups are even more confused.† The African American community, for instance, has a centuries-old American cultural tradition, rooted in slavery and operating into the 1950s, that suppressed any violent assertion of personal prerogatives, followed by a period in which confrontational defense of individual rights was encouraged and widely applauded, and then by yet another period in which African American violence is generally decried.† Sorting out the effects of such a diverse set of influences can present interesting challenges.
Since this analysis is designed to determine if patterns of violence are changing in the predicted pattern, the data most available and appropriate will focus on criminals and the crimes that they have committed.† It would be preferable if data were available from police reports, which would provide a factual account of what happened, without being complicated by interpretations of the judicial system, and include cases that were never brought to court.†
The type of data that is needed for this analysis is both quantifiable and non-quantifiable.† The data that is quantifiable is certainly easier to obtain because it s more likely to have been collected before.† It includes the date and place of the crime, the age of the person who committed the crime, where this person grew up, and any other socio-economic facts that may be pertinent in drawing conclusions later in the analysis.† Data will also be needed on the schools the criminals attended, particularly concerning when they implemented conflict resolution or otherwise changed the rules from those traditionally taught about violence.† Non-quantifiable data includes an evaluation of the motivation and character of each crime. Using a standardized set of criteria, a classification system has been developed to group similar crimes together. The first group is made up of random crimes, perpetrated against individuals who have no personal or social characteristics relevant to the purposes of the offender. The second group includes those crimes against a specifically targeted social group. Hate crimes and gang related violence fall in this category. The crimes in this category are more focused, because those not in the targeted group are not directly endangered, and the specific target is not identified by his or her individual personality. Though this class may have a value in the future, it is not the focus of the current study. The last group contains the crimes directed at a specific individual.
The data should be organized in such a way that each factor could be analyzed separately or with others as necessary.† The data should be collected for either several disjoint periods of time or a continuous length of time, so that the crime trends can be identified.† The data should be collected for a sample area, or several diverse sample areas, so that conclusions can be made both across time and across socio-economic background.†
Initial analysis will require the identification of distributional patterns of violence, both through space and time.† If these patterns show any indication of correlation between the diagnostic character of crime and significant cultural boundaries (geographic), or diagnostic character of crime and changing cultural attitudes (temporal), they will justify further, more detailed research.† One way to do this will be to use historical crime data to compare, for instance, 15 to 18 year old men in 1980 with the same age groups in 1990 and 2000.† Another will be to map the form and frequency of violence against a background of significant cultural boundaries
The area of study for this body of research is Philadelphia
County.† Philadelphia is located in the south-east portion of Pennsylvania (see
Figure 1).†
†
Figure 1-- Area of Study: Philadelphia County
It has a current estimated population of 1,491,812.† Philadelphians experienced
98,000 serious crimes and 319 murders in 2000.† The trends for serious crime
and murder between 1995 and 2000 can be seen in Figures 2 and 3, respectively.
Figure 2 Ė Evolution of major crime types in Philadelphia (Source: Uniform Crime Report)
The largest proportion of crimes a year reported to the Uniform Crime Report is theft.† Although the number of thefts fluctuated during these five years, the proportion of motor vehicle theft and the general category of theft to the total number of crimes each year is higher in 2000 compared to 1995.† Burglary and Robbery slightly decreased while rape increased.† One should note that an investigative series published in 1998 in The Philadelphia Inquirer revealed that as many as ten thousand serious crimes per year are being hidden by the Philadelphia Police Department.
Figure 3 Ė (Source: Uniform Crime Report)
Over the course of the past six years, crimes such as aggravated assault and theft have increased proportionally, while other crimes like robbery, auto theft and burglary have decreased.† This can be seen in Figure 3.† In order to help analyze the information that has been provided in figures 2 and 3, Figure 4 plots the total number of murders in Philadelphia from 1995 to 2000.† The number of crimes has been decreasing since 1995, and while it is likely that serious crimes are underreported in the city, it is unlikely that severe crimes such as murders are altered.
Figure 4 Ė Murders per 100,000 people in Philadelphia (Data: Uniform Crime Report)
Many problems arose in trying to find data that would most likely enable conclusions about the impact of culture, education and age on patterns of violence.† While there were sources of reliable information available, none included all of the quantifiable data that was needed.† The search for data started at Lexis-Nexis Academic Universe.† A search for murder turned up many names and case summaries, but lacked information on the educational history of the felons and any data that could be used to infer this history. By good fortune, we established contact with an individual who could provide us with access to the police records of Philadelphia County, producing much of the pertinent information (date of birth, sex, race, etc.) we needed for a substantial yet limited sample.
Unfortunately, this data source was also incomplete, failing to reveal the details and nature of the crime.† The solution was to cross reference the two databases.† This task seemed easy enough, but provided an essentially incomplete list, since the LN only contained records of criminals who had appeared in front of the Court of Appeals.† For example, 273 homicides occurred in Philadelphia for 1985 (see Figure 4), while information was available for only 9 (3.29%) of those incidents.† Similarly, the number of murders contained in the sample data for 1995 represent only 1.15% of the total homicides which occurred in that year, and 2.30% for 1996.† The above mentioned sample sizes are very small percentages and need to be expanded in order to draw accurate conclusions about the murder trends by year.† However, since our procedure depends only on separating the sample group into two subgroups, those who were taught alternate methods of conflict resolution and those who were taught the traditional methods, this sample may be sufficient to draw preliminary conclusions.† Many schools in the Philadelphia area had implemented conflict resolution programs by 1979.† Students who were exposed to this program before age twelve have the greatest chance of putting its lessons into practice.† Thus, December 31, 1966 could be reasonably established as a date of birth cut-off to separate the sample into the two subgroups.
Using Arcview 3.2, the two groups were plotted on the basis of different characteristics.
For instance, one map shows a comparison of the choice of victim for each group.†
Because of the large African American population of Philadelphia, and because
we can expect that community to have a different cultural tradition concerning
appropriate violence, maps were also created showing offendersí residences in
relation to the proportion of African Americans by census tract for the decade
in which the murder was committed.†
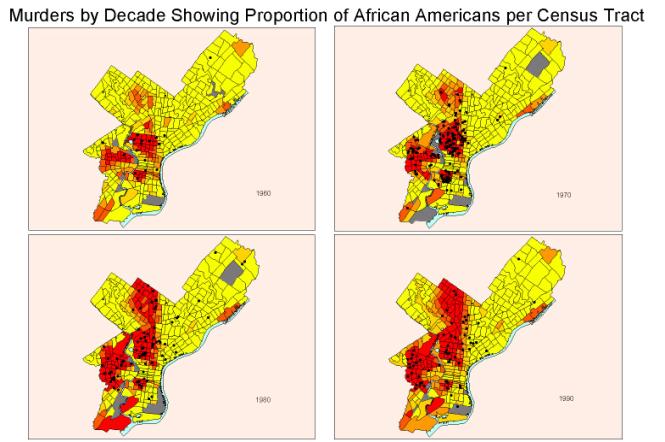
Figure 5 Ė Murderersí residence by decade from 1960 to 1990 showing the proportion of African Americans per census tract.
Beginning in 1960, the ethnic structure of Philadelphia has shifted.† As the white population moved into the suburbs, the low income African American community progressively replaced them, becoming an increasingly dominant proportion of the population, concentrating in the north central and western sections of the city.† The largest concentrations of murderers were found to be living in areas that were predominately African American.† If it can be demonstrated that this predominance of murder in the black community is associated with motivations that routinely result in less serious violent assaults in the non-black community, it may be reasonable to hypothesize that the cause may be found in the distinct cultural heritage of African Americans which, well into the 1950s, taught the general inappropriateness of any violent defense of personal prerogative.
Figure 6 -- Geographic distribution of the residences of murderers during four time periods extending from 1960 to 1997.
Our initial attempts to determine the patterning of random and disproportionate violence have not been particularly illuminating, neither confirming nor contradicting our hypothesis.† The process of sorting the data available to determine the patterning of violence has been made difficult by the incompletion of the materials and the inconsistency that exists between our purposes and the intention of the collecting agencies.† Consequently, our most promising approach seems to be to play with the material, constructing maps that show a variety of combinations of data, and looking for interesting or evocative spatial distributions that prompt the gathering of more information or the reinterpretation of that already acquired.† The increasing frequency with which robberies in Philadelphia have resulted in murder is one such evocative circumstance.† In the 1960s, only eleven percent of murders occurred during robberies, while in the most recent decade reported, the percentage had grown to thirty-two.† It is possible that this dramatic increase results from a growing inability of robbers to discriminate between levels of violence appropriate to their intentions and levels of violence that are disproportionate.† Perhaps the folk wisdom of older citizens who remember that ďnobody killed you for your sneakers when I was youngĒ reflects a disturbing cultural reality.† A larger sample and a more comprehensive body of social data will, we hope, allow a more definitive answer in the future.
Figure 7- Distribution of crimes by time period from 1960 to 1997
Figure 8- Locations of murders that occurred during robberies from 1960 to 1997.
 †
†