Esri TOOLS TO WIRELESS MARKET ANALYSIS ASSESMENT [1318]
Marcos Leandro Kazmierczak (Geomarketing
Business Development, IMAGEM – mleandro@img.com.br)
Adriano Martins Junqueira (Geomarketing Business Development, IMAGEM –
ajunqueira@img.com.br)
Luciana Marquez (Research and Market Intelligence Manager, TIM BRASIL
– lucianam@timbrasil.com.br)
ABSTRACT
Resolving many of the challenges of a telecommunications business requires a solid understanding of where your infrastructure and clients are today and they will be tomorrow. In such a dynamic sector, the capacity to access and manipulate data in an efficient manner becomes a strategic necessity. This brief presents a methodology adopted for the identification of potential market areas for cellular telephone services for TIM BRASIL. The results presented here are fictitious, illustrating the employed method and the potential of Esri Tools for the generation of models for estimating cellular telephone market potential and for the dissemination on the Internet of TIM.
1. CONTEXT
Italy Mobile Telecom – TIM is the European leader in mobile telephones
using the GSM system (Global System for Mobile Communications), has a
presence in 12 countries globally, with more the 50 million clients. TIM
has been in
In 2002, the business will begin offering services with this new technology in the states of Sao Paulo, Rio de Janeiro, Espirito Santo, Rio Grande do Sul and in the Mid-West and Northern Regions. As such, it will be necessary during the end of 2001 and the beginning of 2002 to define and initiate all of the necessary structures for the launching of operations in these regions.
2. OBJECTIVES
The general objective of this project is the full exploration of the necessities of TIM BRAZIL relative to the mapping of the Brazilian cellular telephone market in the “D” and “E” bands, identifying the areas of greatest market potential through the generation of a socio-economically georeferenced databank for business planning use. The specific objectives of the project are as follows:
· To map the Brazilian market for the support of TIM in elaborating an entrance strategy in the areas for which they have acquired licenses for the “D” and “E” Band usage; and
· Creation, with a nation-wide scope, of a geographic and market database which supports analysis and decision-making for the prospecting processes, coverage planning, and allocation of resources in the sales area.
With this database as a foundation, spatial analyses will be created, capable of [1] providing assistance in identifying the best options for actions and investments in the target municipalities, [2] defining the priority areas in each of the selected municipalities, and [3] promoting the optimization of planning (engineering, marketing and sales), with a view to promoting the improvement of results in each area, increasing competitiveness in relation to existing operators and decreasing costs. Beyond this, there will be included [1] the provision of software licenses for the editing and visualization of data, as well as training and consulting in their manipulation, and [2] the development of an application geographic referencing through the web.
3. SCOPE OF PROJECT
The Project will consider two distinct scopes, which are:
· Scope 1: all of the Brazilian municipalities; and
· Scope 2: 71 municipalities selected by TIM, for greater detail of the market information for the surveyed sectors.
4. PROJECT PURPOSES
The solution we have developed is distinct in the following ways: [1] in the elaboration of a consistent and updated cartographic base which permits the consolidation of mapping and the georeferencing of information of interest to Engineering, Marketing, and Sales departments of TIM, and [2] in serving as a reference for the insertion of whatever additional information may be obtained by the business in the short, medium or long term. Beyond this, please consider the following:
Agility of Implementation: expertise of a team of more than 250 technicians, with 15 years of experience in Geotechnologies and who are leaders in the Latin-American market for the implementation of solutions such as the one proposed;
Security of WEB Interface: team of highly-qualified analysts for the development of a geographic consultation application for the use of all of TIM in Brazil and the customization of routines for the most frequent operations, utilizing a robust technology for the support of the geographic intelligence required by the scope of the project and with access restrictions by user type;
Ease of use: the solutions for database manipulation and access through the WEB are based in market-leading technology, with friendly interfaces that are quickly and easily learned;
Flexibility and speed in altering/including information: treated as an open system, any information in “dbf” format can be associated with a database, permitting rapid alteration, inclusion, or exclusion;
Team dedicated to TIM: team of GIS specialists dedicated to the project;
Information secrecy: secrecy guarantees for the information involved in the database and the resulting data;
Availability of information in updatable map, table, and graphics formats: all of the information within the database can be presented in a graphics or table format, permitting the creation of updatable maps, reports, and graphics for manipulation; and
Possibility to compare TIM internal information with information in the database: acting as an open system, it is possible to establish links between the databases generated by the project and current TIM information (or information that will be generated by TIM).
5. CHARACTERISTICS OF PRODUCTS SUPPLIED
The final products to be available to TIM are as follows:
Product 1 – Database for Researching Market Potential: creation of a ranking of the Municipalities (Scope 1) and of the Surveyed Sectors (Scope 2) with the aim of determining market potential;
Product 2 – Market Analysis Database: each Municipality (Scope 1) or Surveyed Sector (Scope2) generates a value characterized as an Attractiveness Index which will allow the creation of a hierarchy between the Brazilian municipalities (macro level) and within each of the selected municipalities (micro level), with a view to supporting future TIM analyses;
Product 3 – Database for the Optimization and Positioning of ERB’s: the cross-reference of coverage maps provided by TIM with the data provided by Products 1 and 2;
Product 4 – Geographic Information System: Use licenses for Arc View 8.1 software will be provided for the visualization, manipulation, and updating of databases. This program was selected with a full consideration of the Geomarketing needs of TIM;
Product 5 – Geographic Information System Use Training: training for 30 technicians in the use of Arc View 8.1;
Product 6 – Consulting: consulting time with a Senior GIS Specialist, with an emphasis on Geomarketing;
Product 7 – Browser for Consulting and Visualizing WEB Information: for better use and access to information generated by diverse databases, and others that will be generated by TIM’s own Competitive Intelligence Sector. This includes a license for ARC IMS for installation in TIM’s Server; and
Product 8 – Training in the Use of application for geographic consultation on the WEB: training for up to 30 technicians in the use of application developed within the scope of this project.
6. RESULTS
All of the processes were done using Arc View 8.1 geographic tools.
6.1. SCOPE 1 RESULTS
For Scope 1, which covers all of the Brazilian municipalities, a geographic segmentation model was developed which worked with 45 physical, demographic and economic variables. Beginning with the analysis of the Principal Components (Figure 1), in which the analysis combined 45 variables joined 3 to 3, variables were defined for the grouping of each of the municipalities following the criteria of similarity of economic development, thus generating clusters. Municipalities with the same degree of economic development belong to the same cluster.
 |
Figure 1. Clusters Resulting from the functions of variables 1,2, and 3.
In the following phase, indices were generated by determining factors thus permitting the classification of each municipality following each of the established indices. Finally, an algorithm determined Attractiveness Index was developed to define the ranking of the most attractive municipalities by the following five classes of attractiveness: very high, high, medium, low, and very low.
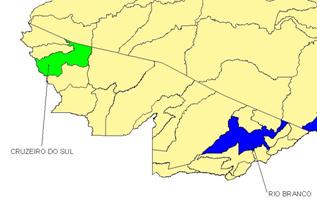
With this model as a foundation, a database is available to TIM that permits them to select the most attractive municipalities in each Brazilian state, providing a first approximation for future detailed studies. Figure 2 presents the results of a study of the state of Acre.
 |
|
Figure
2.
Results for Acre State. |
The municipality of Rio Branco was identified as an area of high attractiveness, while Cruzeiro do Sul was classified as having medium attractiveness. Most municipalities were classified as very low attractiveness areas. The models are open and allow for the inclusion and exclusion of variables, as well as the modification of weighting of each index.
6.2. SCOPE 2 RESULTS
An Index of Intra-Municipal Attractiveness was developed for the 71 municipalities selected by TIM that will identify the most attractive areas within each municipality. To illustrate this Case, fictional data were generated for a chosen municipality. Figure 3 shows the districts layer, with the spatial distribution of each district within the pilot area.
 |
 |
|
Figure
3. Districts.
|
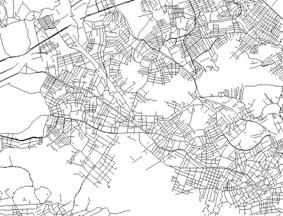
Figure 4. Intelligent Street
Layout.
|
The process begins by generating an intelligent street layout (Figure 4) containing the axes of the public areas with their respective attributes (type, title, name, initial and final number, ZIP Code). The layer forms the foundation for the geocodification of all the points of Businesses/POF’s (Points Of Sales) and for the association and weighting of the models.
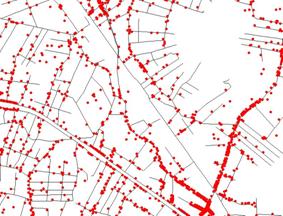
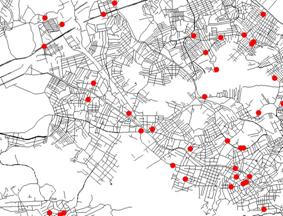
A database containing information about the businesses (registered name, address, sphere of attractiveness and employee roster) was processed, with the aim of making an account of the addresses and establishing the conditions for their geocodification. Figure 5 shows the resulting spatial distribution, where each red point represents from 1 to “n” businesses (more than one business in the same address).
This database makes it possible to consult about the market potential of each region (by district, surveyed sector, etc.), as well as about the number of businesses in a determined sphere of attractiveness. Figure 6 illustrates the spatial distribution of service-providing businesses in the area of telecommunications.
 |
 |
|
Figure 5. Businesses.
|
Figure 6. Service-Providing businesses in the area of telecommunications. |
Another analysis generated a layer of Points of Sales Competition. With data obtained through field research, the addresses of each sales store was calculated and was placed in the database of the intelligent street layout (Figure 7). A judicious analysis with this product helped to define the choices for points of sale for TIM. To define the areas of interest as to potential consumers, a work unit was defined as being that of the surveyed sector of IBGE - Brazilian Institute for Geography and Statistics - (Figure 8), utilized by the population Census.
Each sector covers approximately 300 domiciles, and each sector is arranged into 1,223 socio-economic attributes. For each city that was analyzed, it is possible to develop a thematic map of the selected attributes. For example, a map could be created for the distribution of the number of domiciles, by rent level, by level of education, etc.
 |
 |
|
Figure
7.
Competitor’s Points of Sales. |
Figure 8.
Surveyed Sectors. |
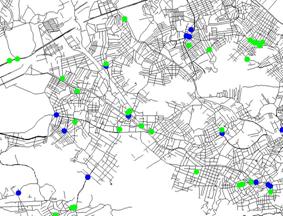
Using primary research conducted by TIM BRASIL, a profile was created to cellular telephone service usage. Some questions were selected which had proven statistically reliable for their use in developing a model to associate with the profile of users and non-users of cellular phones.
In this way it was possible to estimate the number of residents in each surveyed sector following two criteria: churn potential, defined as the potential of persons that are currently using cellular phones to change their provider, and incorporation potential, which refers to those people who are not already using cellular phones but who intend to purchase a handset within the next 6 months and who have the financial resources to do so.
The sum of these potentials generated a map of the potential consumer market, shown in Figure 9. Figures 9 through 12 adopt the convention that the darker the shade of gray, the greater the potential.
 |
 |
|
Figure
9.
Potential Consumer Market. |
Figure 10.
Potential Corporate Market. |
To estimate the potential corporate market, a specific methodology was created to associate a weight to each business. This weight considered the sphere of attractiveness, degree of telecommunications service use and load (number of functionaries). This data was associated to each section of ZIP Code, permitting in this way the identification of those section fields which presented the greatest importance in corporate terms. The results can be seen in Figure 10.
To find the market potential in the places where people live and work, the criteria of mobility was utilized. That is, the locations which constitute the arteries of movement (flux) and the locations of greatest concentration of population. Notable points which best represented each city were identified and using the foundation of chosen criteria notations for each of the identified points were attributed.
The points were placed within a hierarchy in accordance with their degree of importance and analysis. Once the results have been ratified, the database can be spatialized using the same work units for the consumer and corporate potentials, seen in Figure 11.
 |
 |
|
Figure
11. Potential Mobile Market.
|
Figure
12. Map of Market Demand.
|
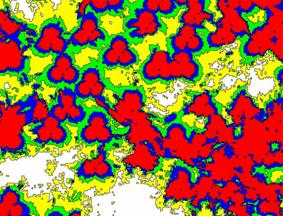
Like the previous processes, three maps (consumer, corporate and mobility) were joined, in accordance with previously established weights and with flexibility of modifications. In this way, a map of general market attractiveness can be generated which combines the characteristics of each of the three individual maps, as shown in Figure 12.
Once the four market potential maps have been generated, they can be compared with the coverage map (Figure 13) generated by the radio frequency planning sector of the operators. This map, which shows the geographic limits of each signal level, can be processed, so that it can be verified if the areas that show the most attractiveness are covered and with what level of efficiency. In this way, it was possible to verify the necessity of optimizing the infrastructure of TIM, permitting a better coverage and better service to the users.
 |
|
Figure
13.
Simulation of Coverage Map. |
7. GEOGRAPHIC CONSULTATION APPLICATION
With the goal of permitting the access of information generated by the project to be disseminated to the analysts in the area of market intelligence and business sales, an application for consultation through the web has been developed (Figure 14).
To access the data generated by the project, it will be sufficient to log into the system and, depending on the browser (Netscape, Explorer,) and on the installed application, to accomplish consultations, classifications by theme, and generation of figures and tables for analysis, from any point in the world. Utilizing Arc IMS in the data server, the time between sending a request for user consultation, database server processing, and the receipt of screen response is approximately 5 seconds.
 |
|
Figure
14.
Application Screen. |
8.
RESULTING BENEFITS
The Geomarketing solution permits TIM to have relevant information about their principal market potentials in a short space of time, with the following possibilities for use:
·
Support for the study of market potential
demands;
·
Prioritization of coverage conforming
to the localization of market potential to be focused on;
·
Knowledge of the particulars of the regional
markets including the identification of notable points in each city;
·
Distribution and allocation of the corporate
sales force divisions;
·
Support for distribution of sales budget
for the regions and points of sales;
·
Definition and geographic localization
of the points of sales and delimitation of the sales regions;
·
Understanding of the sales strategies
and of competitor distribution;
·
Delimitation of areas of greatest market
potential;
·
Reduction and optimization of costs of
a project having nation-wide goals;
·
Interface for the exchange of georeferenced
information with the Engineering Department; and
·
Possibility to have information and uniform
graphic analyses available to all the company through Web consulting tools.
With the continuation of the project, the following future benefits would be achieved:
·
Support of communication strategies, permitting
optimizing of outdoor locations as well as the definition of targets for
the field divisions;
·
Reduction and optimization of resources
to be utilized in direct marketing through the geographic selection of
targets through the fields;
·
Optimizing and accompaniment for the allocation of leads
for each salesman;
·
Accompaniment of performance indicators
for the sales force; and
·
Cross-referencing of DBM/DW in Geomarketing.
9. FINAL CONSIDERATIONS
The database generated has an approximate size of 20 gigabytes. The models presented are consistent with reality, for Scope 1 and for Scope 2. In the case of Scope 1, the resulting data for the states of Parana and Santa Catarina were compared with data for TIM Cellular Sud, which has already been operating in these states for three years, validating the model.
TIM may rest comfortably in regard to the results obtained and in gathering its’ forces behind the refinement of the requested geotechnologies to meet the demands of Competitive Intelligence, solidifying themselves as a business which has, since its’ inception, the vision of the potential of integration of its’ diverse sectors through GIS technology.
Arc View 8.1 is already in full use in TIM’s diverse competitive intelligence units, responding to needs and demonstrating the great advantages of it’s cost/benefit relation. Arc IMS has proven to be stable, even at peak moments when traffic volume is three times greater than normal.
New work fronts and new demands have been identified, including the usage of geographic intelligence solutions for the Call Center System and the conversion of radio frequency planning data for the dynamic realization of necessary data for the analysts of Geomarketing and Customer Care.
This paper was selected to receive the 5th Annual Special Achievement in GIS – SAG, at the Twenty-Second Annual Esri International User Conference, in San Diego (July 11th). This award is an opportunity to recognize an innovative or exceptional achievement with GIS technologies. The nominee is TIM BRASIL – INTELIGĘNCIA DE MERCADO. The authors would like to thank Esri for this recognition.
| Authors | ||
| Marcos
Leandro Kazmierczak Business Development Rua Itororo, 555 – Vila Bandeirantes São Jose dos Campos – São Paulo 12216-440 – Brazil (55)12-3946-8973 mleandro@img.com.br |
Adriano
Martins Junqueira IMAGEM Business Development Rua Itororo, 555 – Vila Bandeirantes São Jose dos Campos – São Paulo 12216-440 – Brazil (55) 12-3958-8910 ajunqueira@img.com.br |
Luciana
Marquez TIM Research and Intelligence Market Manager Av Republica do Chile, 500 – 23 Floor Rio de Janeiro – Rio de Janeiro 20031-170 – Brazil (55) 21-3983-4278 lucianam@timbrasil.com.br |