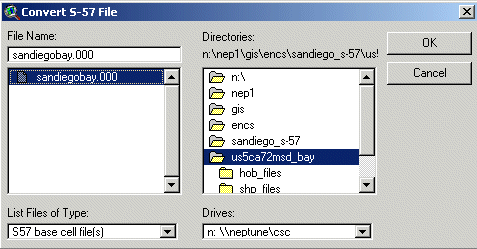
Figure 1. Convert ENC dialog box.
David Stein and Scott Rutzmoser, Technology Planning and Management Corporation Contractors, NOAA Coastal Services Center
IntroductionThe NOAA Coastal Services Center (Center), in partnership with the NOAA Office of Coast Survey, has developed an ArcView® extension called the NOAA ENC Data Handler that allows the Office of Coast Survey’s Electronic Navigational Chart (ENC) suite to be used in the Esri® ArcView 3.2x software environment. The ENC is a vector database of chart features built to the International Hydrographic Organization’s Transfer Standard for Digital Hydrographic Data (S-57). The complexities of ENC files are evident by the fact that there are approximately 180 possible data layers associated with a single ENC. As a result of this complexity, the Center developed an extension that converts, describes, and displays ENC data so that they become useful in a geographic information system (GIS). The extension uses a software utility developed by Esri to convert the ENC objects to shapefiles. The Center developed additional functionality that prompts users to choose the data they wish to display for a particular ENC.
Automated functions include creating views, adding groups of shapefiles, toggling themes, applying symbols, and arranging themes in the table of contents. All of these functions are accessible through an easy-to-use graphical user interface. This paper will describe the development and utility of the NOAA ENC Data Handler.
NOAA Electronic Navigational ChartsA NOAA electronic navigational chart, or NOAA ENC, is a database of chart features. The structure and format of a NOAA ENC is defined by the International Hydrographic Organization S-57 standard. The NOAA ENC is in a nonproprietary, publicly available format. It contains information about the location of each chart feature, as well as attribution information such as color, shape, depth, and so forth. This information is used by navigation system software to draw a display that resembles a nautical chart, but which has greatly enhanced functionality. Key definitions describing the various components of ENCs can be found in appendix A.
A raster chart, by contrast, is a facsimile of a paper chart, or a picture of a chart displayed on a computer screen. It is a file of information that can be thought of as dots, or pixels, on the computer screen. The raster file stores the color of each pixel and the computer reads these colors but cannot distinguish a black pixel that is part of a sounding from a black pixel that is part of a dangerous wreck symbol.
Conversely, the NOAA ENC, as described above, stores the actual feature including its latitude and longitude, as well as descriptive information. A navigation system using a NOAA ENC would "know" that the dangerous wreck in the above example is a dangerous wreck, as well as how much water is over the wreck. A navigation system using an NOAA ENC can use this information to check planned routes, sound alarms if a vessel’s projected course will move it close to dangerous features, and inform the mariner about various warnings and regulations that relate to areas that the vessel is transiting. Further, the mariner can control the display of NOAA ENC data and remove features from the display that are not important to the safety of the vessel to unclutter the screen. This allows the important features to be more easily viewed.
Because the ENC data are stored in a vector format, they lend themselves for use in a GIS environment. There is a wealth of valuable data in an ENC that can be used for research and resource management. Potential applications of ENC data in a GIS include coastal mapping, environmental assessment, and fisheries management.
NOAA Electronic Navigational Chart Data HandlerDevelopment of the NOAA ENC Data Handler began in early 2001. The first step was to obtain the S57toArc.dll, packaged with ArcView 3.2, to perform the initial conversion from S-57 objects to shapefiles. Because of the potential for as many as 180 shapefiles per ENC, the project team made a decision to develop symbology at the feature level. A series of ArcView legends were created using symbols from S-52, Specifications for Chart Content and Display Aspects of ECDIS, the National Imagery and Mapping Agency’s (NIMA) Geosym Library, and other intuitive symbols. Once symbols were created, a lookup table was developed to facilitate the conversion of S-57 acronyms to descriptive naming conventions. Listed below are descriptions of the major functions and the graphical user interface of the extension.
Graphical User Interface and FunctionalitySix major functions were incorporated into the graphical user interface (GUI). They include converting ENC data, creating views, adding existing ENC data to a view, toggling themes, removing themes, and the addition of a help dialog.
Figure 1. Convert ENC dialog box.
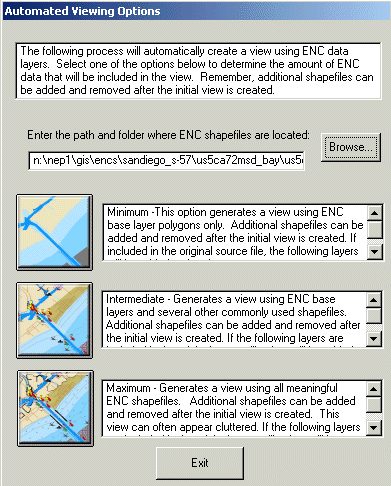
Figure 2. Automated viewing options dialog box.
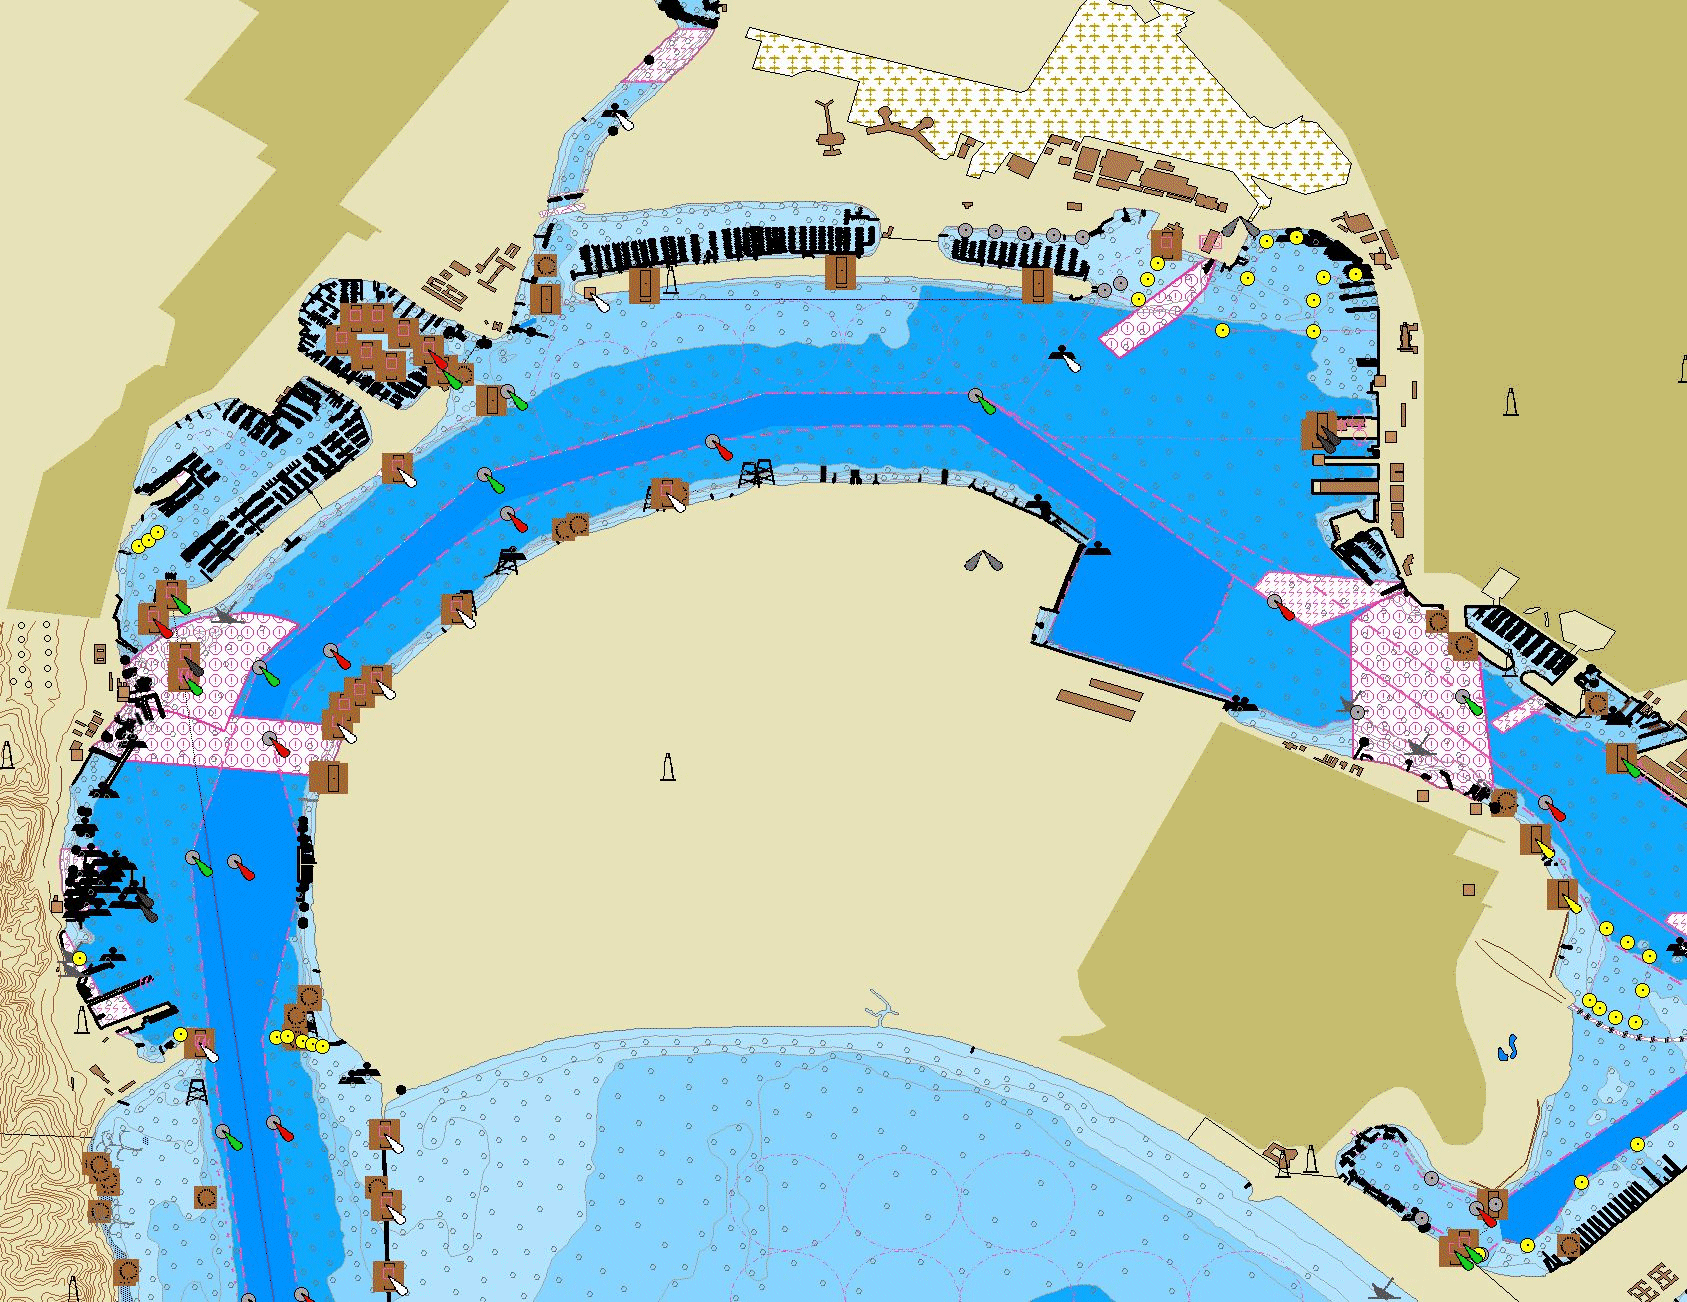
Figure 3. Maximum viewing option for San Diego Bay.
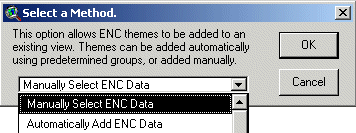
Figure 4. Adding existing data to a view.
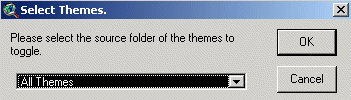
Figure 5. Toggle dialog box.
The ENC data available from the NOAA Office of Coast Survey are developed first and foremost for navigation. The Office of Coast Survey is currently focusing on the major ports at the largest available scale. This subdivision of data could provide a challenge for GIS users because many charts may have to be downloaded for a particular area. Although the charts are seamless, the scales at which the charts were digitized may vary. For example, the New York Harbor paper chart (chart 12327) is comprised of several different ENCs of varying scales. As long as ENC data users understand this caveat, and that merging data across charts, in some cases, may result in a data set of varying scale and accuracy, this should not present a problem.
Future PlansVersion 1.0 of the ENC Data Handler is scheduled for release in late Summer 2002. Future versions of the extension will depend on how Environmental Systems Research Institute (Esri) plans to handle ENC data in ArcGIS 8.x.
S-57 – International Hydrographic Organization (IHO) Transfer Standard for Digital Hydrographic Data. S-57 specifies the model, structure, rules, and format for ENC data development and exchange.
ENC – Electronic Navigational Chart. A vector-based digital file containing hydrographic features suitable for marine navigation. It is based on the International Hydrographic Organization (IHO) S-57 standard.
Cell – The area covered by a NOAA ENC is referred to as a "cell." At present, each NOAA ENC corresponds to the largest scale paper chart in a given area.
Object – An identifiable set of information (e.g. channels, aids to navigation, shoreline) within an ENC as defined by S-57. The NOAA ENC Data Handler converts each chart “object” to a shapefile.
Appendix B. List of Shapefiles Categorized into Automated Viewing Options
| Minimum Viewing Option:
Unsurveyed area Pontoon polygon Hulk polygon Floating dock polygon Dredged area Depth area polygon Land area polygon Intermediate Viewing Option:All "Minimum" layers Administration area Airport airfield points Airport airfield polygon Anchor berth points Anchor berth polygon Anchorage area points Anchorage area polygon Beacon cardinal Beacon isolated danger Beacon lateral Beacon safe water Beacon special purpose Berth lines Berth points Berth polygon Bridge lines Bridge polygon Built up area polygon Buoy cardinal Buoy installation Buoy isolated danger Buoy lateral Buoy safe water Buoy special purpose Canal lines Causeway lines Caution area points Coastguard station Daymark Depth contour Distance mark Dock area Dumping ground points Dumping ground Exclusive Economic Fairway Ferry route lines Fishery zone Fishing facility lines Fishing facility points Fishing facility polygon Fishing ground Floating dock lines Fog signal Harbour facility points Harbour facility polygon Hulk points Ice area Incineration area points Incineration area Lake Landmark points Light Light float |
Light vessel
Marine farm culture Marine farm culture Marine farm culture polygon Mooring warping Mooring warping Mooring Warping Obstruction lines Obstruction points Obstruction polygon Offshore platform Precautionary area Radar reflector Radio calling in point Railway Rapids lines Rapids polygon Rescue station Retro reflector River lines River polygon Road lines Runway lines Runway points Runway polygon Sea plane landing area points Sea plane landing area polygon Silo tank polygon Small craft facility Small craft facility Underwater awash Vegetation lines Vegetation points Vegetation polygon Waterfall lines Waterfall points Weed kelp points Weed kelp polygon Wreck points Wreck polygon Maximum (all data): All "Intermediate" layers (listed above) Bridge points Building single points Building single polygon Built up area points Cable area Cable overhead Cable submarine Canal bank Canal polygon Cargo transhipment Cargo transhipment Causeway polygon Caution area polygon Checkpoint points Checkpoint polygon Coastline Contiguous zone |
Continental shelf area Control point Conveyor lines Conveyor polygon Crane points Crane polygon Current non Custom zone Dam lines Dam points Dam polygon Deep water route centerline Deep water route part Depth area lines Depth soundings Dry dock Dyke lines Dyke polygon Fence wall Ferry route polygon Fortified structure lines Fortified structure Fortified structure Free port area Gate lines Gate points Gate polygon Gridiron points Gridiron polygon Harbour area Inshore traffic zone Lake shore Land area lines Land area points Land elevation lines Land elevation points Land region points Land region polygon Landmark lines Landmark polygon Lock basin Log pond points Log pond polygon Military practice area points Military practice area polygon Navigation line Offshore platform Offshore production Oil barrier Pile Pilot boarding place Pilot boarding place polygon Pipeline area points Pipeline area polygon Pipeline overhead Pipeline submarine on Pipeline submarine on Pontoon lines Precautionary area polygon Production storage area points |
Production storage area polygon
Pylon bridge support points Pylon bridge support polygon Radar line Radar range Radar station Radar transponder beacon Radio calling in point points Radio station Rapids points Recommended route centerline Recommended track lines Recommended track polygon Recommended traffic lane points Recommended traffic lane polygon Restricted area River bank Road points Road polygon Sand waves lines Sand waves points Sand waves polygon Seabed area lines Shoreline construction lines Shoreline construction points Shoreline construction polygon Signal station traffic Signal station warning Silo tank points Slope topline Sloping ground points Sloping ground polygon Sounding Spring Square Straight territorial sea baseline Submarine transit lane Swept Area Territorial sea area Tideway points Tideway polygon Topmark Traffic separation line Traffic separation scheme boundary Traffic separation scheme crossing Traffic separation scheme lane Traffic separation scheme roundabout Traffic separation zone Tunnel lines Tunnel points Two way route part polygon Water turbulence lines Water turbulence points Water turbulence polygon |
References
NOAA Office of Coast Survey World Wide Web site. < http://chartmaker.ncd.noaa.gov>