Gary S. Smith
Orthophotography first came into use in the 1960's. It was expensive and time consuming to produce. By the early 1970's, technological improvements brought this data source into affordable commercial applications and its use has continued to expand. The first orthophotography was produced by computer driven optical methods and equipment. Today, these pieces of equipment have been replaced by the computer workstation and sophisticated computer software algorithms. The product of this technology is a digital image that can stand alone on its own visual merits or be integrated and employed within a geographic information system. Assessing the spatial accuracy and quality of the final product should be of significant interest to the GIS manager who will use this imagery in daily operations. Experiences and examples related in this paper are taken from the State of Vermont's Orthophoto Mapping Program. This program acquired its first imagery in 1974 and provides printed copies to communities for parcel mapping purposes. Vermont was the first State in the Nation to complete statewide orthophoto coverage. Until this past year, all imagery was produced by optical methods and distributed in print format. Transition has now been made to digital production and the associated benefits and adjustments are just beginning to be realized. This paper will concentrate on the issues and opportunities presented to the GIS community by this exciting data source.
Orthophoto imagery was first produced over 30 years ago. It offers the advantages of a conventional map product, but unlike the traditional map, the orthophoto is able to display actual ground features, not cartographic representations of those features. Up until 5 or 6 years ago, the orthophoto was created using a combination of optical and digital processing. The digital orthophotograph has became a commercial production reality due the primarily to the increased availability of more powerful computers at more affordable prices. Regardless of the method of construction, four basic operations or corrections must be applied to the standard vertical aerial photograph to produce the orthophoto. The first correction is the standardization of scale across the image. The second correction involves removing the relief displacement to position the terrain in its true location. The third operation entails the assignment of X & Y coordinate values to the image. The final task involves the radiometric or tonal adjustments to allow the image to blend with neighboring images. The key to understanding the orthophoto is first understanding the geometric properties of conventional vertical aerial photography, since this is the source of all orthophoto imagery.
Traditional aerial mapping photography is acquire in a vertical format using very specialized cameras and lenses. Mounted in gyro stabilized mounts, these cameras are pointed straight down at the surface of the earth and record their images in flight lines. Within the flight line, each successive photo overlaps the previous image frame by between 60% and 80%. The overlap area between the two successive frames allows for stereo (3-D) viewing of the area in common and the subsequent collection of the digital elevation model (DEM). Where more than one flight line is required to cover the geographic area of interest, additional flight lines are flown with between 20% and 30% duplication (sidelap) between flight lines. This overlapping between flight lines does not allow stereo viewing between flight lines or DEM collection. Its sole purpose is to assure that there are no gaps, often called "data holidays" in the target area.
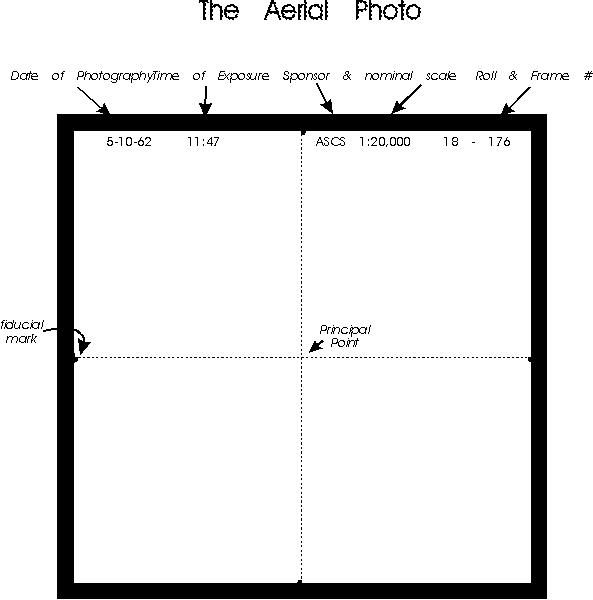
Each individual aerial photo is 9 inches square. On the sides of each frame (and on some cameras in the corners) are calibration points called fiducial marks. By drawing lines between opposing fiducial marks the intersection of two lines will define the center of the photograph. This point is called the principal point. If the photograph is a true vertical photo, this point also represents the point on the ground directly beneath the camera at the time of exposure. This point is called the nadir. Figure 1. illustrates the location of the fiducial marks, principal point and nadir for a true vertical image.
Scale of this imagery will vary across the photo in proportion to the height of the camera above the ground. Using the center of the photo as a base reference point, terrain that is at a lower elevation (further from the camera) will be represented at a smaller scale and terrain at a higher elevation will be imaged at a larger scale. A review of Figure 2. illustrates this fact and illustrates the simple geometry and similar triangles used to make this calculation. In the construction of the orthophoto all fluctuations in scale are removed and the image is presented constant scale.
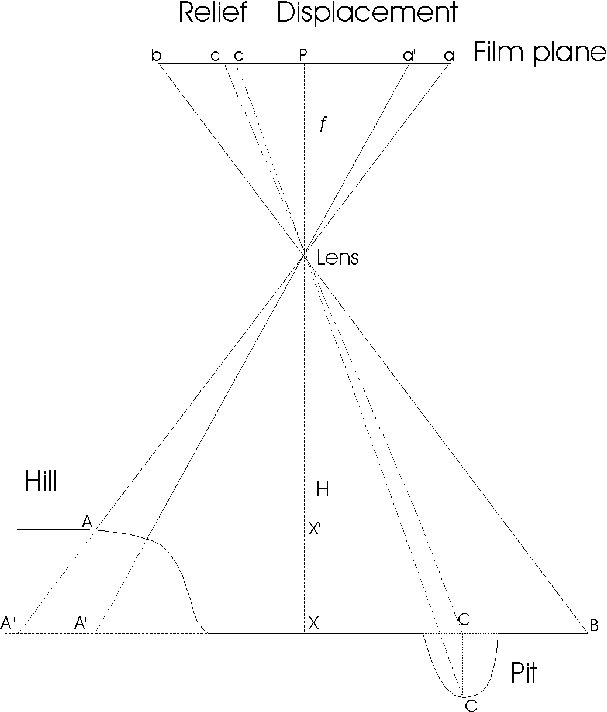
Relief displacement is a distortion that affects the spatial accuracy of the image. Simply stated, points that are higher than the nadir are displaced outward from the center of the photograph and points that are lower in elevation are displace inward from their true position. Referring again to Figure 2. the geometric displacement of both a hill and a pit in relation to the nadir are illustrated. The radial nature of this displacement is shown in Figure 1. where the flagpole is displaced outward from the nadir. In this latter example, the top of the flagpole is at a higher elevation than the elevation at the nadir. Relief displacement of the terrain is removed during the orthophoto development, thus the hills, and valleys will appear in their true location. Relief displacement of flagpoles, buildings, trees and other similar features will remain on the image since the top and bottom of the objects occupy the same X & Y coordinate on the ground. This artifact of relief displacement can cause some image distortions or illusions, particularly along the joint between orthophoto sheets. While sometimes disturbing, most are not defects in the image product.
Creation of digital orthophotography starts with careful planning and ultimately concludes with the final image product. The scale of the output product will determine the scale at which the original aerial photography will be acquired. For the Vermont data, the final product scale is defined as 1:5,000. For this scale product, the original photography is acquired at a nominal scale of 1:30,000. In preparation for an aerial flight, ground control points must be identified or established and monument so that they can be seen and recorded on the film. X, Y & Z values for these points are known. These points form the basis for control and coordinate assignment through a process of aerotriangulation. Several commercial firms are now enhancing the ground control through the use of airborne GPS and supporting ground station data collection. This new addition to the control process shows great promise. This control process provides the groundwork for completion of one of the 4 steps/corrections defined earlier.
Once the photography has been acquired and the necessary triangulation calculations have been completed, the photography is ready for the digital elevation model collection. This digital elevation model will form the basis for the correction of scale differences across the aerial imagery due to elevation changes. It will also be used to remove the relief displacement in the terrain. The elevation data is collected using an analytical stereo plotter to view the photography in 3-D and collect a representative sample of elevation points that will describe the relief of the area. The amount and type of information collected in the DEM will vary. This issue should be of considerable interest to the GIS manager and is discussed later in this paper.
With the DEM collection complete, the photography is ready to be scanned and converted into a digital image. In the ideal situation, one aerial photograph will be used to create an entire orthophoto. The area should come from the central portion of the original photography to minimize any lens distortion near the edges of the photo. Photographs are scanned at a very high resolution to assure a high image quality in the final product. It is during the scanning process that defects of dirt and lint pieces can be added to the digital orthophoto image detracting from the quality of the final product. In addition, any scratches in the original photography that would normally be minimized during optical enlargements, will be clearly be captured and preserved in the scanning process making them clearly visible in the final product.
The actual orthophoto creation is a computer based process that marry's the rasterized aerial photograph with the DEM. This process allows for the software to reposition the pixels of the scanned aerial photo to remove the effects of relief displacement and terrain elevation differences. With pixels properly positioned and associated X & Y coordinate values assigned the orthophoto is ready for viewing. The resulting image is now at constant scale across the entire image. Only correction for tonal differences between images remain to complete the process.
Radiometric corrections may be necessary to smooth tone or color differences between orthoimages to improve the overall image quality. Pixel brightness values range between 0 and 255 and in some cases a localize adjustments may be required. If the photography is flown just prior to leaves returning to the trees, matching images between flight lines, recorded on different dates may be challenging. Differences in the time of day the photography is acquired can also hinder the radiometric balancing between digital images.
The recipient of new digital orthophoto imagery should plan to conduct a thorough review of the delivered product. Quality issues fall into two broad categories. The first is spatial accuracy and the second is image quality. Spatial accuracy refers to the location of the pixel elements in reference to their true location on the face of the earth. Image quality considers defects and tonal differences both within and across sheets. Figure 3. is a copy of the initial evaluation sheet used in Vermont to review delivered digital ortho images
National Map Accuracy Standards leave a great deal to be desired when it comes to the spatial accuracy assessment of the completed orthophoto base map. With respect to horizontal accuracy, National Map Accuracy Standards state that "1. Horizontal accuracy: For maps on publication scales larger than 1:20,000, not more than 10% of the points tested shall be in error by more than 1/30 inch, measured on the publication scale; for maps on publication scales of 1:20,000 or smaller, 1/50 inch. These limits of accuracy shall apply in all cases to positions of well defined points only." (U.S. Bureau of the Budget, Issued June 10, 1941, Revised April 26, 1943, Revised June 17, 1947) With individual orthophoto pixel sizes of less than half a meter, the image quality may very well suggest a higher accuracy than the image can support. Many factors will affect the spatial accuracy. One of those factors is the DEM. Many producers of orthophotos only collect their elevation data in a systematic grid. Points collected in this fashion are often called mass points. While this may allow the resultant product to meet minimum accuracy standards, collecting additional points and lines will enhance the quality of the final product and produce a DEM with more utility to the GIS user. Failure to at least collect points on hilltops, cliffs or pits will introduce errors. By collecting a DEM with a combination of mass points, break lines and significant points, a more useful product can be obtained. The DEM should also be valued as a separate product that will have significant utility within the GIS environment in terrain and other map layer development.
Perhaps the best way to sample the spatial accuracy is to use the Global Positioning System or GPS. Since National Map Accuracy standards state that they only apply to clearly visible points it is important to select points carefully. If DEM points have been taken along the major roads, the likelihood of an error on the image is greatly reduced. Finding points away from major road intersections should be considered. Other clearly visible points such as swimming pool corners, sites in parks and other locations will help assure the accuracy of the image. By plotting the points from the GPS collection on the digital image, it is then possible to measure the difference between the image and the GPS point. In addition to checking the absolute difference between these locations, the direction of any discrepancy should also be noted to test for the possibility of a systematic error.
Since most digital orthophoto mapping projects cover large areas, it may not be possible to take GPS readings for each digital image. As an alternative, the evaluator could consider using other digital data within the GIS to look for errors. In the Vermont evaluation, the road network was available in an ARC coverage format and was consistently drawn on top of the digital orthophoto during the visual quality verification. In this way it was possible to look for suspicious areas that could later be checked with GPS readings. Figure 3. illustrates an example.
Some spatial errors are very evident when the imagery is first review. Others are more subtle. Figure 4. illustrates a gross example of a spatial error between two sheets.
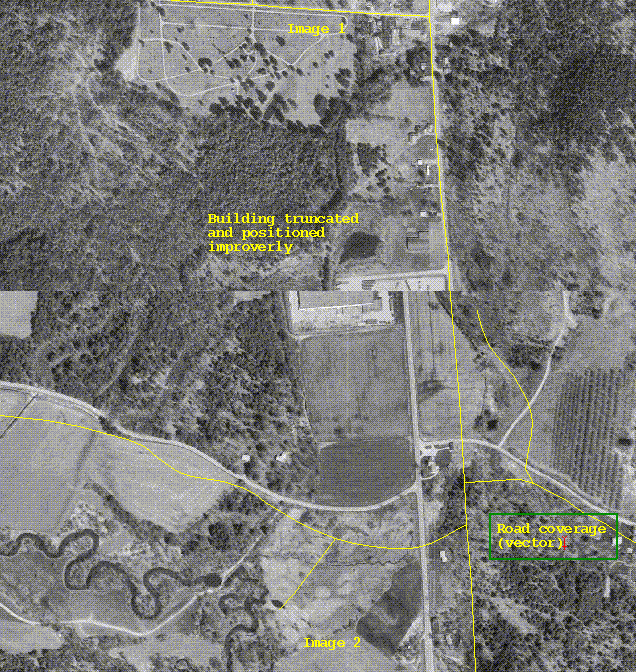
Figure 4. also points out alignment issues between digital images. These errors are most evident along linear features. In subtle alignment cases, the error might not warrant rejection due to National Map Accuracy criteria, however the visual quality of the map may be compromised to a point that recreation of one or both images may be warranted.
In Figure 5., the error is much more subtle and must be carefully evaluated.
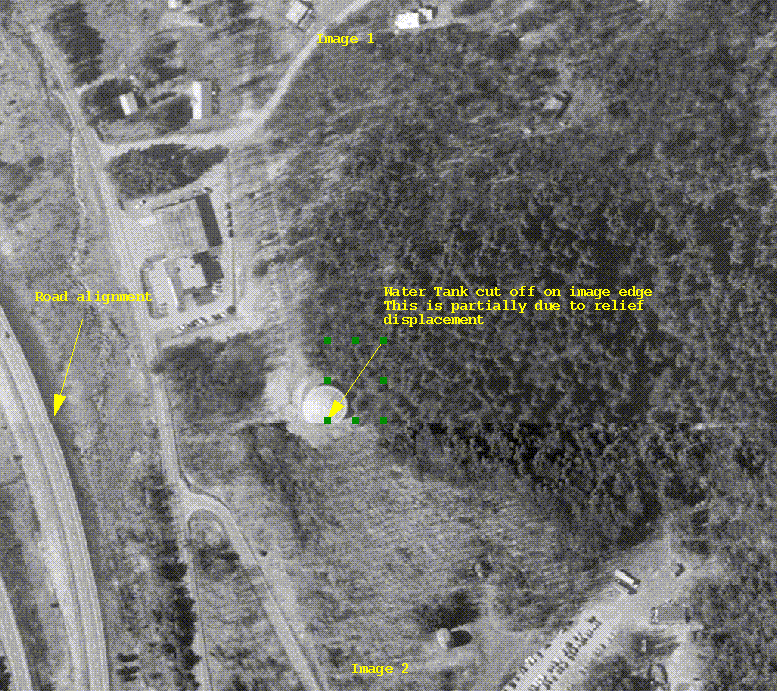
The image in Figure 5. is a water tank. and part of the tank is cut off at the joint with the image to the south. Careful review finally revealed that part of the terrain was missing, however, part of the top of the missing water tower was cut off by relief displacement. Since points that are higher than the Nadir lean out, this type of distortion may not be a spatial error, but rather an optical artifact of the original photography. Similar distortions will be found along sheet edges that image tall buildings. High bridges can also be a source of error or distortion. By moving the terrain under the bridge to remove relief displacement the actual bridge may appear out of alignment with the connecting highway. In these instances, it is necessary to adjust the image to move the bridge back into alignment with the road to produce an optically pleasing image.
Issues of image quality can be grouped into two categories. The first is naturally occurring anomalies and the second are human induced errors. Examples of natural quality reducing factors are specular reflectance from waterbodies and deep shadows caused by low sun angles. Figure 6. illustrates several quality degrading features.
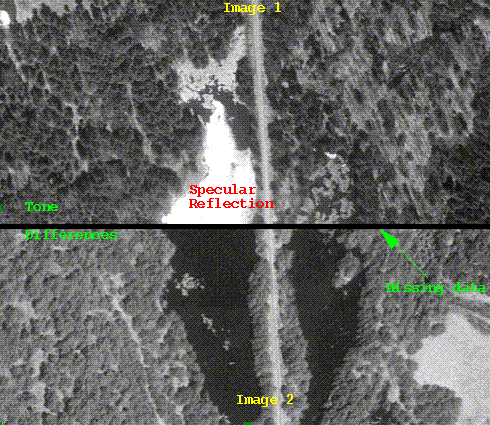
The bright spot on the upper image in Figure 6. is caused by specular reflectance from a body of water. This natural occurring phenomenon occurs when the angle of incidence of the sun light striking the smooth water surface equals the angle of reflection up to the camera. The tonal differences between the images are fairly minimal, but can be reduced. The thick black line between the images illustrates a lack of data and would be the result of operator error.
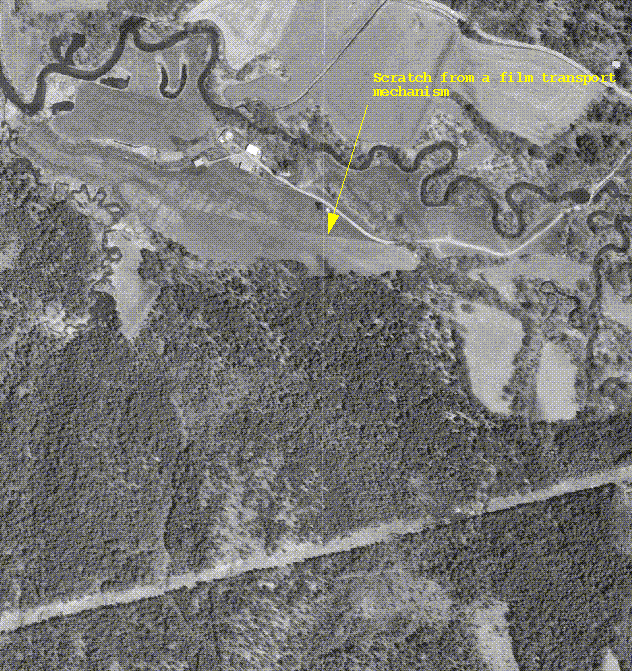
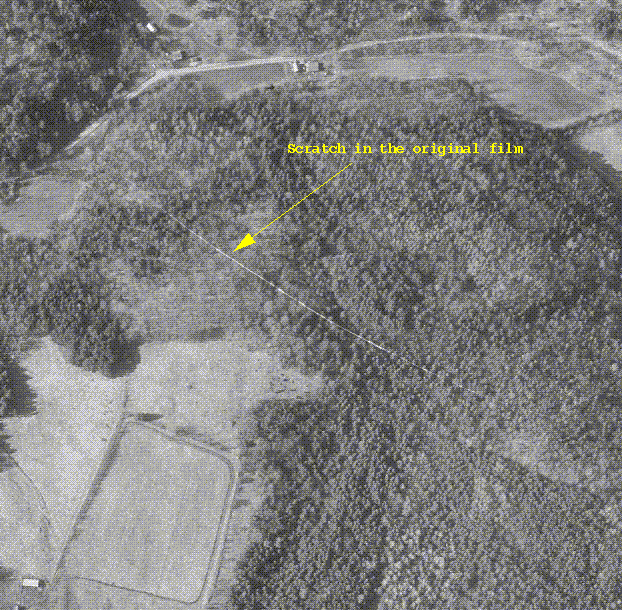
Scratches can enter the image production at several stages. The first can occur during the aerial photo acquisition. These types of scratches come from the film transport mechanism as the roll of film is moved in the camera. These scratches run in straight lines through the image in the direction of the flight line. These scratches will be picked up when the photo is scanned and will appear on the digital image. Figure 7. illustrates this type of scratch.
Other scratches can be inflicted by improper handling of the photography prior to scanning. These scratches are often bolder and more disruptive. Figure 8. illustrates such a scratch.
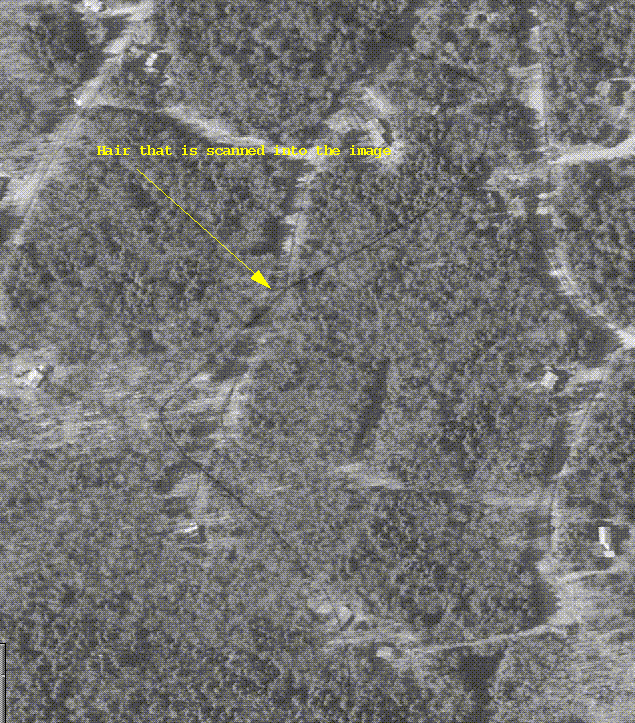
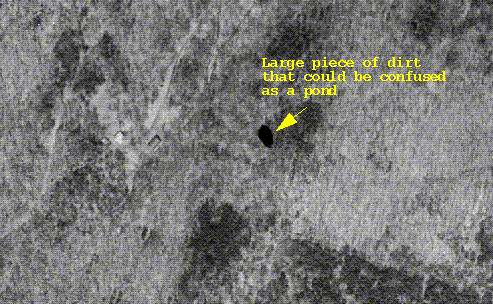
Dirt and lint can also be incorporated into the ortho image if it is not carefully removed prior to scanning. In general the dirt specks will appear as dark spots on the image and can often be confused with small waterbodies. Figure 9. illustrates a digital orthophoto with a large piece of dirt scanned into the image.
Lint and hair pieces will usually appear as gray or white spots or wavy lines. These too, like the dirt spots are incorporated into the digital image during the scanning process. Figure 10. illustrates an example.

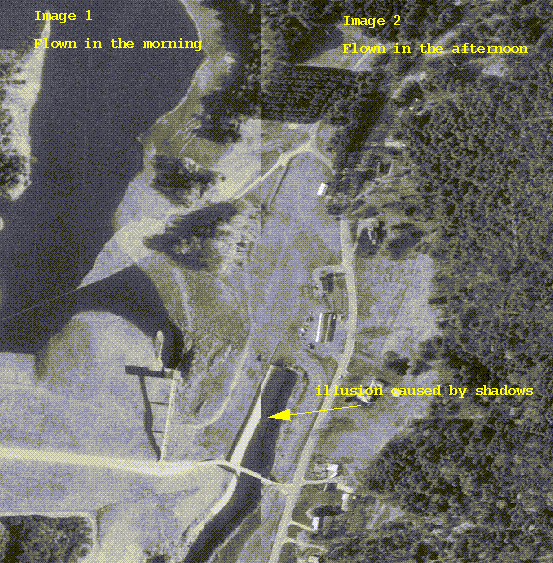
Shadows and the time of day can be a significant detractor to an otherwise excellent image base. This problem is exacerbated when adjacent flight lines are flown at extreme ends of the flying window. In the worst case scenario, the western line is flown early in the morning and the eastern image is flown in late afternoon. This situation should be avoided. Figure 11. illustrates the appearance of imagery flown at these extremes.
Review of the digital imagery will involve spatial accuracy sampling in the field with GPS.
RECOMMENDATION 1.  Sample points away from roads and location where
                   DEM points will have been taken.
To properly review the digital imagery for errors and defects, the reviewer will need to have copies of the original photography at the computer screen. A hand lens and stereoscope are also useful during this review process. It is important to consider the scale of the contracted imagery during this review process. The basic review should be accomplished on the screen at the contracted resolution scale. Zooming in beyond that point to find defects is not fair to the orthophoto producer.
RECOMMENDATION 2.  Require that the DEM and the digital imagery be
                   provided before the review process is started.
                   It is often helpful to review the imagery with
                   these point positioned on top of the imagery.

RECOMMENDATION 3.  Consider having the contractor deliver a point
                   coverage for the centers of the original
                   photography that can be positioned o top of the
                   digital imagery.  This will allow the review to
                   identify the photo from which the orthophoto was
                   built.

RECOMMENDATION 4.  Where possible overlay the imagery with a linear
                   coverage like a road or stream network from
                   another map source to help look for spatial
                   errors.

RECOMMENDATION 5.  Establish an accept/reject criteria before
                   starting the review process.  Pieces of dirt and
                   lint will occur.  Establishing ahead of time the
                   maximum amount and size acceptable will
                   facilitate the process.  This should be shared
                   with the contractor.
The DEM can be used in Esri,s TIN and GRID programs to develop surface presentations. If break lines are recorded for water bodies, roads and streams, these lines can be used to create coverages that will match exactly with the digital orthophoto. In Vermont, we have elected to receive the DEM in an ASCII file format, as this information may be requested by many people, not just ArcInfo users. Each point contains 5 pieces of information and comes on a single line. In addition to the X, Y and Z values, each point is assigned a code number for its type of feature that could be used in the ARC GENERATE command and a code number that represents the type of feature represented. A sample line in the DEM file would appear as follows:
4,104673,200142,303.356,1643
The table below illustrates and identifies the various codes and their meanings.
 CODES    Description               TYPE        Description
  1    Start pt. of a line          1003  Irregular significant pt.
  2    Point on a line - vertex     1013  Profile (mass) point
  3    End pt. of a line            1016  Hard Breakline - physical
  4    Single pt.                   3020  Hard Breakline - trans.
                                    6240  Hard Breakline - hydro.
                                    3070  Soft Breakline - physical
                                    3060  Soft Breakline - trans.
                                    6230  Soft Breakline - hydro.
                                    2120  Spot Elev. - cartographic
                                    6200  Hydrography - constant
Converting this ASCII file into an ARC point coverage is particularly easy with the use of ERSI's ARCVIEW2 software. Since the file is a comma delimited ASCII file, it can be read and converted into a table by ARCVIEW. Prior to incorporating this file, the user should first bring the file into an editor and place a comma delimited line at the top of the file. This line should contain the field or item names that are desired in the future point coverages point attribute table file. An example is shown below using the same sample data line from above.
    TYPE,X_COORD,Y_COORD,Z_VALUE,CODE
      4,104673,200142,303.356,1643
      ...
      ...
Once the file has been read into ARCVIEW2 using the xxx option, this file can be converted to a view by using the "ADD EVENT THEME" option found in the VIEW menu. The final step for ARCVIEW is to convert this event theme into a Shape file. Both pcARC and host ARC can convert this Shape file into a point coverage. At this point the points can be re-selected and converted into various coverages or features for further use.
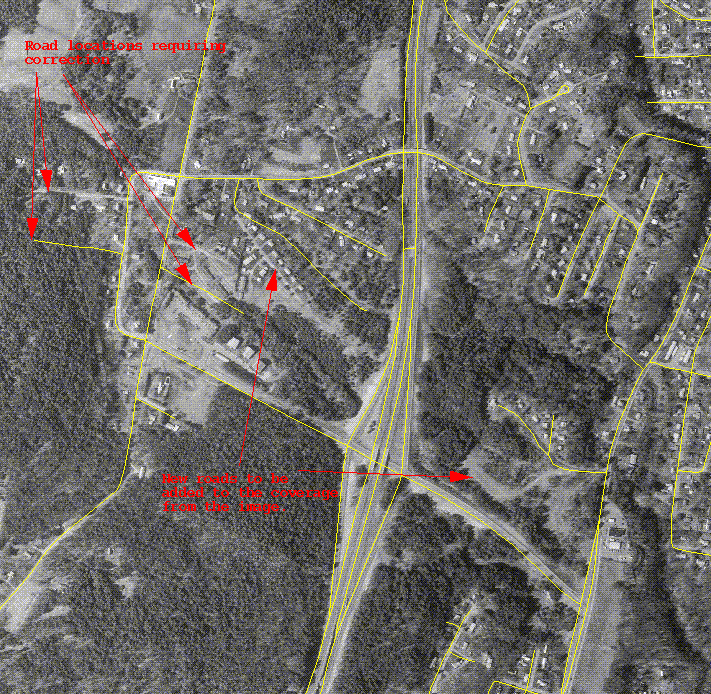
Properly collected and delivered the digital orthophoto and its associated DEM represent a significant addition to a Geographic Information System. In addition to enhancing the visual display of information, this base map can be used directly to add or correct the location of features for use within the GIS. By avoiding the use of cartographic representations of reality, exact building locations or cover types can be correctly mapped directly from the computer screen. Figure 12 illustrates the use of the digital orthophoto as a backdrop to a vector display of property ownership lines and the community road network.
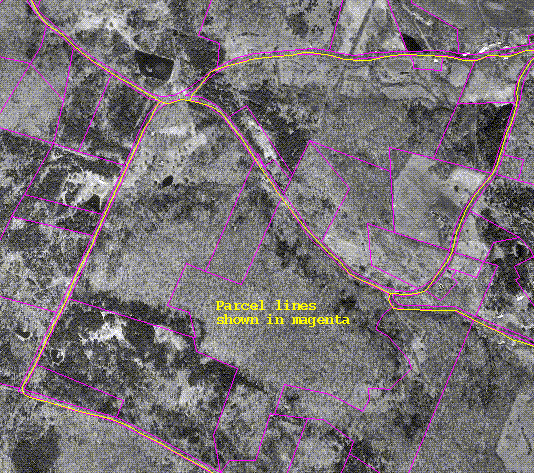
Such a display can be used in 911 and other routing requirements, community planning and a host of other applications. Equally important is the DEM which is initially used to correct the original photo. Its life extends beyond the orthophotograph and can be used in topographic analysis and display. In addition, new software now allows the owner of the DEM to apply this information to new photography to produce orthophoto imagery. While this operation is very compute intensive, localized update on the GIS workstation are now possible with 3rd. party software packages. The key to all of these opportunities lies in the informed GIS manager and a strong QA/QC process to assure image quality is maintained.
Gary S. Smith