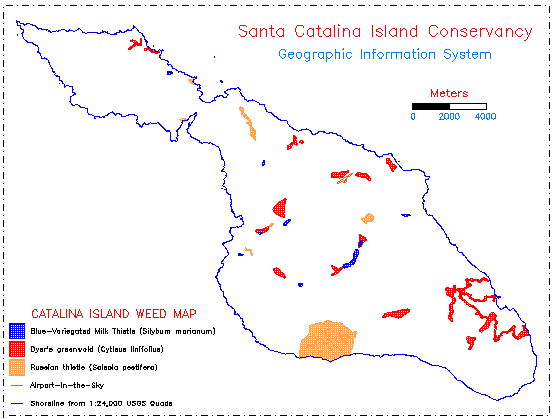
Original wildland weeds map created by Herman Saldaña from field surveys.
Viewing this distribution data alone, without looking at other GIS data
layers, offers relatively little information about any patterns.
The issue of invasive non-native plants, or wildland weeds, in natural ecosystems is one receiving increasing attention on a national and international level. Conservation organizations, federal and state government agencies, and research institutions are focusing significant energies on identifying the most invasive species and appropriate control methods. Further information on this important issue is provided on the Internet by agencies such as the California Exotic Pest Plan Council (CalEPPC), California Native Plant Society (CNPS), The Nature Conservancy's (TNC) Wildland Weeds Management and Research Program, the Federal Interagency Committee for the Management of Noxious and Exotic Weeds, the U. S. Department of Agriculture (USDA), and the Weed Science Society of America (WSSA).
Original wildland weeds map created by Herman Saldaña from field surveys.
Viewing this distribution data alone, without looking at other GIS data
layers, offers relatively little information about any patterns.
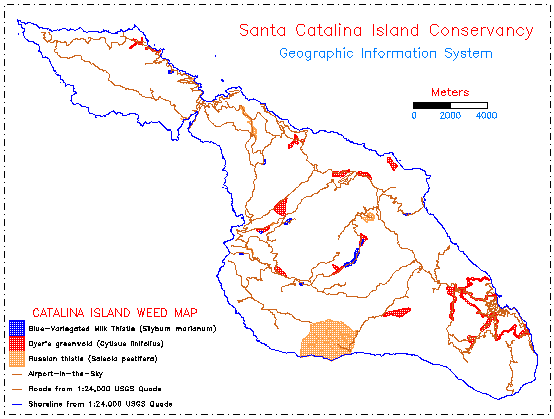
The original wildland weeds map displayed with the GIS road system data layer suggesting
that the mapped weeds could either be dispersed along roads, or that the surveyed
positions are such because they were obtained primarily by driving the roads
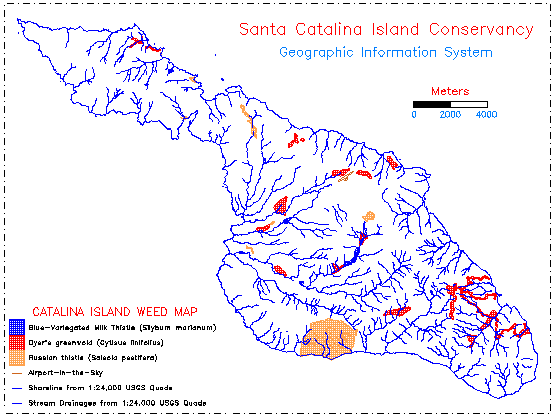
The original wildland weeds map displayed with the GIS stream drainage data layer
suggested that some of the mapped weeds may be spread downstream through streams
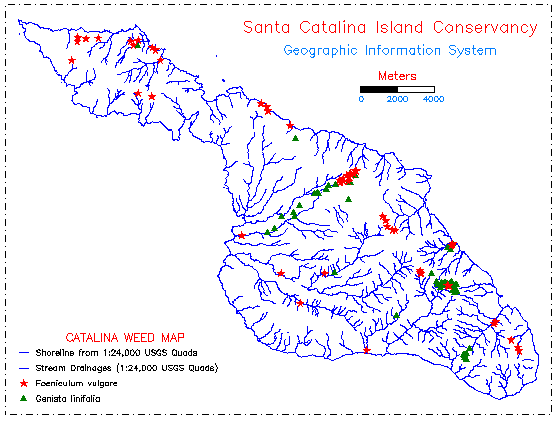
Distribution data for two highly invasive wildland weeds, Dyer's greenwold
(Genista linifolia) and fennel (Foeniculum vulgare), from recent field surveys
by Herman Saldaña. These data will be supplemented with data collection by
Conservancy employees and volunteers using the handheld GPS receivers.
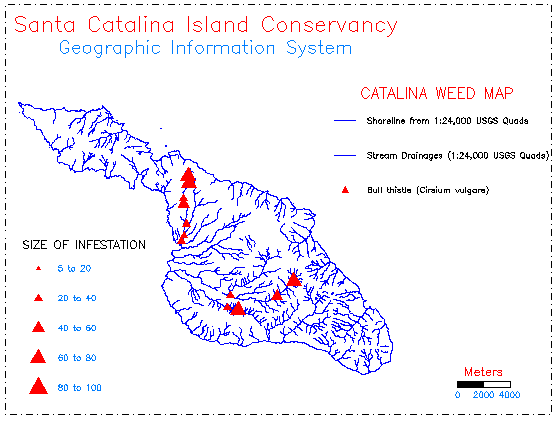
Hypothetical data linked to actual field-surveyed locations for bull thistle
(Cirsium vulgare) showing how the size of individual infestations may be
represented by a thematic variable in the GIS to illustrate potential source
(large red triangles) and outlier (small red triangles) weed populations
 Return to main text