Prepared By:
Monica Alexander
Elizabeth Groff
Laurie Hibdon
An Automated System for the Identification and Prioritization of Rape Suspects
ABSTRACT
Many law enforcement agencies, including the Charlotte-Mecklenburg Police Department, have successfully integrated crime incident mapping into their crime analysis activities. Geocoding and display of various incident types by time of day, day of week, and suspect method of operation are routinely done by analysts and utilized by patrol officers. However, those types of activities are merely the most elementary uses for a geographic information system (GIS). Additional, higher level GIS functionality can be utilized to support investigative activities. One area that may particularly benefit from suspect identification/prioritization is rape investigations. Unfortunately, most GIS�s do not have the "off the shelf" capability necessary to perform this function. However, through the development of a hybrid application - in this case a Spatial Decision Support System (SDSS) that incorporates the concept of an Expert System (ES) and utilizes dynamic data exchange (DDE) - this problem can be solved. The purpose of this project is to integrate the functionality of ArcView and Microsoft ACCESS with the knowledge base of rape investigators to create an SDSS for use in identifying and ranking rape suspects.
INTRODUCTION
Geography has always been important to law enforcement practitioners. Pin maps of incident patterns have existed in police departments since the early 1900�s. These maps were difficult to keep up and lost any hope of interpretation as the volume of crime events increased. In addition, there was no way to easily analyze crimes by type, date or time of occurrence, method of operation, etc. However, the existence of these maps served an important purpose; they laid the conceptual groundwork for computer automation of crime event analysis.
Beginning in the 1980�s, early law enforcement users of GIS could view any subset or combination of subsets individually or at the same time (simply overlaid on one another). Adoption of GIS technology in law enforcement agencies continues to increase. Currently, many agencies have some degree of mapping capability. Being able to quickly and accurately produce maps depicting spatial patterns of crime incidents is the first hurdle most agencies clear on the road to spatial analysis. Once the initial wonder at seeing points on a map wears off, the pressure to develop more advanced analysis tools begins. This process of converting mountains of data into useable information usually involves incorporating the specialized knowledge of "experts" with a user-friendly graphical user interface (GUI). Often, connections between software products are necessary to combine the functionality of more than one application. Since patterns being analyzed have both geographic and nongeographic components, parts of this analysis can take place within the mapping program while others require the unique services of database programs.
Coordinated computer systems that support the decision-making process are often termed Management Support Systems (MSS) (Turban, 1993). One type of MSS is a Spatial Decision Support System (SDSS). An SDSS incorporates a geographic dimension in the analysis. It can utilize aspects of a Decision Support System (DSS) as well as an Expert System (ES). A DSS is loosely defined as any system that provides information about possible scenarios based on user input while an ES actually incorporates the knowledge base of an "expert" in the ES to provide answers to questions. An ES replaces the decisions made by an individual when evaluating information (Turban, 1983). This ability to substitute machine time for human time is especially important when the volume of information is large. High profile rape cases can generate thousands of suspects. The ES portion of the program provides the set of rules that can be used to rank each suspect.
Another part of an SDSS is communication among the various software products. Dynamic data exchange (DDE) is essential to developing a crime analysis SDSS that utilizes several different applications. DDE enables different software packages to have conversations with each other (Esri, 1995; Grochowski, 1995; Razavi, 1995). During these conversations data can be passed between applications, calculations performed and the �value-added� data passed back to the client application. In addition, all of these transfers can be transparent to the end user.
The basis for the rules used in an SDSS which incorporates ES capabilities can come from �experts� in the field or from knowledge gained from research. This project relies heavily on the �expert� knowledge of rape investigators and research findings in the fields of environmental criminology and urban geography.
Environmental criminology has its roots in earlier research that examined the physical/design characteristics of �place� to determine why crimes occurred there. Oscar Newman (1975) was one of several researchers who began the movement termed �defensible space�. The research team of Brantingham and Brantingham (1981) broadened the focus and coined the term �environmental criminology� to describe their emphasis on the �where� of a crime rather than focusing solely on the individual offender or victim. Their approach can be summed up in the following statement from their book Environmental Criminology (1981):
"Environmental criminologists set out to use the geographic imagination in concert with the sociological imagination to describe, understand, and control criminal events. Locations of crimes, the characteristics of those locations, the movement paths that bring offenders and victims together at those locations, and people�s perceptions of crime locations all become substantively important objects for research ... Moreover, overt policy choices which create or maintain crime locations or areas of criminal residence also become important objects of research." p. 21.
Work done by the Brantinghams and other urban geographers provided the basis for the development of new techniques in crime analysis, techniques that were heavily dependent on the unique analysis capabilities of a spatial analysis engine. Their research on the intersection of offenders and victims has yielded important information. They found that the geographic behavior of criminals is similar to that of the rest of the population (Grescoe, 1996; Rossmo, 1995). People tend to carry out their activities in areas close to or along the way to important nodes in their lives. Home, work place, school and important recreational sites are examples of these nodes.
Horton and Reynolds (1971) termed this phenomena action space. They defined action space as "the collection of all urban locations about which the individual has information and the subjective utility or preference he associates with these locations." (Horton and Reynolds, 1971:86). Several additional studies have confirmed the existence of defined activity spaces and identified the importance of current and previous home locations in the formation of an individual�s activity space (Saarinen, 1976). Retail geography has made frequent use of this information in siting stores. If a store is along a high volume roadway it will by default be a part of more people�s activity space and be more likely to be patronized. These rules also characterize the behavior of criminals with one exception: criminals tend to allow a buffer of several city blocks around their home to reduce the chance of being recognized (Grescoe, 1996).
Kim Rossmo (1995) built on the work of environmental criminologists and urban geographers to create a program called Criminal Geographic Profiling. Rossmo focused his application on the identification of the home address of serial criminals. Given a number of related crime locations, the software can reliably identify the areas with the highest probability that the perpetrator lives there.
However, in Charlotte-Mecklenburg, serial rapists are few. In the majority of rape cases, roughly 60%, the victim knows the perpetrator. The 40% of cases where the victim does not recognize their assailant are more difficult to solve. These cases would benefit the most from this type of application. Stranger on stranger rapes require a tool that can sift through several databases quickly and then identify and rank potential suspects.
The following paper describes some of the challenges that the Charlotte-Mecklenburg Police Department (CMPD) faced when attempting to develop an automated system to identify and rank rape suspects. In this project, ArcView is used for mapping and ACCESS is used for reporting.
METHODOLOGY
Geographic Information Systems serve as a powerful tool in analyzing crime patterns, but they are far from reaching their potential in investigative analysis. Through a collaborative effort between the Rape Investigations Unit and the Strategic Planning & Analysis Bureau (SP&A) of the Charlotte-Mecklenburg Police Department (CMPD), a Spatial Decision Support System (SDSS) was developed to aid in the identification and prioritization of suspects in rape case investigations.
The CMPD�s Rape Investigations Unit consists of one supervisory sergeant and five investigators. The five investigators served as the experts to develop this system through their knowledge of the field. Each investigator was asked to complete a survey in order to capture their insight in regards to the rape investigation process, and this insight was then programmed into a GIS so that the resulting system could function as an Expert System (ES) (Appendix A). The final product would then provide the computerized means of identifying and prioritizing suspects in rape cases in which no immediate suspects are evident. Once the program is developed, the next phase will involve evaluation of the accuracy of the model. Undoubtedly, there will be many iterations of enhancements and evaluation.
Developing the �Expert� Rules
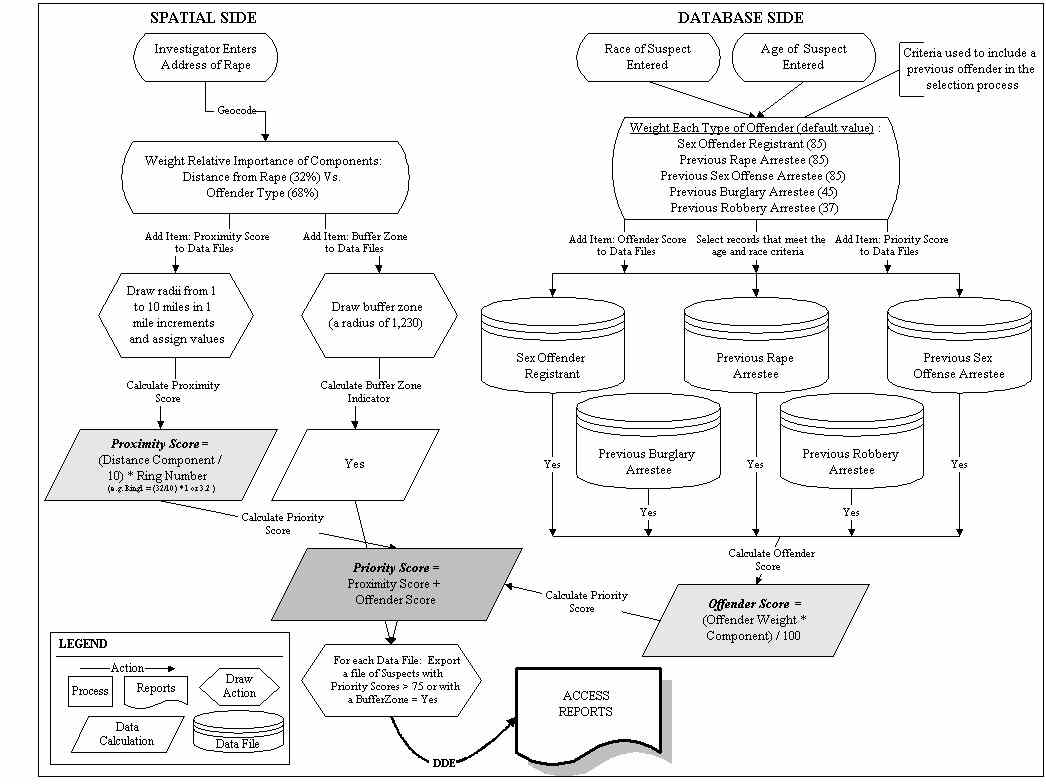
Investigators were first asked to rank certain types of offenders from 0 to 100 (or from �no potential� to �extremely high potential�) according to the probability that that particular individual represents a potential suspect in a rape case. The offender types included were the following: sex offender registrants, previous rape arrestees, previous sex offense arrestees, previous robbery arrestees, and previous burglary arrestees. (This list will eventually expand as new data sets become available and are included in the model.) Since this system was being created within a GIS, distance also became a viable factor in the analysis. Investigators were instructed that each suspect�s ranking/score could also be influenced by his distance from the location of the rape case under investigation. They were asked to determine what percentage �offender type� versus �distance from rape� should be utilized to determine a suspect�s prioritization score (Figure 1). Averages of the five respondents� answers were then calculated and programmed into the system.
Figure 1: Flowchart of SDSS Model
Data Sets
Data sets used in the analyses included sex offender registrant home addresses, previous rape arrestee home addresses and arrest locations, previous sex offense arrestee home addresses and arrest locations, previous robbery arrestee home addresses and arrest locations, and previous burglary arrestee home addresses and arrest locations. Sex offender registrant home addresses were available from January 1996 to present. All other data sets were available from January 1995 to present.
Modeling the Decision-making Process
Taking into consideration offender type and distance from a particular rape, each suspect within the available data sets is assigned a prioritization score which can be used by investigators to prioritize the next steps of their investigative process. For instance, a sex offender registrant is prioritized higher than a previous burglary arrestee and therefore receives a higher score. In addition, a suspect located within one mile of a rape is scored higher than a suspect located ten miles away.
An additional aspect to the distance variable is based on the environmental criminology studies of Patricia and Paul Brantingham (1981) and Kim Rossmo (1995). Suspects whose home addresses fall within approximately 1200 feet of a rape case are scored the same as those located over ten miles from the rape location. This portion of the model draws from the concepts of activity space and the least-effort principle. To explain, the pattern of one�s activity space - the transportation routes one selects to go to work, shopping, or visit an acquaintance - is related to one�s home address. This activity space is where the criminal first identifies victims. Coupling this concept with the least-effort principle, a criminal will select a target who represents the least effort or, in other words, who is closest. The exception to this rule is that fear of apprehension creates a buffer around a criminal�s home of 250 to 500 meters in which the possibility of being recognized by neighbors is too high to commit an offense. The mid-point of this distance range, 1230 feet, was utilized in developing this model. Because the rape investigators felt that certain cases might not fit the norm in regards to the Brantingham�s studies, resulting reports which are generated after the analysis is completed indicate those suspects who fall within the 1230 feet radius from the rape location.
Application Steps
This system was developed within Esri�s ArcView GIS software using the programming language Avenue and utilized the functionality of dynamic data exchange (DDE) and a client-server connection between ArcView and Microsoft Access to produce corresponding reports.
The components of the SDSS are outlined in Figure 1. There are two main lines of analysis, spatial and database. A spatial line is used to rank suspects based on the distance of their home address or their previous arrest location from the rape location. Database queries are used to narrow the list of suspects based on a description of the age and race of the suspect, and suspects are ranked according to the type of crime that they previously committed.
Initially, the user simply clicks on a button to start the analysis. They then are asked to type in the address of the location of the rape case under investigation. Next, the user is prompted to indicate the race and age range of the suspect to narrow the scope of the search (Figure 2 & 3).
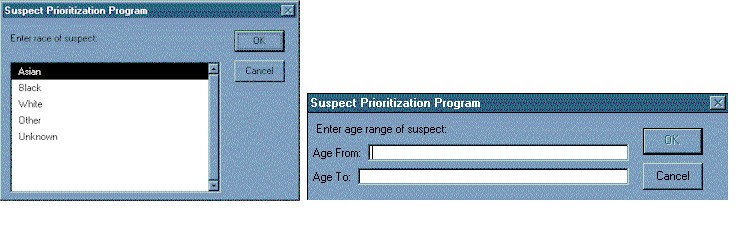 Figure 2: Race of Suspect Figure 3: Age of Suspect
They then have the flexibility of utilizing the weights assigned to each offender type based on the results of the surveys completed by the rape investigators, or they can customize the weights to reflect their perception of what would generate the best leads in the current case under investigation (Figure 4). They also have this same flexibility in utilizing the weights assigned to �offender type� versus �distance from rape� based on investigator input from the surveys, or they can customize these weights as well based on the facts of the case and their experience within the field (Figure 5).
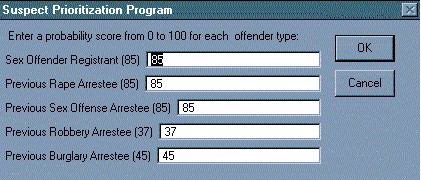
Figure 4: Weighting of Offender Types
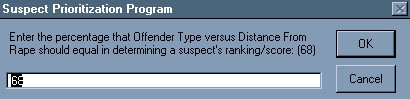
Figure 5: Weighting of �Offender Type� vs. �Distance from Rape�
Based on the weights assigned to the offender types and the weighting of �offender type� vs. �distance from rape�, a new field is added to each of the suspect data sets and a value is calculated to represent their �offender score�.
To include the distance factor in the analysis, ten circles radiating from the rape location (the center point) in one mile increments are calculated within the GIS. An additional radius of 1230 feet is also utilized to draw a circle around the rape location. In the same manner that the offender score is calculated, a value representing each suspect�s distance from the rape is computed and represents their �proximity score�. This value is based on the radius within which each suspect falls. Those located within a one mile radius are scored higher than those located within a radius greater than one mile but less than two miles, etc. Those falling within the 1230 feet radius are scored the same as those falling outside a ten mile radius of the rape location. A second field is then added to each of the suspect data sets to store this proximity score. Because the CMPD�s rape investigators feel that certain cases might not fit the norm in regards to the Brantinghams� studies, a third field is added to each of the data sets to represent an indicator of those suspects whose home address is located within the 1230 feet radius, or buffer zone. This item is then included in the final reports generated from the analysis.
A fourth field is added to each suspect data set to store the �priority score� for each individual. The value calculated for this field is the sum of the offender score and proximity score and represents a suspect�s likelihood to have committed the offense relative to other possible suspects.
Generating ACCESS Reports via DDE
The ability to pass data and instructions between different software packages is integral to the development of more sophisticated spatial analysis techniques that are invisible to the end user. Dynamic data exchange (DDE) allows this communication and is supported by all the Microsoft Windows operating systems (Windows 3.1x, Windows 95 and Windows NT). Communication can take place between any software applications that support DDE (Esri, 1995). Basically, DDE allows the automation of cut and paste actions, export of files, calculation of statistics, or calculation of geographic location. From an end user standpoint, automation via DDE creates an easy to use, seamless application.
On a more technical level, there are two basic concepts essential to the understanding of how a DDE conversation works: definition and data exchange methods (Esri, 1995). A DDE conversation involves communication between a source application and a destination application. The destination (also called the "client") is the application making the request of the source application (referred to as the "server"). In this project, ArcView is the destination or "client" application because it is sending data to ACCESS.
There are two components that define a conversation in DDE: the application name and the topic (Esri, 1995). Each application has a unique name , generally this is the name of the application without its extension (e.g. ArcView, EXCEL or ACCESS). A topic refers to the subject of the conversation. The subject could be a file name or a more general topic (e.g. system). Together, the application name and topic uniquely define each conversation.
Once the conversation is initiated, there are specific methods that are available in DDE to exchange information. These methods are application specific. ArcView supports three basic methods: execute, request and poke. Execute is used to send commands to the source application. Request allows ArcView to ask that data be sent back from the source. Poke enables ArcView as the destination application to send data to the source (instead of the normal flow direction, from source to destination). This project illustrates the use of all three DDE methods in an application.
Once the calculations are completed, a DDE connection between ArcView and Microsoft ACCESS is established. The information resulting from the analysis is then exported, and a report is generated providing a listing of potential suspects with their corresponding prioritization scores and the inner radius indicator without having to leave the GIS application. From this point, the investigator now has a new tool which provides the potential to close in more quickly on the guilty individual.
DISCUSSION
Development of SDSSs like this one is the logical next step in the utilization of GIS technology in law enforcement. Our experience has demonstrated that it is possible to create an SDSS that incorporates ES and DDE processes to enhance the functionality of an off the shelf GIS product. The following section outlines some of the hurdles of this project and discusses the strategy for evaluation of the system.
The biggest challenge related to DDE was researching the correct syntax to use with ACCESS and AVENUE. Documentation of DDE is minimal and most sources are accessible only via the internet. In addition, a strong familiarity with the software programs being used is suggested.
Evaluation and subsequent fine tuning of the system are the next logical phases of the project. The first step in evaluation is to identify at least ten rape cases in which the victim was not acquainted with the perpetrator and the perpetrator was arrested. Once each case is identified, it is a simple matter to recreate the scenario to see if the arrestee is identified as a suspect by the SDSS and what prioritization score they receive.
Depending on the level of success that is achieved at identifying the offender, further tweaking of the model will be performed. Further programming will also be added to limit the output to suspects with a minimum priority score that is still to be established. This threshold would then provide a more manageable list of suspects in regards to the investigation.
Interest in GIS as an analysis tool in law enforcement is growing. This project is just the beginning. Much work is left to be done in addressing the many and varied needs of law enforcement personnel. Once the power of SDSSs is demonstrated to investigators, the number of application areas will continue to increase.
Acknowledgments
The authors would like to thank Carl Walter, Analyst with the Charlotte-Mecklenburg Police Department, for his invaluable vision in suggesting the answer to a need and in testing the system. In addition, we would like to thank our "experts" in Rape Investigations: Sgt. M.K. Justice, Inv. W.T. Brandon, Inv. K.T. Graue, Inv. L.L. Holmes, Inv. T.I. Shelton, and Inv. K.J. Worthy.
APPENDIX A: Sample of Survey Completed by Rape Investigators
Suspect Prioritization in Rape Cases:
PURPOSE: The purpose of this activity is to assist in the development of a Decision Support System for rape investigators and crime analysts to utilize in rape case investigations when no immediate suspects are evident. The resulting product will allow for the immediate identification and ranking of potential suspects.
1) Rank each type of offender from 0 to 100 according to the probability that that particular individual represents a potential suspect in a rape case. Fill in the blanks to the left of the offender types with the rankings/scores.
SCALE: OFFENDER TYPE:
0 "No Potential" _____ Sex Offender Registrant
25 "Slight Potential" _____ Previous Rape Arrestee
50 "Moderate Potential" _____ Previous Sex Offense Arrestee
75 "High Potential" _____ Previous Robbery Arrestee
100 "Extremely High Potential" _____ Previous Burglary Arrestee
2) Each suspect�s ranking/score will also be influenced by their distance from the location of the current rape case under investigation. Fill in the blanks with what percentage "type of offender" versus "distance from rape" should be utilized to determine a suspect�s ranking/score. (NOTE: Added together, the two percentages must equal 100%.)
Type of Offender: Distance from Rape:
_____ % + _____ % = 100 %
REFERENCES
Brantingham, Paul J. and Brantingham, Patricia L. (1981). "Introduction: The Dimensions of Crime" . pp. 7-54 in Environmental Criminology edited by Paul J. Brantingham and Patricia L. Brantingham. Beverly Hills, CA: Sage Publications.
Esri White Paper (1995). ArcView2: Working with Visual Basic. Redlands, CA: Environmental Systems Research Institute Inc.
Grescoe, Taras (1996). Murder , He Mapped. Canadian Geographic (September/October, 1996).
Grochowski, Stan (1995). "The Service Request System: An Integrated Powerbuilder ArcView Application". Tacoma, WA: Pierce County GIS.
Horton, Frank E. and Reynolds, David R. (1971). "Action Space Differentials in Cities" pp. 83-102 in Perspectives in Geography: Models of Spatial Interaction edited by Harold McConnell and David Yaseen. Dekalb, IL: Northern Illinois University Press.
Newman, Oscar (1975). Design Guidelines for Creating Defensible Space. Washington, DC; U.S. Printing Office.
Razavi, Amir H. (1995). ArcView Developer�s Guide. Santa Fe, NM: Onword Press.
Rossmo, D. Kim (1993). Multivariate Spatial Profiles as a Tool in Crime Investigation. Unpublished manuscript presented at the Workshop on Crime Analysis Through Computer Mapping. Chicago, IL.
Rossmo, D. Kim (1995). "Place, Space and Police Investigations: Hunting Serial Violent Criminals" in Crime Prevention Studies, Volume 4 edited by John E. Eck and David Weisbud. Monsey, New York: Criminal Justice Press
Saarinen, Thomas F. (1976). Environmental Planning: Perception and Behavior. Prospect Heights, IL: Waveland Press.
Turban, Efraim (1983). Decision Support and Expert Systems: Management Support Systems. New York, NY: Macmillan Publishing.
AUTHOR INFORMATION
Monica Alexander, GIS/Crime Analyst, Charlotte, Mecklenburg Police Department, Bureau of Strategic Planning and Analysis, 601 East Trade Street, Charlotte, NC 28202. Phone: 704-336-8783. Fax: 704-336-7799. E-mail: pdmla@mail.charmeck.nc.us
Elizabeth Groff, GIS Coordinator, Charlotte, Mecklenburg Police Department, Bureau of Strategic Planning and Analysis, 601 East Trade Street, Charlotte, NC 28202. Phone: 704-336-2749. Fax: 704-336-7799. E-mail: pderg@mail.charmeck.nc.us
Laurie Hibdon, Crime Analyst, Charlotte, Mecklenburg Police Department, Bureau of Strategic Planning and Analysis, 601 East Trade Street, Charlotte, NC 28202. Phone: 704-336-8785. Fax: 704-336-7799. E-mail: pdleh@mail.charmeck.nc.us