Otto Anker Nielsen, Assistant Professor, Ph.D.
Thomas Israelsen, Research Assistant, M.Sc.
Erik Rude Nielsen, Research Assistant, M.Sc.
Department of Planning (IFP), Technical University of Denmark (DTU)
Building 115, 2800 Lyngby, Denmark
Telephone: (+45) 45 25 15 14. Fax: (+45) 45 93 61 11.
E-mail: onielsen@ivtb.dtu.dk
ABSTRACT
Traffic models demand large amounts of data - some of which are: Traffic network topology, traffic network data, zone-data and trip matrices. GIS is a natural tool for handling most of these data as it can ease the work process and improve the quality control. However, traffic models demand a complex topology not very well covered by the traditional GIS-topology.
The paper describes a number of applications where ArcInfo and ArcView have been used to automate the process of building a traffic network topology. The methodology has been or can be used on a number of full-scale models, from medium sized urban areas to metropolitan areas (Copenhagen, Denmark and Bandung, Indonesia). The paper covers key subjects in the work process which has been eased considerably by using AML and Avenue scripts or by using the information from ArcInfo in external applications:
Some of these tasks would have demanded an overwhelming work effort to carry through with traditional non-GIS based approaches.
In addition, the paper discusses how the GIS can interact with the traffic model algorithms (typically external applications). Finally, needs for further integration between the traffic network representation in GIS and traffic models are discussed, and examples of work-arounds are given.
1 INTRODUCTION
There are several advantages by implementing traffic models in GIS, since the handling of data is easier and the presentation and quality control of results can be done more easily. For this reason, traffic modeling is maybe the field in traffic planning that has made most use of GIS (see Nielsen, 1995/1). However, traffic models demand a complex topology not very well covered by most GIS-packages. Therefore, GIS has primary been used for displaying results from traffic models and not as an active tool in the work process of building the data foundation for traffic models.
Section 2 of the paper describes a number of applications where ArcInfo and ArcView have been used to automate the process of building a traffic network topology. Some of the key subjects in the work process has been eased considerably by using AML and Avenue scripts, other by further modifications done by external applications on data exported from ArcInfo.
Section 3 discuss how to handle many project alternatives in a consistent way without copying the whole data set/coverage each time. This reduces the amount of redundant data significantly.
Section 4 describes the network topology needed to perform a traffic assignment and how to translate from the GIS’ network representation to the needed mathematical graph for the calculations/traffic models.
Section 5 outlines the conclusions and perspectives of the use of GIS-based network in the process of traffic modeling.
2 ESTABLISHING NETWORK TOPOLOGY IN GIS
In the following a number of applications are described in which ArcInfo and ArcView have been used to automate the process of building a traffic network topology. In addition a method to import public transport networks from traffic models is described. Some of the key subjects in the work process has been eased considerably by using AML and Avenue scripts, other by further modifications done by external applications on data exported from ArcInfo.
2.1 Introduction to the required topology in traffic models
Traffic models make use of two types of data or variables: The variables which the traffic depends on, labeled the explaining variables, and the traffic data, which are used for estimating and calibrating the models. The explaining variables are usually divided into variables (or data) which describe a need for traveling, also called the travel-potential or demand (socio-economic variables), and traffic network related variables which describe the resistance against traveling (the travel resistance’s), also called the supply-side of traffic models.
The socio-economic variables are often contained in a zone-structure in the traffic model, and are thus often referred to as zone data.
The traffic network can be described by a complicated topology involving links, nodes, turns (e.g. given by turn tables), routes (e.g. given by dynamic segmentation) and changes between routes at terminals (two data types not defined in ArcInfo, to be discussed further in section 4). In addition traffic models will often contain different networks, e.g. car, bicycle and public transport networks. Some of these networks are fully related (e.g. cars, busses, bicycles and pedestrian in the same street), some are only partly related (car, bus and bicycle in the same street, but separated in bus-lanes, bicycle paths and sidewalks) and some are totally separated (e.g. motorways, railways, bicycle paths in their own right of way). A certain journey might use different traffic network (e.g. bicycle to the station, train to the city, walk to the bus stop, bus, and walk to the work).
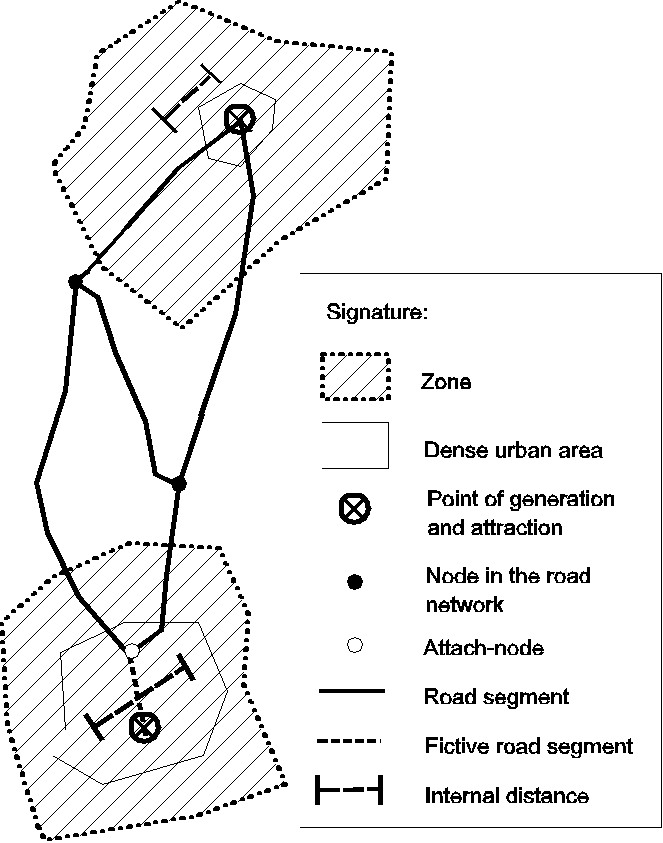
In order to relate the travel demand given by socio-economic data to the network, a node is attached each zone. This is referred to as the zone’s point of generation and attraction. By this approach it is assumed that all trips to and from the zone will be generated/attracted in this point. The point is connected to the traffic network at one or several nodes in the network. Such a node - called the attach node - can be the end-node in a certain road segment, labeled the fictive link. This road segment describes the travel resistance from a locality in the zone and out to the main traffic network.
Traffic models often use the name zone centroid for the
point of generation and attraction (or shorter the centroid
in the traffic literature). In other professional disciplines the
name centroid is often used for the geometric center of a zone.
The geometric center is not necessarily the same as the point of
generation- and attraction, as this point is determined under
consideration of land use, area development and the structure of
the traffic network.
Figure 1: Relationship between a zonestructure and a traffic network.
Figure 1 is an example of the relationship between a zone structure and a traffic network. The internal distance is the average distance (or travel resistance) covered by a trip within the zone.
The information about travel patterns is often represented by the so-called trip matrices, which in different ways represents traffic between the zone of origin and the zone of destination of all trips.
2.2 Semi-automatic procedures for attaching zones and zone-centroids to the network
As mentioned in section 2.1 it is necessary to connect the traffic network and the zones in order to make calculations in a traffic model. This is done by creating a zone-centroid
.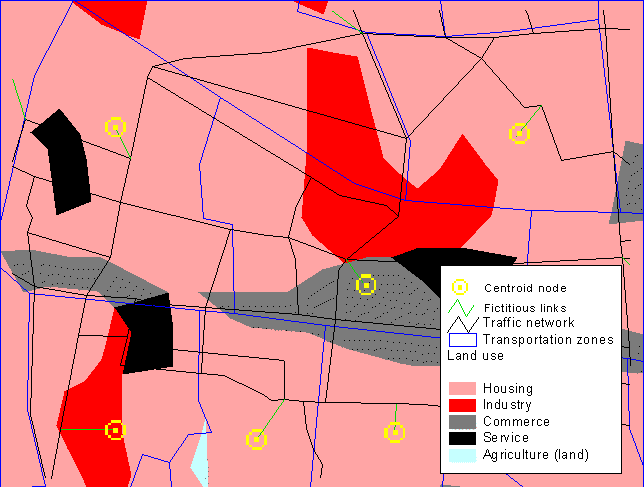
Figure 2. These centroids were placed on the basis of the land-use distribution.
To support the decision of placing the zone’s centroid-node, a sufficiently detailed map should be used as background for the network and the zones. Figure 2 shows an example from Bandung, Indonesia, where a land-use map was used as background. The advantages gained by using a GIS in the process of establishing the centroid-nodes and the fictive links are evident, since the process involves both geographical operations and database manipulation. Therefore, in order to automate the process, the AML-application centroid has been developed by the authors. The functionality is:
Below is seen a pseudocode-description of the AML:
Initialization.
Choose zones to process.
For all chosen zones Do:
Select and zoom to the current zone.
Find the zone-internal distance, according to the formulas listed in section 2.2.1.
Draw roads, nodes, and polygons.
Choose in which way the centroid should be attached to the network:
- Attach the fictive link to an existing node, or
- Create a new node on an existing arc, where the fictive link should be attached, or
- Appoint an existing node centroid.
Find suitable arc- and node-snap tolerance.
Input ID's for new node and arc, and check to see if they already exist.
Prompt the user to add the fictive link. (It is assumed, that the user knows the options in the 'add' command).
Set the following attributes for the fictive link: Capacity := infinite; Direction := both ways; Speed := dependent on zone attributes.
The changes are saved here in order for ArcInfo to update the arc-node topology.
Input ID for the attach-node, if one has been added, and check for the existance of other nodes with identical IDs.
Check whether more than one arc is attached to the centroid.
Check for inconsistencies related to the number of arcs attached to the attach-node.
Output an overview of entered values.
Let the user choose one of the following ways of continuing: 'Continue with next zone', 'Delete selected arc and redo this zone', 'Do not delete anything, but redo this zone', 'Exit program', 'Delete selected arc, and continue with next zone'.
If the user did not approve the added arc, all edits are undone. Else the final item-values are assigned.
End-loop.
It is noted, that since it is not generally considered a good idea to attach a centroid to the network by using more than one fictive link, this is not possible in the AML.
One of the major advantages of using this AML (and one, that is maybe not self-evident) is, that it dramatically reduces the risks of making errors in the process, since a lot of coordination is needed, when simultaneous and consistent updating of three different attribute-tables is needed.
2.2.1 Zone-Internal travel distance
As mentioned in section 2.1, the zone-internal travel distance is a measure of the average distance between two locations within a zone. The zone-internal distance is used to calculate the number of trips that have their origin and destination within the same zone, also called zone-internal trips. These zone-internal trips are - due to the fact that all trips from or to a zone starts or ends in the zones centroid-node - never assigned to any part of the road network. It is however important to deal with zone-internal trips in a consistent manner, since their order of magnitude can be substantial, and this influences the rest of the trips in most traffic models.
2.2.2 Fictive link speed
The speed assigned to the fictive link should be dependent on the characteristics of the zone it belongs to. For example, the average traveling speed in a trip from the start- or end-point to the traffic network is quite different in rural zones and dense residential areas with small local roads. Fortunately this type of information will be available in most traffic models. In the centroid-AML a simple rule is used: If the zone area is less than 1.8 mill m2, the speed will be set to 5 km/h, otherwise the speed will be 15 km/h. This was appropriate in the given case.
2.3 The process of building a link-node-turn topology and attaching data semi-automatically
Many existing traffic assignment models simplify the road network to a link-node topology. However, turn-delays in intersections contributes significantly to travel times and thus route choices in urban networks. Besides the theoretical problems in getting traffic assignment models to consider turn-delays, it demands a huge work-effort to establish the needed data.
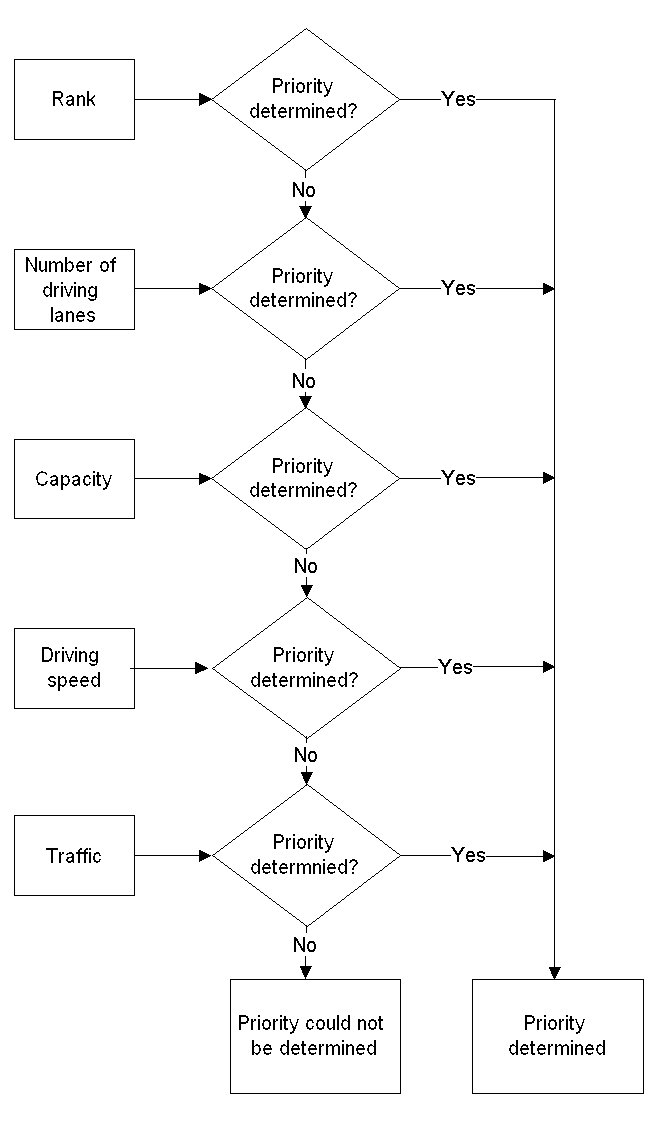
Therefore, IFP have developed a methodology where link data contained by most existing traffic models can be used to give reasonable estimates on data needed for intersections and turns (See Frederiksen & Simonsen, 1997 or Nielsen et. al. 1997/5). To do this a set of expert system rules uses the link attribute data and their geometry (centerlines). Hereby, the intersections are classified in a number of groups - such as non-prioritized, prioritized, signalized, wedges, and of course T- and F-junctions (Three way junctions and Four way junctions). After which, the priorities of the roads are estimated and data on the turns established.
To do this, it has been found essential to classify the link-based data into 9 fundamental classes:
Figure 3 shows an example of the different basic types of roads. As seen it is also very important to keep information on whether the link-segments are one- or two way.
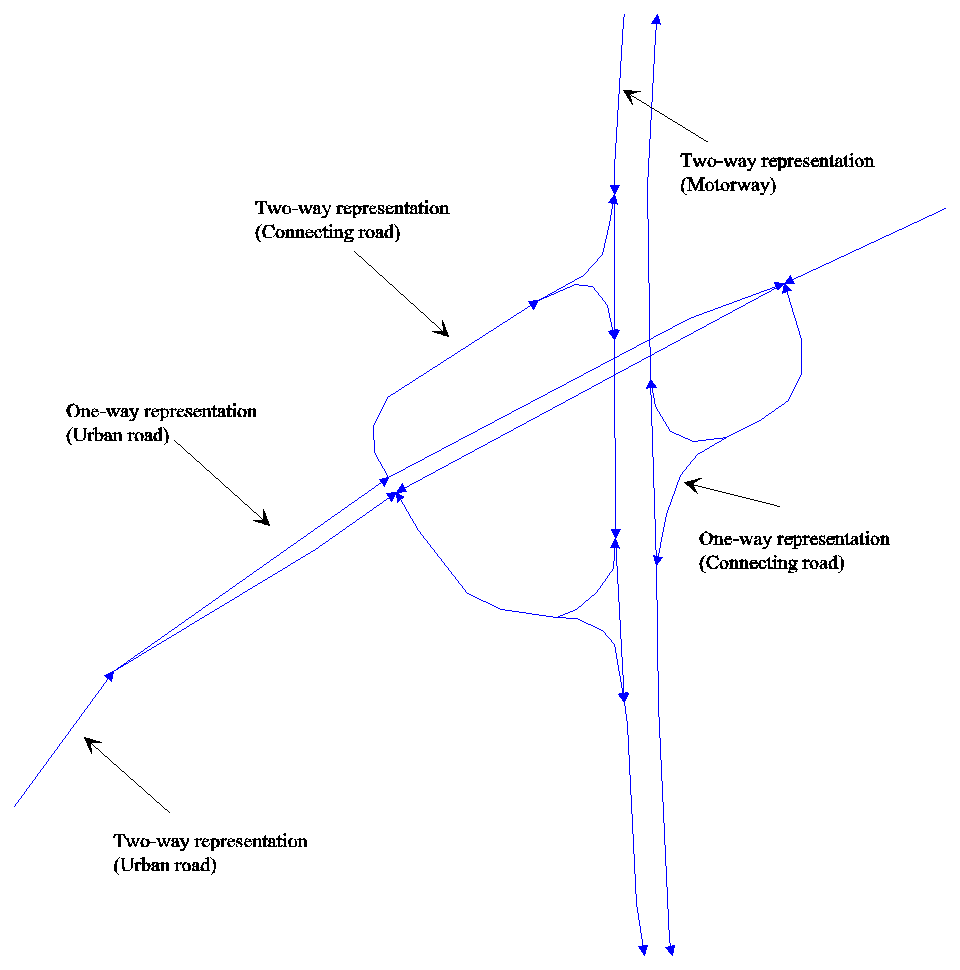
Figure 3: Examples on link-representations in a traffic model (the Copenhagen traffic model).
Regarding nodes between roads, the following types can occur (see figure 4 for examples):
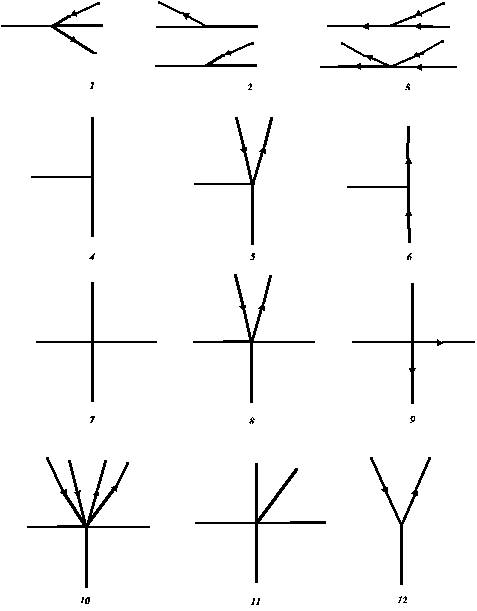
Figure 4: Examples of different intersection types (all taken from the Copenhagen traffic mod-eling network). 1. Ramps to expressway, 2. And 3. Ramps to motorways, 5. T-junction, where one of the roads are represented as two one-way streets, 10 is the start of a motorway with two parallel local roads, 12 is a Y-junction.
Y-junctions occurs when two-way streets continue in two one-way streets. This can be real or due to the model-representation (as one of the cases in figure 3). In addition some other types of nodes may occur, e.g. railway crossings at level, custom houses, drawbridges and pedestrian crossings. These have to be dealt with manually due to their individual characteristics. Regarding the common node-types, several do seldom occur in the major road networks in traffic models. In addition wedges and Y-junctions are usually not handled by traffic models, as they seldom give cause for delays. Thus, it is usually only needed to consider prioritized T- and F-intersections, signalized intersections and roundabouts in traffic models.
However, even with this simplification it would be a very large work to classify the relevant intersections in a large traffic model manually. Thus, it provides a great help to use the link attributes and characteristics to automate the process. The following attributes are usually part of the link-coverage in traffic models:
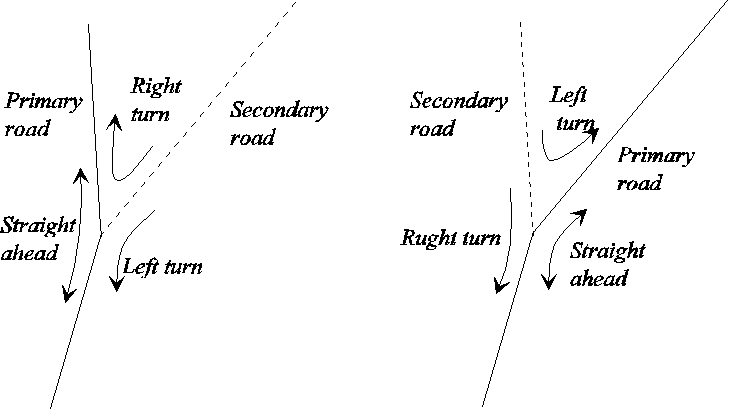
Figure 5: The turn-movements in T-junctions are dependent of the priority of the roads.
The first step in the process is to determine the
prioritization of the intersection. Regarding T-junctions, the
prioritization cannot be determined from the geometry (see figure
5). Therefore, it needs to be determined by the attribute data,
and first if this fails then by the geometry (see figure 6). 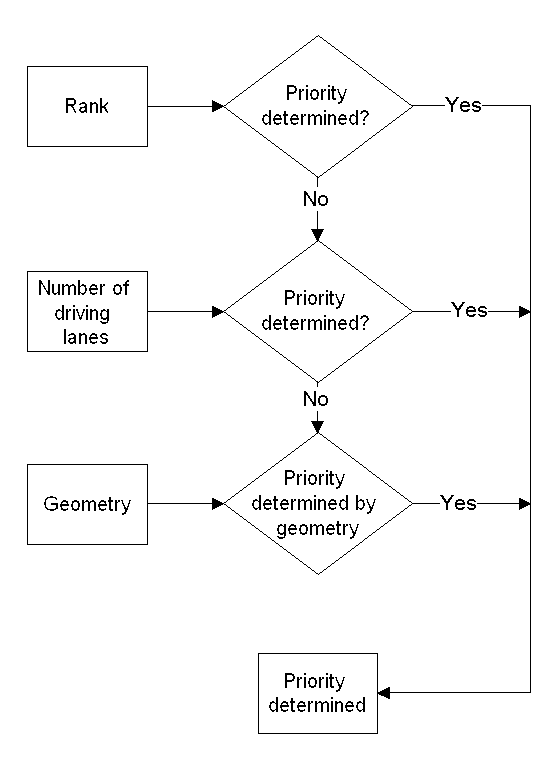
Figure 6: The principle in determining the priority of the roads at T-junctions.
In F-junctions it is obvious that two opposite links constitute a crossing road (except in intersection with very special duty to give way). Therefore, it is only needed to settle the priority (which of the two roads is the major road). Figure 7 shows the principles for doing this.
Figure 7: The principle in determining the priority of the roads at F-junctions.
Table 1: The distribution of node types
2.4 Coordination of road networks and public transport networks
Figure 8: The two versions of the same network: The blue network is the geogaphically correct one.
An ‘pseudocode-description of the AML follows.
Route-cover := copy of public-cover.
Generate a list of unique FNODE#-TNODE# combinations in the route-cover
For each FNODE#-TNODE# combination:
Create items route_id_1...route_id_%max_coincide% in route-cover.
For each FNODE#-TNODE# combination:
| 5 | 2 | 4 | B17 |
| 6 | 4 | 2 | B3 |
| 7 | 2 | 4 | T5 |
| 8 | 2 | 4 | E9 |
| 5 | 2 | 4 | B17 | B3 | T5 | E9 |
Dual-cover := copy of road-cover
In ARCEDIT GET route-cover into dual-cover
For each arc in dual-cover, which originate in route-cover do the following:
Zoom to arc (using select, put and mapextent).
Ask the user to select the road arcs, which the public route in case actually pass.
Verify that the selected arcs did indeed originate from road-cover
verify that the current number of route_id items in dual-cover is sufficient for the next operation.
Generate a list of unique route-id_x values in dual-cover
For each route-id in the list:
In final-cover, delete all arcs which originate from route-cover
Dropitem final-cover.aat final-cover.aat route-id*
3 Handling many project alternatives in a consistent way without redundant data
3.1 The need for consistency versus common practice
3.2 Experiences with alternative management
3.3.3 Scope of the traffic model
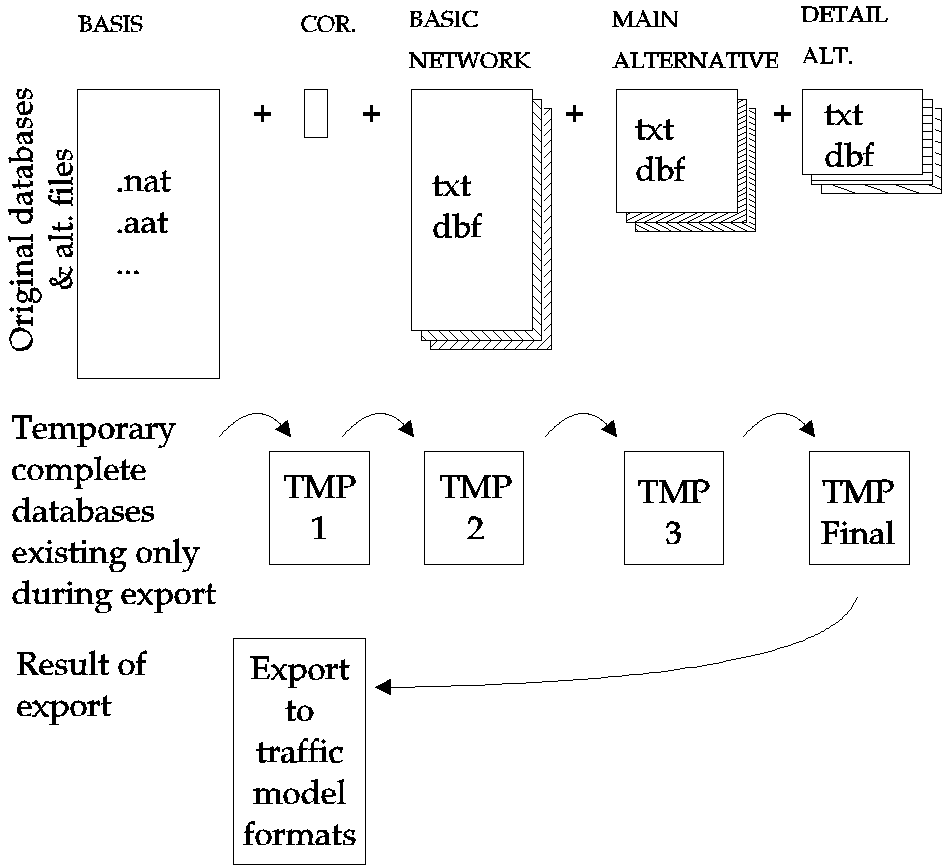
Figure 9: The principle in database operations in the alternative management sytem.
3.4 Visualizing network components
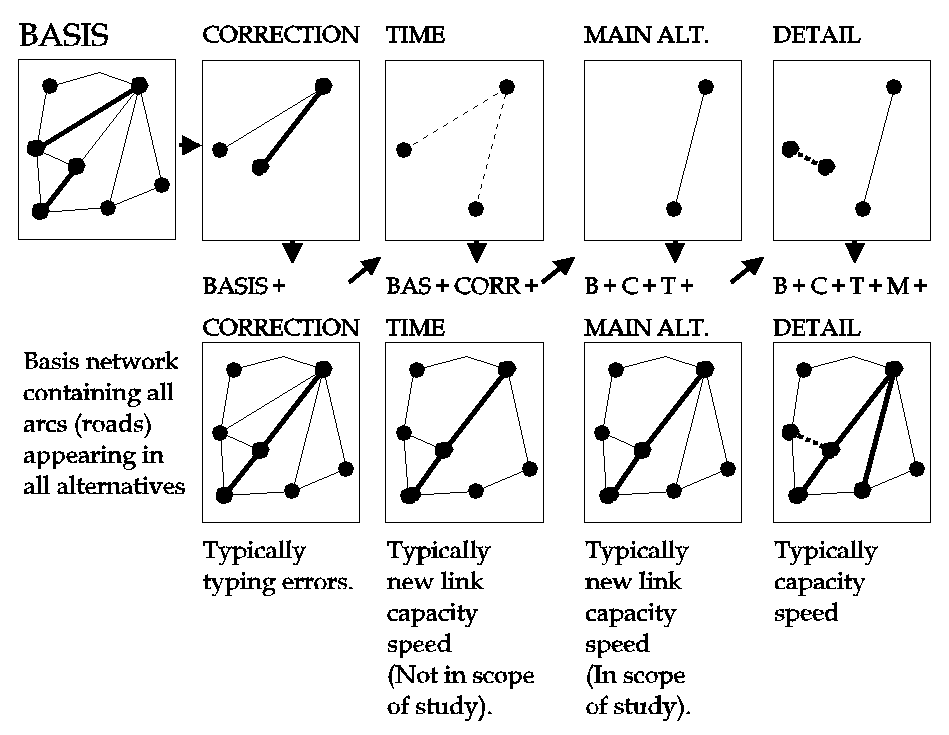
Figure 10: The principle of visualizing alternatives.
The examples in figure 10 does not specify the content of the used legends. This is because multiple thematic legends is imaginable - some of which are:
a) Absolute values displayed.
E.g. number of lanes as color code, speed as labels.
3.5 Creating network alternative databases interactively
4 TRANSLATING (data) from GIS to traffic models
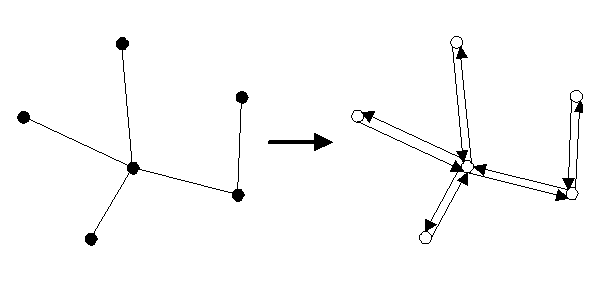
Figure 11: Translating from the GIS-topology to a mathematical graph.
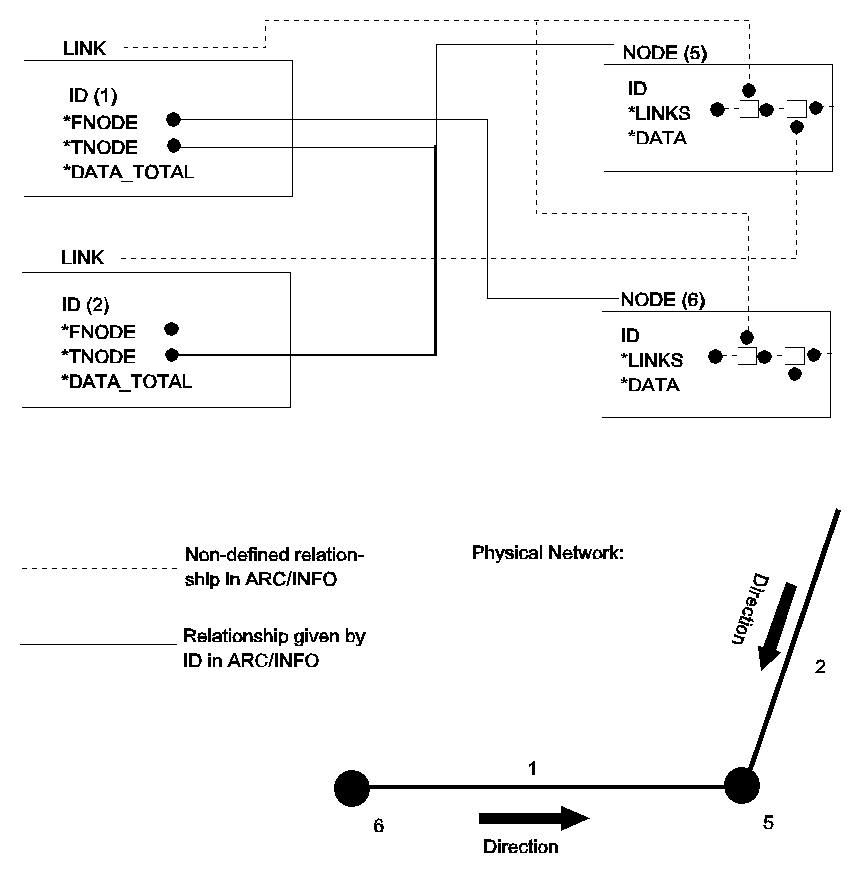
Figure 12: Simple link-node network representation graph.
4.2 Link-node networks, with two directional links
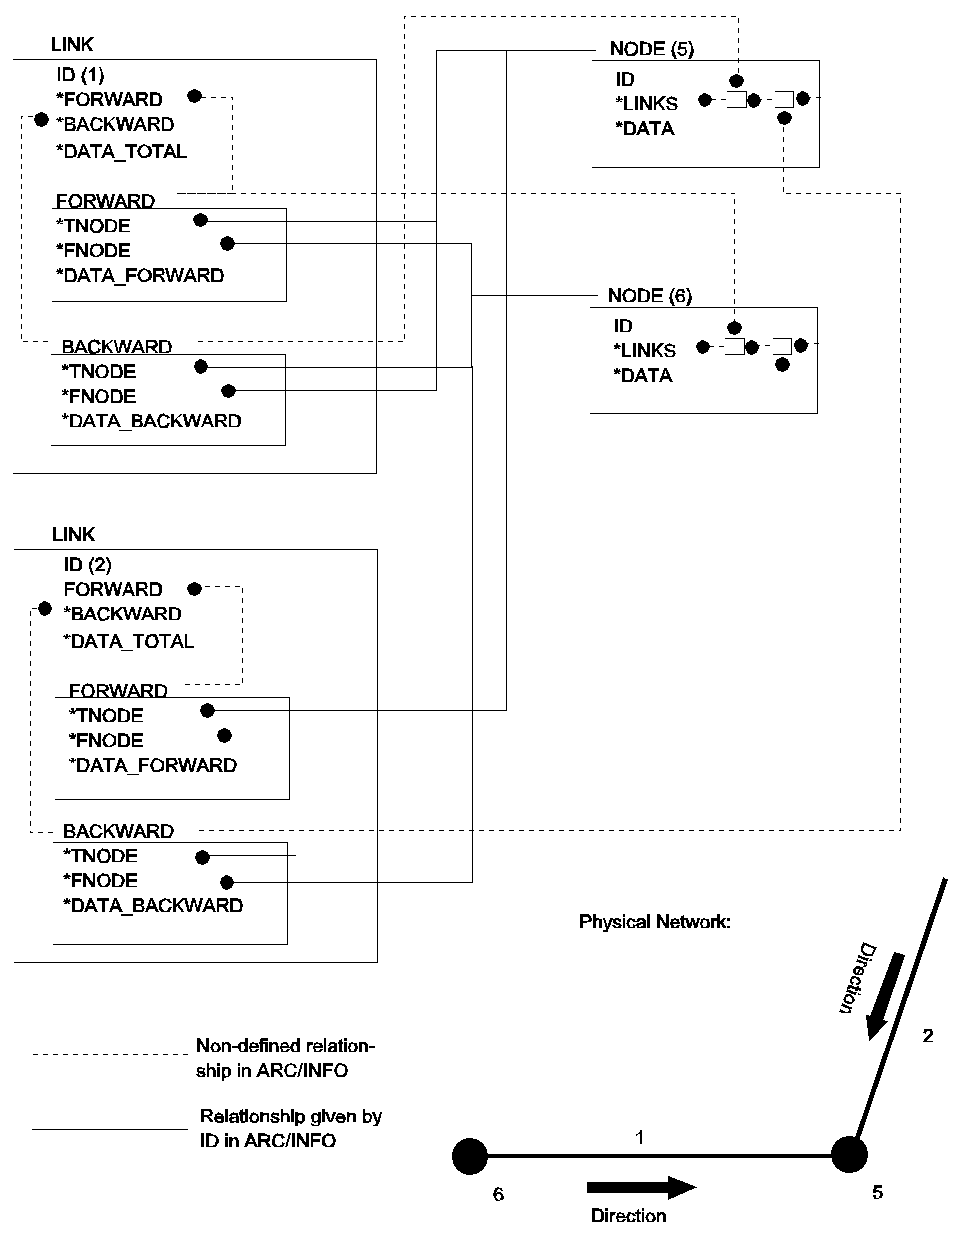
Figure 13: Link-node representation with two directional links.
In this type of network, some of the link data are directional dependent - others not. Therefore, the link data are placed in three structures; DATA_FORWARD, DATA_BACKWARD and DATA_TOTAL. The nodes contain the same information as in the simplest network, although the reference to the links should refer to the forward or backward structures in the link as well.
4.3 Link-Node-Turn network
The next and most complicated type of car network contains an extra topologic element: The Turn. It is recommended to include turns when modeling traffic in urban areas at a operational or tactical level. Even at the strategic level, it can be necessary to model turns. This is especially the case in networks with congestion problems. In Copenhagen up to 30% of the travel time is used in intersections, where the delays both can be geometrical (deceleration, turn, acceleration) and caused by waiting to give way or in queues.
Figure 14 illustrates a graph for this type of traffic network. Each direction of the link (FORWARD and BACKWARD) must refer to all turns leaving the link. The turn structure (TURN) should contain information on which link the turn comes from (FROM), which it is going to (TO) and at which node the turn is located (AT). The turn is defined by type (e.g. straight, left, right or U-turn). This information could be generated semi-automatically as outlined in section 2.3. The nodes should contain information on their ID's, TURNS at the node and node data.
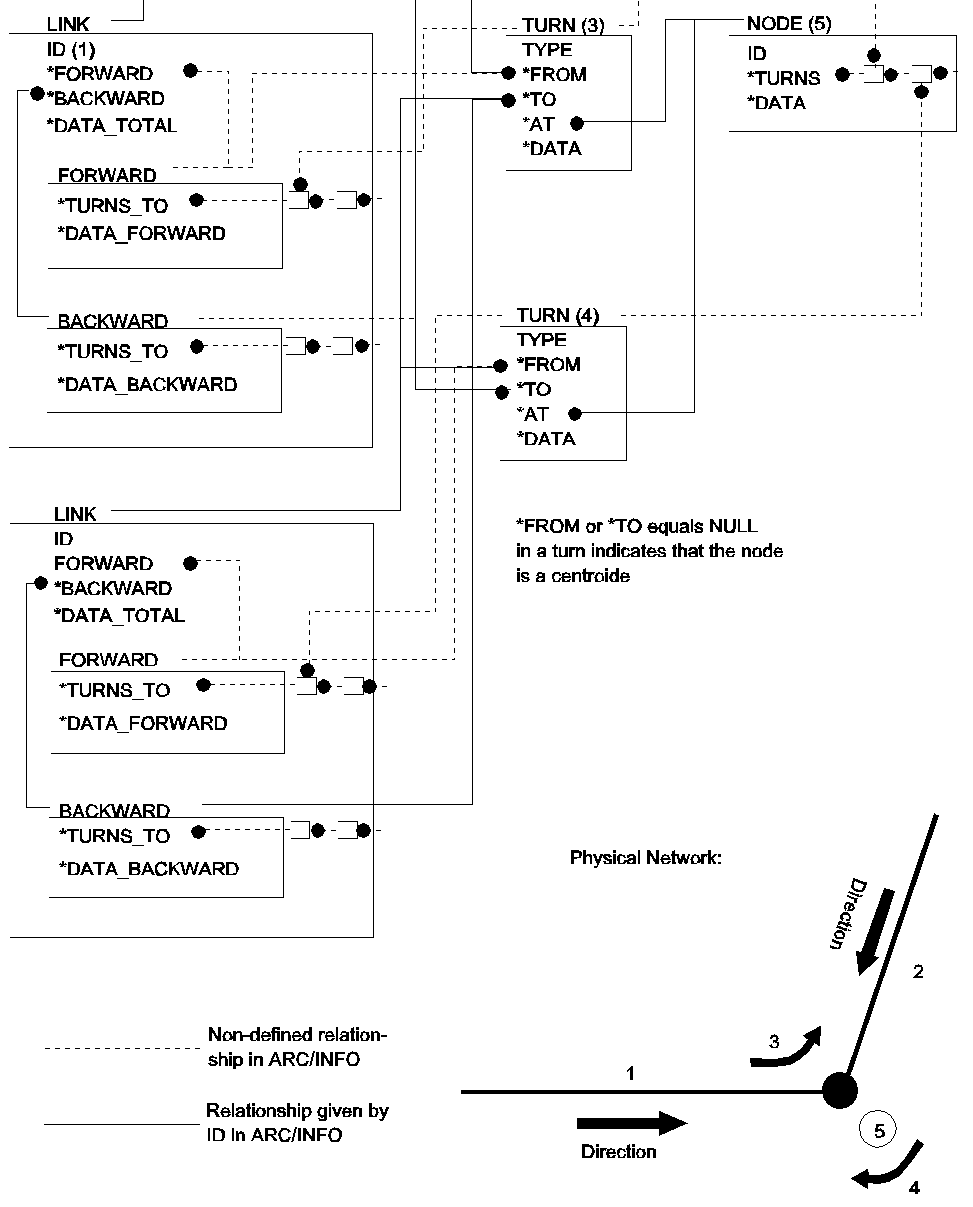
Figure 14: Network representation with turns.
The ArcInfo model contains redundant data on turns: The turn contains information on ARC1#, ARC2# and NODE# and the ARC containing information on FNODE# and TNODE#. Therefore, it is necessary to check the topologic relationship during the network building process. If as an example no turntable is defined for a node, the LINK->FORWARD->TURNS_TO list or LINK->BACKWARD->TURNS_TO list will be NULL for two links. Similar, if no turns are allowed to a road in both ends, it cannot be assessed.
4.3.1 Translating the link-turn-node topology to a graph
Without going into details on the data-structures and
algorithms, the process of building a graph to handle turns are
described in the following, using the intersection shown in
figure 15 as an example. As in the simple link-node topology, the
network is translated to an oriented graph (figure 16)
Figure 15 (left) : F-junction as represented in GIS.
Figure 16 (right) : The road network is translated to an oriented graph.
Hereafter the node is split up into 8 ‘pseudo-nodes’ (figure 17). This split is necessary in order to prevent ‘illegal’ turns in the all-or-nothing algorithm.
Now the turn-table is read and its attributes are attached to each turn, which is represented as ‘pseudo links’ in the intersection (see figure 18). This representation of the node and its turns is mathematically the same as the graph for the simplest link-node network.
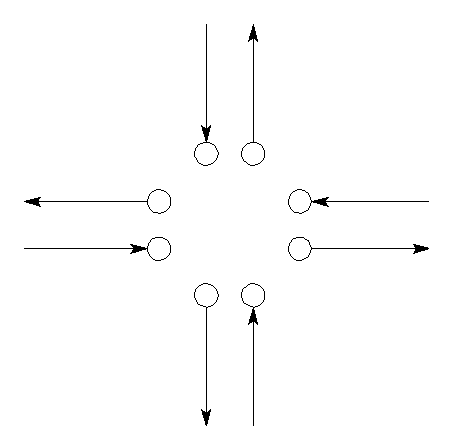
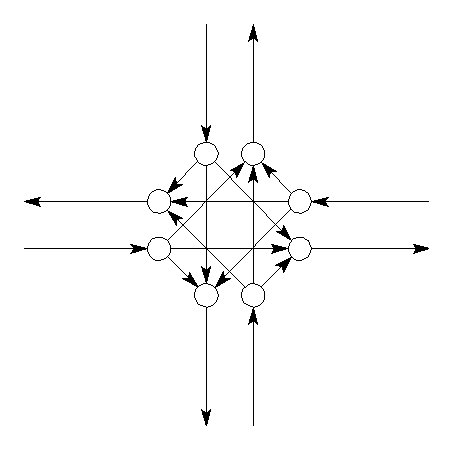
Figure 17 (left) : Node split.
Figure 18 (right) : The final graph for the intersection.
As seen, the graph representation increases the number of nodes by 7 and links by 12. However, the calculation is easier, since well-known all-or-nothing algorithms such as Dijkstra’s can be used. Regarding the calculation-process, the all-or-nothing assignment is done on the graph (where it doesn’t matter if the time and cost relate to a physical link or a ‘pseudo link’ representing a turn in an intersection). Then as part of the algorithm, the travel time of the real links are updated according to a speed-flow curve, while the travel times of the turns are updated by a model for intersection-delays (see figure 19).
Figure 19: Data representation in the assignemnt model.
4.3.2 Node-points of conflicts and the delay model
According to duty to give way to approaching traffic the delay model of the intersection is quite complicated. As it needs to consider the delays caused at all the ‘points of conflicts’ (see figure 20). As a consequence, the turns are ranked according to the duty to give way. As an example, the turns in figure 21 can be ranked as:
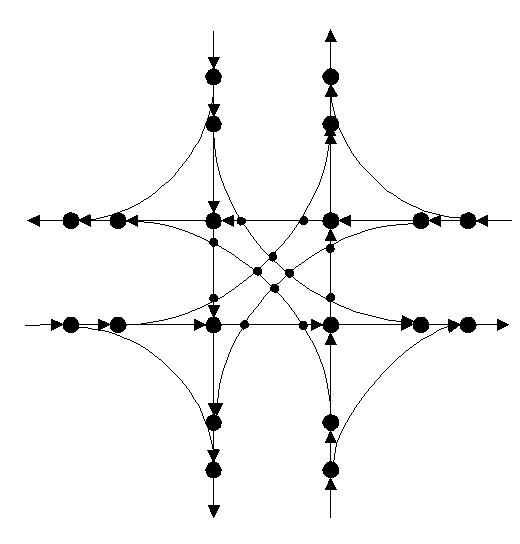
Figure 20: Points of conflict in F-junction.
1. Order: Turn 1, 2, 3, 4
2. Order: Turn 5, 6, 7, 8 (duty to give way to 1. Order)
3. Order: Turn 9, 10 (duty to give way to 1. and 2. Order)
4. Order: Turn 11, 12 (duty to give way to 1., 2. and 3. Order).
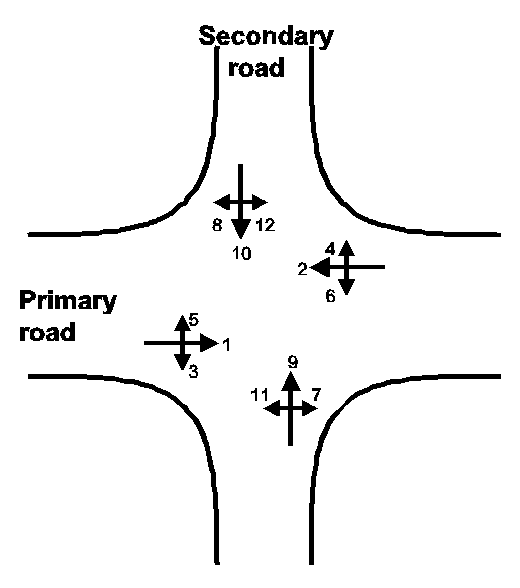
Figure 21: Turns in a F-junction with priority.
The delay-model (see Nielsen et. al. 1997/4) consider:
time prioritized intersection = Deceleration + Queue + Wait for major turn (e.g. at left turns) + driving time at the intersection + Acceleration
time signalized intersections = Deceleration + Wait for green light + Wait for turn while green light + driving time at the intersection + Acceleration
4.4 Translating zone-centroids in a link-node-turn topology
In a link-node topology it is rather easy to translate the GIS-network to a graph. Here, the zone-centroids are handled in the same way as links and nodes. However, in a link-node-turn topology it is much more complicated to handle zone-centroids. If the centroid as an example is connected to a F-junction, it should be connected to all the four ‘pseudo nodes’ on out-going ‘pseudo links’. Otherwise, there would be far too much traffic on one of the turns, which would result in a very large delay at the turn (and hereby break down of most of the flows in the intersection).
The first step in the translation to a graph in the link-node-turn example is to separate all zone centroids from real nodes in the network and then connect them by fictive links (see figure 22).
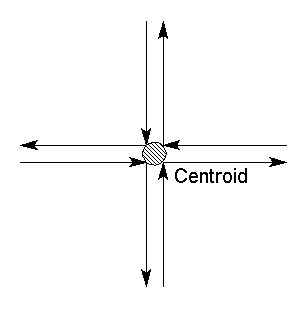
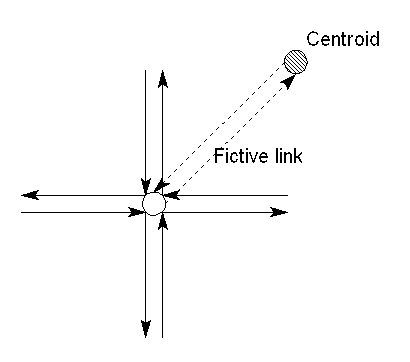
Figure 22: Step one, separating the centroids from the real node and connecting the two by a fictive link.
Then the intersection is split up into ‘pseudo nodes and links’ and these are connected to the centroid - in this case by 8 fictive links (see figure 23, left). Then all entry and all exit links are connected to two temporary nodes (figure 23, right).
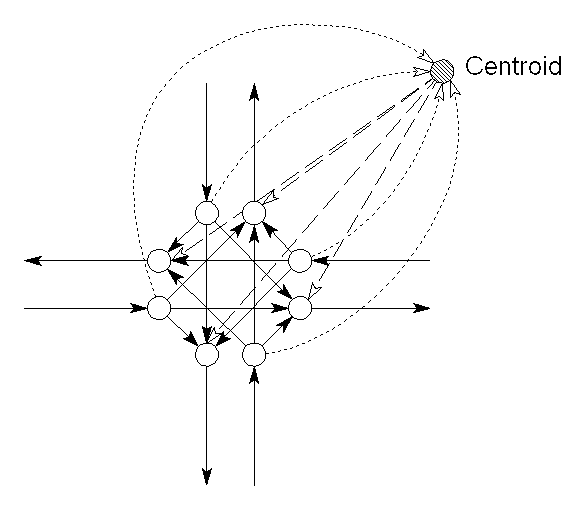
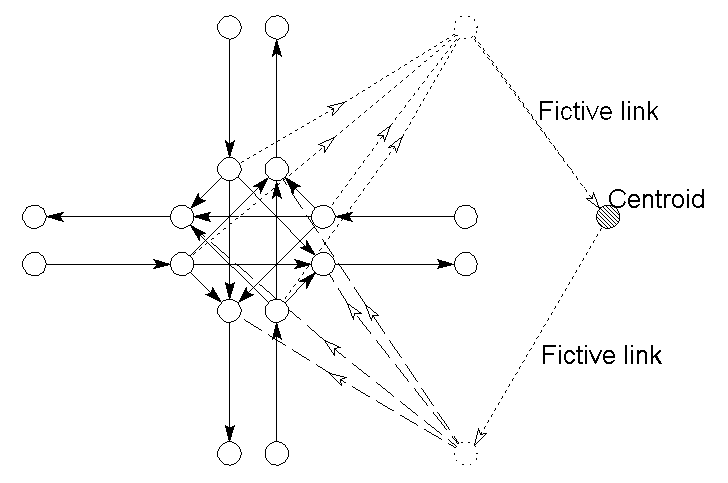
Figure 23: Splitting the intersection into 'pseudo nodes and links'.
Finally the centroid is split into two - one for entry-links and one for exit-links (see figure 24). If this rather complicated process is skipped, the assignment model would assign routes over the fictive links: e.g. to and from a centroid in order to avoid a time-consuming left-turns, or if a centroid is connected to the road network by two fictive links to use these as a shortcut. Of course the path-finding algorithm could be implemented in order to avoid this e.g. by use of some ‘centroids-after-centroids-not-allowed’ logic). However, this would demand time-consuming if-then sentences considering all links and nodes for a problem which encompass only a minor part of the graph.
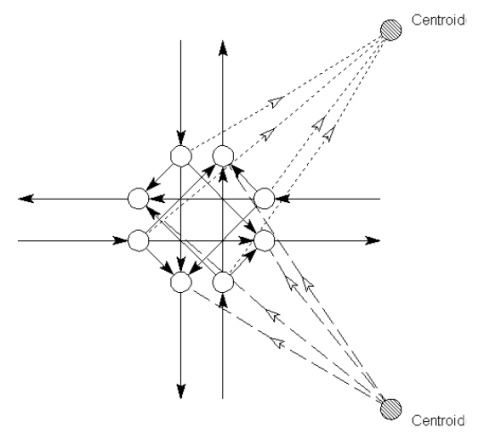
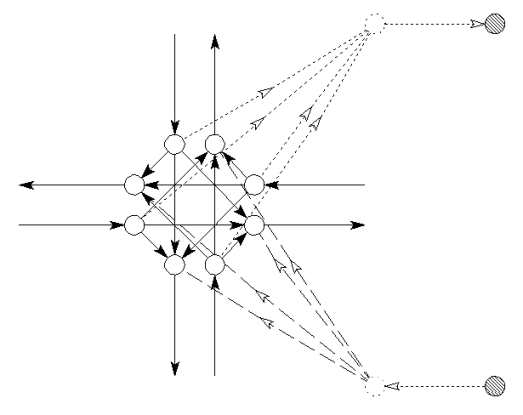
Figure 24: Final split of the centroids.
4.5 Public transportation network
In the following some perspectives are given for handling the most complicated type of network - the public transportation network.
As the public transportation sometimes use the car-network (with links, turns and nodes), it needs these topologic data types (rail switches might be interpreted as nodes and turns). However, between two bus-stops or between two stations, the passengers have no points of access to the bus or train. Such a route segment might consist of many links, nodes and turns in the physical network (opposite the organizational network, where it is one segment). But in the passengers point of view there will be a organizational network of route segments, terminals and changes (a change in the topologic sense might be to stay in the bus or train at a bus-stop or train station).
It could be tempting to model public transportation as the individual transportation by using links, turns and nodes representing route segments, changes and terminals. However, each physical link and turn might contain several route segments, and each turn from one link to another might contain several changes. As an example, the changes from rail line A,B,E and F to bus 5, 7, 10 may go from the same railway track to the same road, but with different changing times, and with different destinations in the network. In addition, the public transportation might interact with the other modes of traffic at each link along a route segment, and the data might be represented at the link level and not at the route segment level, e.g. travel speeds, capacities and lengths as attributes to the many links along one route segment.
Thus, a public transportation network topology consisting of routes, changes and terminals are needed referring to the physical network consisting of links, turns and nodes. Figure 25 illustrates a structure for a public transportation network graph.
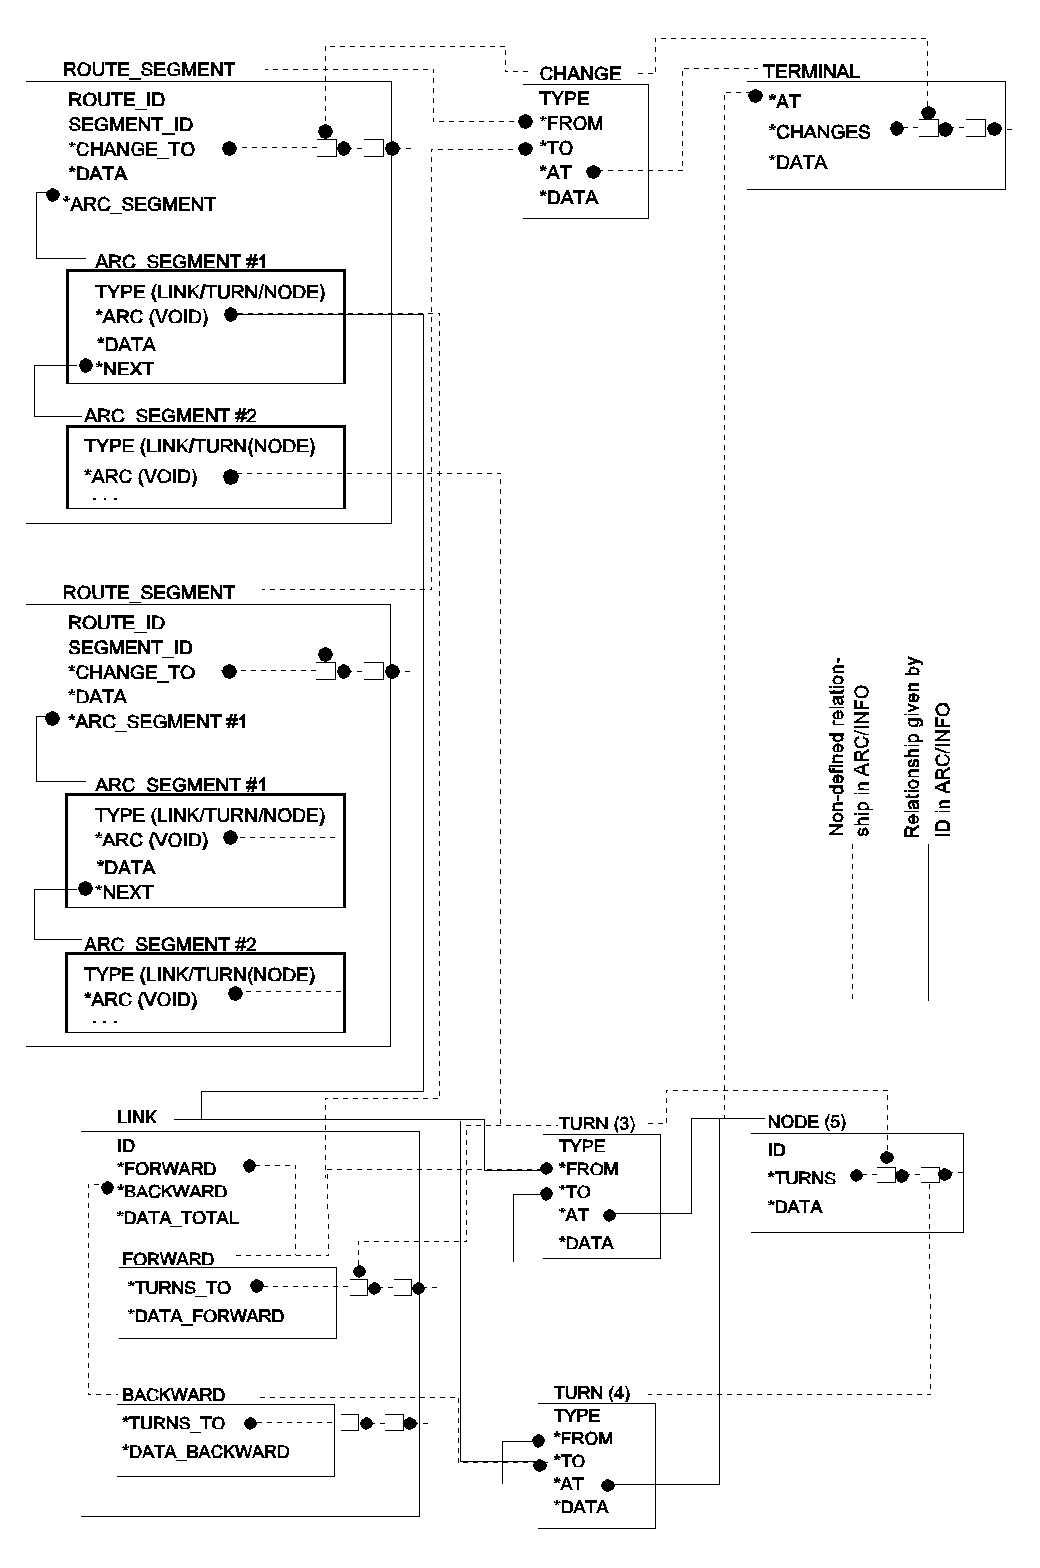
Figure 25: Public transport network graph representation.
The links, turns and nodes are organized in the same way as in the car-network (figure 14).
The ROUTE SEGMENT describes the path going from one terminal to another. Each route segment should contain a ROUTE_ID as well as a SEGMENT_ID. The CHANGE_TO refer to changes at the (forward) end of the route segment (a route should be defined in one direction only). The DATA contains information on the route segment (one might also need a data-structure on the route as a whole).
The ARC_SEGMENTs describe elements along the route. Each element can be of different types, e.g. links, turns and nodes (different routes might need to attach some information on each physical element, e.g. time-tables attached to nodes and flows attached to links). In term of defining a route segment, the ‘physical’ turntables could - in principle - be sufficient to describe the path, but then there would be no way of maintaining unique attribute-data on the links and nodes along the route.
CHANGES are a new topologic data type related to route segments and terminals. Each link can contain several routes and each terminal can contain several changes between routes. The CHANGES attributes might be interpreted from timetables or estimated by using frequencies of the different routes. The changes are defined by the from-route segment (FROM), the to-route segment (TO) and the terminal (AT). The changes can be attached some data (similar to the turn for car traffic), such as waiting time. There is no need for an ID for the change, since it is defined uniquely by the above information. However, there are two main types of changes to be kept in TYPE: To continue at the same route or to change to another route. To follow the first mentioned will typically need information on the stopping time at the terminal, while to follow the second will need information on waiting time to the next mode of transport, including walking time in the terminal, discomfort by changing, etc.
TERMINALS are also a new topologic data type related to nodes, changes and route segments. Each terminal is located at a node (AT) and should refer to all CHANGES at the node. A node can be a terminal for some routes and an ordinary node for others (e.g. through trains, express busses not stopping at local bus stops).
Regarding the assignment model, the route segments simplify the network a bit as they can be considered as a link by the all-or-nothing algorithm. However, in large public transport network with many routes and terminals, the calculation network is much larger than the car-network for the same area of analysis Nielsen, 1997/2).
Unfortunately, ArcInfo can only handle four of the six data types in the proposed topology for a public transportation network: The physical links, nodes and turns and routes described as a sequence of links (by Dynamic Segmentation). Many traffic model packages on the other hand are able to handle public transport networks’ links to the physical networks. Here routes are often described by a sequence of nodes in the physical network (the time table is related to the nodes), while internal logic can connect the route to the physical network as well as calculating waiting times when changing (in principle as a changing-matrix at the terminals). As an example IFP and our partners use traffic models for maintaining public transport network topologies and the GIS for illustrations after translating the traffic model-topology to routes of links (see Nielsen, 1997/2). However, it is a bit of a paradox that one have to use a traffic model to maintain Geographic Information because the Geographic Information System is not capable of doing this! (as pointed out in Nielsen, 1995/2)
4.6 A word on trip matrices
Trip matrices are a data-element which is usually not handled by GIS (except in TransCAD). Thus, it is necessary to maintain the matrices by other software products (e.g. traffic models), and to use these products for editing and analyzing the matrices, for geographical analyses and for different matrix operations. Only the final results of such calculations and analyses can be presented by the standard GIS-packages (again except by TransCAD), e.g. passengers at zone-levels or different zone-based accessibility measures. This is annoying - not only because the difficult work-process - but also because the topologic matrix-node-zone relationships is not maintained automatically (with all the possibilities for errors this can give reason to). Trip-matrices can be very large (e.g. 1,000 x 1,000 elements) which also means that they cannot been handled practically by spread-sheets. Thus, also trip matrices contain a Geographic Information which cannot be maintained by most Geographical Information Systems.
5 CONCLUSION AND PERSPECTIVES
The paper has described a number of applications where ArcInfo and ArcView was used to automate the process of building a traffic network topology. These include:
The methods eased the work process significantly compared with the use of traffic modeling packages. In addition redundant data was minimized and the quality control of data and modeling results improved significantly.
However, the paper also discusses how the GIS can handle the topologic elements needed for many traffic model algorithms. Here, the conclusions are less positive. As an example most GIS - including ArcInfo - cannot handle fundamental elements in public transport networks such as terminals and changes. Thus, it is necessary to use a traffic model to maintain this Geographic Information because the Geographic Information System is not capable to do this! Beside the difficult work-process - which includes the need for several custom-made exchange routines - it is a fundamental problem that the topology is maintained in two different software products because of the many possibilities of errors. Therefore, there is a need to develop GIS further in order to handle public transport networks, trip matrices and other topologic elements needed to describe traffic systems.
In summing up the conclusions it can be said, that using GIS in combination with traditional traffic modeling packages is a great improvement over just using traditional traffic modeling packages. Also it would be just as great an improvement to have a GIS with the data structures necessary for advanced traffic modeling built in.
ACKNOWLEDGMENTS
Rasmus Dyhr Frederiksen and Nikolaj Simonsen (1997) are thanked for their assistance to define and implement the classification method for intersections as well as the assignment model for the link-node-turn topology (see also Nielsen et. al. 1997/4 & /5). Rasmus is also thanked for making the figures in section 2.3 and the other figures with intersections available. The Danish Transport Council is thanked for funding the research.
references
Daganzo, C.F. & Sheffi, Y. On Stochastic Models of Traffic Assignment. Transportation Science. No. 11(3). pp.253-274. 1977.
Frederiksen, Rasmus Dyhr & Simonsen, Nikolaj. GIS-based SUE-assignment with turn-penalties. M.Sc.-thesis (written in Danish). IFP, DTU. January, 1997.
Israelsen, Thomas & Nielsen, Erik Rude. Implementing a traffic model for Bandung using GIS. M.Sc.-thesis. IFP, DTU. June, 1996.
Minieka, E. Optimization Algorithms for Networks and Graphs.. Marcel Dekker, Inc. 1978.
Nielsen, Otto Anker. Using GIS in Denmark for Traffic Planning and Decision Support. Journal of Advanced Transportation, Special issue on GIS Applications in Transportation Engineering and Planning. Vol. 29, No. 3, pp 335-354. 1995/1.
Nielsen, Otto Anker. Using ArcInfo and ArcView for Traffic Planning. 10th ArcInfo European User Conference, Prague, Czech Republic. Proceedings, s. XI-13 - XI-18. October 1995/2.
Nielsen, Otto Anker. Do Stochastic Traffic Assignment Models Consider Differences in Road Users Utility Functions? 24th European Transport Forum" (PTRC annual Meeting), London, UK. Seminar M. 1996/1.
Nielsen, Otto Anker. Multi-Path OD-Matrix Estimation (MPME) based on Stochastic User Equilibrium Traffic Assignment. TRB-annual meeting, Washington,. Pre-prints, Vol. III, 0234. January, 1997/1.
Nielsen, Otto Anker. A Stochastic Traffic Assignment Model Considering Differences in Passengers Utility Functions. Paper to be presented at 8th International Conference on Travel behavior Research, Austin Texas, September 1997/2.
Nielsen, Otto Anker. On the distribution of the stochastic component in SUE traffic assignment models. Paper to be presented at European Transport Forum (PTRC annual meeting), London, September 1997/3.
Nielsen, Otto Anker & Frederiksen, Rasmus Dyhr (TetraPlan Ltd.). Stochastic User Equilibrium Traffic Assignment with turn-delays in intersections. Paper to be presented at the traffic assignment session, Seventh international confer on information systems in logistic and transport, Göteborg, June 1997/4.
Nielsen, Otto Anker & Frederiksen, Rasmus Dyhr (TetraPlan Ltd.) & Simonsen, Nikolaj (Anders Nyvig Ltd.). Using Expert system rules to establish data on intersections and turns in road networks. Paper, to be presented at Seventh international conference on information systems in logistic and transport, Göteborg, June 1997/5.
Sheffi, Yosef. Urban Transportation Networks. Prentice Hall, Inc., Englewood Cliffs, NJ. 1985.
Sheffi, Y. & Powell, W.B. An Algorithm, for the Equilibrium Assignment Problem with Random Link Times. Networks 12(2). pp.191-207. 1982.
Otto Anker Nielsen, Assistant Professor, Ph.D. E-mail: onielsen@ivtb.dtu.dk
Thomas Israelsen, Research Assistant, M.Sc. E-mail: israelsen@ivtb.dtu.dk
Erik Rude Nielsen, Research Assistant, M.Sc. E-mail: erik@ivtb.dtu.dk
Department of Planning (IFP), Technical University of Denmark (DTU)
Building 115, 2800 Lyngby, Denmark
Telephone: (+45) 45 25 15 14. Fax: (+45) 45 93 61 11.