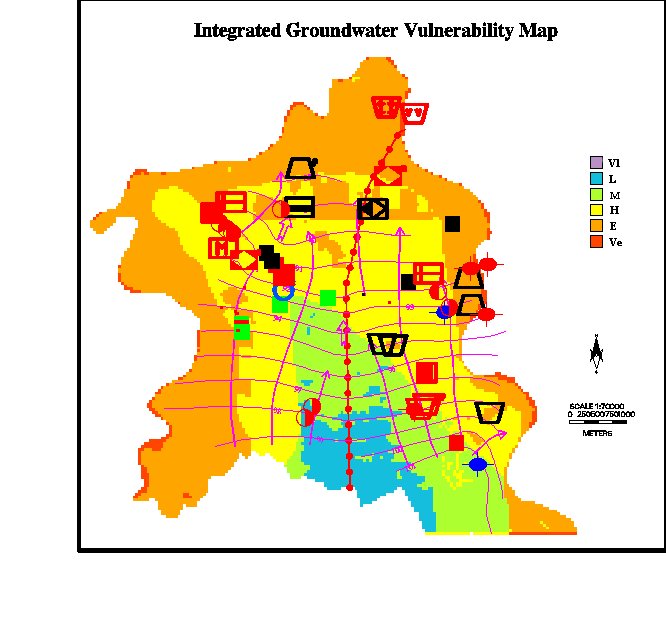
 Figure 1 - Integrated Groundwater Vulnerability Map
This risk is a subject which has been dealt with in depth in many technical sectors. Definitions, though not always univocal, and quantification methodologies of the risk connected to the manifestation of impact phenomena (earthquakes, floods, contamination, etc.) have also been offered in the environmental field. The hazard and the risk are defined in a precise way by Kaplan & Garrik (1981):
H = {<si, ci>} (1)
R = {<si, pi, ci>} i = 1,2, ... , N (2)
In this expression the validity that can be generalised to all scientific ambients, si, represents the description of the scenario of the potential damage, ci, is the quantification of the damage and pi, is the probability of the scenario. It is the hazard that describes a dangerous situation and R is the risk which is closely tied to the probability of the occurrence of the undesired event.
In a system, the scenario is the usually undesirable situation that is relative to the verification of an impact event. A cost (damage) is associated to this. The quantification of the risk therefore results to be tied to the hazard and to the probability of the event occurring.
The common risk expression have been elaborated, at an environmental level, for hydrologic and geologic ambients. The risk is given for both by:
R = Ht D (3)
Where Ht is the probability that is usually associated to the return period T, through the choice of an opportune probabilistic law which accurately interpolates the series of historical data.
D is the damage (or severity of the impact) given by the products by the attitude to sustain damage (Vulnerability) and the value of the goods (subjects at risk).
In the case of groundwater contamination risk the preliminary definitions of the system, event, scenarios and damage are great importance.
Given the complexity of the underground system and the practical impossibility of roughly adopting the mathematical formulas used for the hydro-geologic risk, the approach to the evaluation of the groundwater contamination risk can be basically divided into two types.
The first type considers a territorially limited area and evaluates the contamination risk that a single CSC exercises on a multitude of SAR. The deterioration risk that is of the aquifer thus results to be translated to the tapping work (Civita, 1995) and to the individuals through which the water is supplied. The methods and procedures for the evaluation of the hazard and risk of contamination associated to a single punctual or non-punctual source are by now, numerous and consolidated.
They, in reality, always start from the assumption of a deep knowledge of the CSC as they originated and were developed for the evaluation of potentially very impacting situations for groundwater, in particular for illegal hazardous - toxic waste disposal sites (site analysis, site evaluation - LeGrand, 1964; 1983; Fuller, 1986).
The other possible approach is of a whole country type. The methodology, which is here presented, is the only of its kind as it determines the contamination risk for groundwater whilst taking contemporanly into consideration all the CSC present on the territory. In cases of this kind, the application of the site analysis methodology, which was created to examine single situations, would be too burdensome.
Furthermore, it is necessary to remember that, in the underground system, the variables that identify and quantify the hazard of the event, ad the risk associated to it are difficult to identify.
The risk, in particular, varies to a great extent according to
the characteristics of the contamination sources (type of substance,
initial concentration, time of travel (TOT) from the surface
to the aquifer) and of the natural attenuation capacity of the
system (Civita, 1994).
2 - THE APPLIED METHODOLOGY
The methodology of the evaluation of the groundwater contamination
risk (Civita, 1995) has the objective of territorializing the
risk that derives from the contemporary presence of several CSCs
over the investigation area.
The danger is identified from the existence, or even the potential existence, of one or more CSCs that can determine a contamination event for the groundwater. The contaminativy sources are therefore classified in function of the specific characteristics so that they are attributed a danger of contamination index (DCI). The introduction of the DCI allows one to by-pass the probabilistic evaluation of the contamination events which, in the case of groundwater, cannot possibly be proposed.
It was decided to assume a variability of the DCI from 1 to 9, thus basically maintaining the classification proposed by USEPA (1978) and Mazurek (1979) for industrial activities and to find the points of connection with the zootechnics activities and diffused sources. A classification attempt is proposed in Table 1.
At this stage, such an attempt does not intend to be either complete or omni comprehensive of all the possible situations; it instead has the purpose of allowing an organic discrimination on the sampling area of different potential impact o the groundwater, thus offering an outline for following refinements.
In the classification for industries shown in the table, it is necessary to remember that, in the case where structural protection actions are present (depuration controlled outlet etc.) on non structural actions (internal regulation, incentives, etc.) a reclassification at a lower hazard level is foreseen. Such a procedure reduces the maximum theoretical DCI of a unit.
Furthermore the DCI level shown in the table is the maximum applicable level. This means, that for those industrial activities in which the Mazurek interval is elevated (e.g. printing and similar, synthetic fibres, metalmechanical etc.), the DCI is chosen by the operator not only on the basis of the water consummation and the type of work, but also in relation to the presence of refluents or refuse storage of high potential impact for the quality and quantity of the groundwater.
Furthermore an DCI = 7 is assigned to controlled waste disposals
of the second category B and C and an DCI = 6 is comparable to
USW (urban solid waste) controlled waste disposals.
Table 1 - Classification attempt of the punctual and non-punctual
(diffused) contamination sources, surveyed in the studied test-sites.
| Chemicals and allied products
Petroleum refining and related industies (storage in quantities of toxic and/or harmful substances) | Toxic and/or hazardous unlined waste disposals | |||
| Leather and Leather products
Galvanic technology | Storage tanks of toxic and/or hazardous waste | |||
| Engineering and Metallurgical | USW (or assimilable) unlined disposals | |||
| Paper and allied products
Textile products | Cultivation in nurseries or greenhouses
Cultivation with high chemical support | |||
| Various foodstuffs (drinks, tobacco, sugar, etc.) | Intensive swine, poultry, rabbit, breeding with more than 500 quintals of live breeding weight | Cultivation with limited chemical support and with spreading of swine and rabbit manure | ||
| Food and kindred products | Intensive swine, breeding with less than 500 quintals of live breeding weight.
Intensive sheep/goat breeding and horse breeding. Large pisciculturists | Dumps intercepting the piezometric level | ||
| Intensive cattle with more than 50 units | Heavy traffic highway | Cultivation with limited chemical support and spreading of cattle manure | ||
| Generic farm or wild livestock | Cultivation (fruit, vineyard or seed) with limited chemical support (CEE regulation 2078/92) | |||
| Mountain or hill dumps not intercepting the piezometric level | Grazing
Cultivation that does not require treatments |
2.2.SAR VULNERABILITY
The SAR vulnerability (VSAR) is evaluated as a function of two different factors:
For the evaluation of the intrinsic vulnerability, which constitutes
the description of the passive scenario of the contamination system,
the parameters used in the SINTACS model (Civita, 1994; Civita
& De Maio, 1997) are referred to. The vulnerability level
is thus obtained through an opportune reclassification matrix
of the SINTACS indexes.
Table 2 - Intrinsic vulnerability level of the aquifers
(SINTACS index).
The exposure level permits one to consider the local vector of
the hydraulic gradient on the CSC toward SAR distance. Table 3,
in conformity with the limits foreseen of the zone of respect
in the protection area system, classifies the exposure levels
in function of a TOT of 60 days (Civita, 1995).
Table 3 - Exposure levels of the subjects at risk in function
of the distance of the surrounding CSC (indicative contaminant
flow path) (Source: Civita, 1995)
The SAR vulnerability is obtained (see Tab 4) through a matrix
crossing the intrinsic vulnerability levels and the exposition
levels.
Table 4 - Identification of the SAR (VSAR) vulnerability
levels. (Source: Civita, 1995)
2.3 VALUE OF THE SUBJECTS AT RISK
The value of the subjects at risk (VaSAR) is defined
through two different factors:
In order to evaluate the basic quality of the groundwater resources
one should refer to the classification and mapping proposals prepared
by IRSA-CNR (Civita et Al., 1993). This foresees the classification
of 9 quality classes. Table 5 shows the reclassification foreseen
by the risk methodology (3 classes).
Table 2.5 - Basic Groundwater Resources (GWR) quality classes
(Source: Civita, 1995)
| Water not suitable for human consumption without treatment and limited for other uses | ||
| Water suitable for human consumption but with some limits for irrigation and industrial use | ||
| Water suitable for human consumption and for almost all other uses | ||
The relative or social-economic value of the resource is determined
by the number of users served by each tapping work (Table 6).
Table 6 - Subdivision into relative (social economic) value
classes of the GWR tapping work as subject at risk (Source: Civita,
1995)
| Well, well field, spring that supply or could supply settlements with a population complessively equivalent to > 50000 EI (equivalent inhabitant) | ||
| Well, well field, springs that supply or could supply settlements with a population complessively equivalent to between 50000 e 10000 EI | ||
| Well, well field, springs that supply or could supply settlements with a population complessively equivalent to between 10000 e 1000 EI | ||
| Well, well field, springs that supply or could supply settlements with a population complessively equivalent to < 1000 EI | ||
The evaluation of the values of the subjects at risk is then obtained
by applying a matrix (Table 7) crossing the basic quality and
the social-economic value of the resource.
Table 7 - Definition of the value levels (VaSAR)of
the GWR as subject at risk (Source: Civita, 1995)
| Vr1 | ||||
2.4 CONTAMINATION RISK
The risk map is obtained through a procedure that identifies, cell by cell, the values of VSAR, VaSAR and DCIMAX (see paragraph 4.6) and which assigns the relative risk level to an opportune identification matrix (Table 8) of the contamination risk levels. It was decided to subdivided into 6 risk levels.
Such levels are defined as :
Table 8 refers to the values obtained in the respective input grids for VSAR, VaSAR e DCIM,
Table 2.8 - Identification matrix of the contamination
risk levels
Table 9 - Evaluation of the expected damage (D)
of the subject at risk (GWR). (Source: Civita, 1995)
The following damage values (D) are obtained from Table 9:
Table 10 - Estimation of the contamination risk levels
(R) (Source: Civita, 1995)
From Table 10 one obtains the conclusive evaluation of the risk
as:
3 - CASE HISTORY
The sampled area is situated in Piedmont (Italy) in the Tanaro river valley, south of the city of Alessandria. It consists of the territory between the Bormida and Orba rivers which belongs to the Casal Cermelli and Castellazzo Bomida Municipalities. The area complessively measures about 40 Km2.
The area is basically flat and is prevalently developed by intensive agricultural activities. The cultivations are of a sowable type and are heavily irrigated during the dry weather months, given the high water availability in the area. There are no irrigation canals but instead ditches for the drainage of rainfall water. The main urban settlements are those of Castellazzo, Casal Cermelli and the suburb of Porta Nuova. Complessively, there are 5500 inhabitants. There are many farms scattered in the area, many of which are not connected to the sewage and aqueduct supply systems.
The economy of this area is above all based on agriculture and craftsmen ship. There are only a few small size industrial sites present and also same cattle breeders.
A large communication highway connecting Lombardy and Liguria passes through the area.
The underground of the area between the Bormida and Orba rivers, close to their confluence, is characterised by a sedimentary series that deeps, approximately, from SW to NE. The most recent geologic formations are made up by erosion and deposit phenomena of the main streams.
From a hydrogeologic point of view, the following complexes are
present:
These complexes are difficult to distinguish, in the investigated area, as the sedimentary series is made up of continuos alternating gravel and sands with scarce clay interbedded 1-2 m thick.
For the chemical and piezometric sampling 20 30 m deep wells were used. It is, in fact, not possible to establish whether the interbedded clay levels within the alluvial complex determine the presence of a single multi-layer aquifer or of a multi-aquifer system. The continuity of the lower permeability levels was not identified on the basis of the collected stratigraphies. A interconnection between the various aquifer levels is considered as conceptual model. However all the wells of the studied area taps several aquifer levels, connecting them.
On the basis of piezometric survey, a S-N groundwater flow direction, was shown. In the southern part and at the northern extremity of the test-site area, both the Bormida and the Orba rivers are gaining zone. In the central zone, at least in the part close to the water flows, alternating (gaining and losing) situation have been seen.
The intake area of the aquifer is situated south of the examined area towards the hilly boarders. The isopiezometric contour lines basically results to be uniform, presumably due to the granulometric characteristics of the aquifer, quite similar throughout the area. Two main drainage axes have been identified in this area (see Integrated vulnerability Map, Fig. 1):
One in the central part, almost coincident with the Trecate-Savona
oil pipeline, the other E of the town of Castellazzo. The aquifer
is widely exploited, above all in the areas where the depth to
water is lower (lower costs), as it offer a noteworthy specific
yield.
4.- GIS IMPLEMENTATION.
This type of architecture is extremely ductile as it allows one to elaborate and organise any land information that can be georeferenced. Furthermore it allows one to modify, in real time, information associated to each element (correction or increase). It is obvious that such a possibility is particularly important for all environmental and territorial aspects that are subject to variations in time and which need continuous updating.
A GIS also permits the building, in real time, of dynamic scenarios based on the virtual modifications of the territorial features connected to possible organisation, programming or planning choices.
For this reason it was decided to implement the contamination risk methodology (Civita, 1995) on GIS. This in fact uses extremely variable in time data connected to the land-use and, above all, necessitates the possibility to evaluate the effectiveness of the actions for reduction or prevention of the risk.
The ArcInfo pre-processing of raster data GRID modulus was, in
particular, used. This permits the application of mesh grids that
can be defined by the user on what so ever coverage thus obtaining
a rasterization (land discretization). The information associated
to each cell of the grid is obtained from the element (point,
area or arc) of the coverage that falls within the same coverage
area. In the case where several elements fall within the cell,
the element which covers the largest area is attributed, by default.
The mesh however is always chosen in relation to the scale of
acquisition of the data. In the case under examination (scale
1:10000), a 50 m side mesh was used. This permits one to organise
and elaborate the data with great simplicity. Furthermore it is
in agreement with some methods used in this case(in particular
the SINTACS point count system model used to build the vulnerability
map), for which the Author has specifically foreseen a land discretization
per mesh, both in the data acquisition stage and in the elaboration
stage.
I THE IMPLEMENTATION STAGES
Importation of the basic elaboration and production of the basic thematic maps:
II IMPLEMENTATION STAGES
Land evaluation of the GWR contamination risk (GWR contamination
risk map).
4.1.VULNERABILITY MAP
A Map of vulnerability of aquifers to contamination is a mapping document which describe the specific susceptibility of aquifers systems, in their different component parts and in the different geometric and hydrodinamic situations to ingest ad spread, also mitigating the effects of contaminating or water transmitted fluid such as to produce an impact on the quality of groundwater, in space and time (Civita, 1987). For further information connected to this problem, to the intrinsic characteristics and on the elaboration procedures of the vulnerability maps, the reader should look at the specialised references (Civita, 1994; Vrba & Zaporozec, 1995).
The SINTACS method (Civita, 1990 b, Civita & De Maio, 1997a), completely implemented on GIS (Civita & De Maio, 1997.b) ), was applied in this situation.
In the test-site under discussion the GWR vulnerability to contamination
map indicates a generally unfavourable situation given the scarce
natural protection of the aquifer.
Figure 1 - Integrated Groundwater Vulnerability Map
The vulnerability level increases from south to north in the direction
of the two rivers. The only area with a low level of vulnerability
is situated in the central southern part where a more reduced
permeability horizon determines a certain degree of natural protection.
The areas with very high vulnerability levels are situated close
to the Bormida and Orba rivers, where the reduced depth to water
and the presence of coarse sediment without a soil covering occur
contemporanly.
4.2 - EXPOSITION MAP
The exposition map identifies the areas with the same velocity
(expressed as m covered/60 d) of the groundwater flow in the aquifer
under examination . The real velocity of the water in the porous
medium means is given by Darcy law:
v = (k * i) / nu (4)
where:
v = velocity
k = hydraulic conductivity
i = hydraulic gradients (dh/dl, with linear approximation Dh/Dl)
nu = cinematic porosity
The survey of the areas of equal velocity was obtained using isopiezometric contour map. The distance (Dl) between the isopiezometric contour lines was measured and the piezometric gradient (approximately linear) was calculated.
The homogeneous areas were then mapped and digitized using normal
methods. The elaboration was imported into ArcInfo and the topology
was created. The usual mesh was applied to the thus determined
coverage and it was then reclassified according to Table 3 in
the exposure levels foreseen by the applied risk method. The flow
chart is shown in Fig.2.
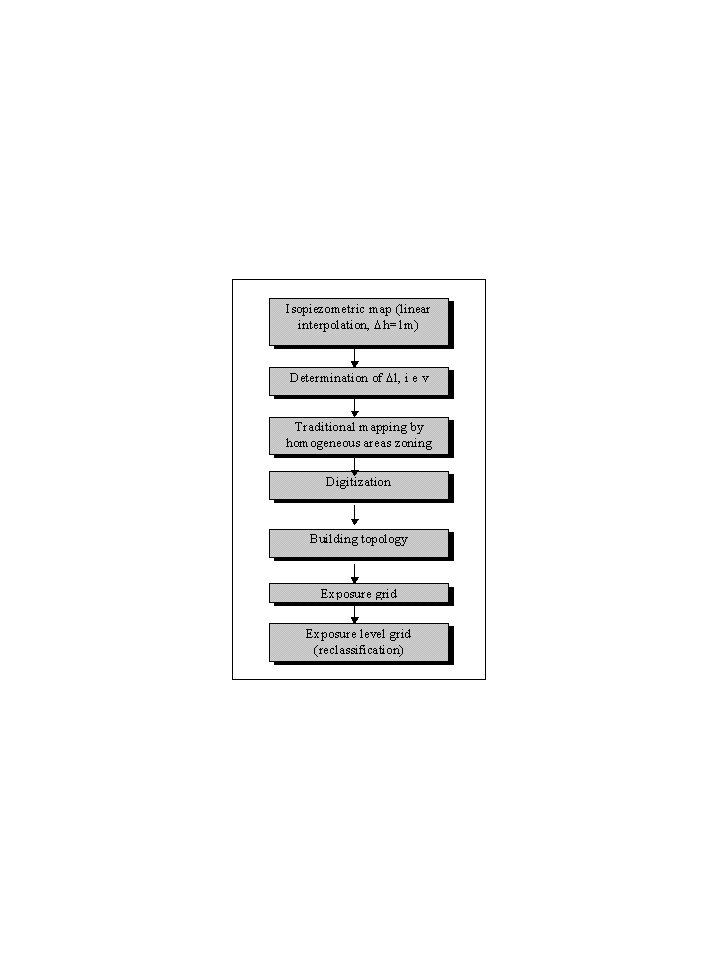 Figure 2 - Flow chart of the exposure map building.
4.3 GWR BASIC QUALITY MAP
The map of the basic quality of the groundwater was obtained in an automatic way. The implemented procedures (Figure 3) foresee the creation of 8 polygonal coverages derived from linear interpolation LATTICEs of the respective virtual surface (TIN), in which the z axis is represented by the relative concentration values.
The TIN made up of point coverages and/or arcs remain inside the simplex figure generated by the triangulation of all the elements that make up the reference coverage. This has determined the impossibility of covering, for the whole studied area, the zones considered with the TIN made up of only water sampling points, as these points are always well inside the said zones. However, the opportune virtual points were identified and extrapolated from the sampling data and these permitted the complete coverage of each studied area. This was possible as sampling data furthest from the studied area are lose to the limits of these areas.
The type of elaboration is analogous to that of traditional technics which always foresees an extension of the isoconcentration contour lines over the limits of the figure made up of the set of triangles on which the interpolation of the survey points is based. Such an elaboration therefore results to be particularly suitable for the proposal of mapping of groundwater quality.
The polygonal coverage derived from the LATTICEs were opportunely
overlayed to identify the quality of the different delimited areas,
according to the parameters considered by the methodology.
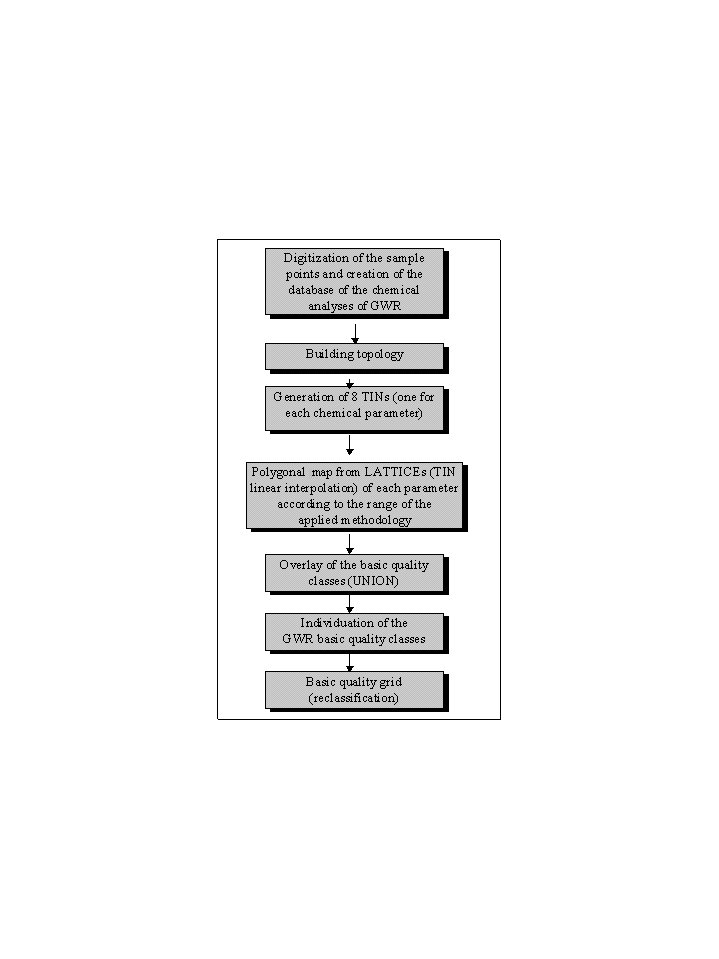 Figure 3 - Flow chart of the basic quality map of the groundwater
Throughout the whole area the use of domestic wells for potable
water supply is very diffused as the aqueducts do not supply the
settlement situated far from the urban areas. This is a working
aspect as the quality of the groundwater is diffusely poor so
that in many cases it is not suitable for human uses according
to the standards of Italian Law.
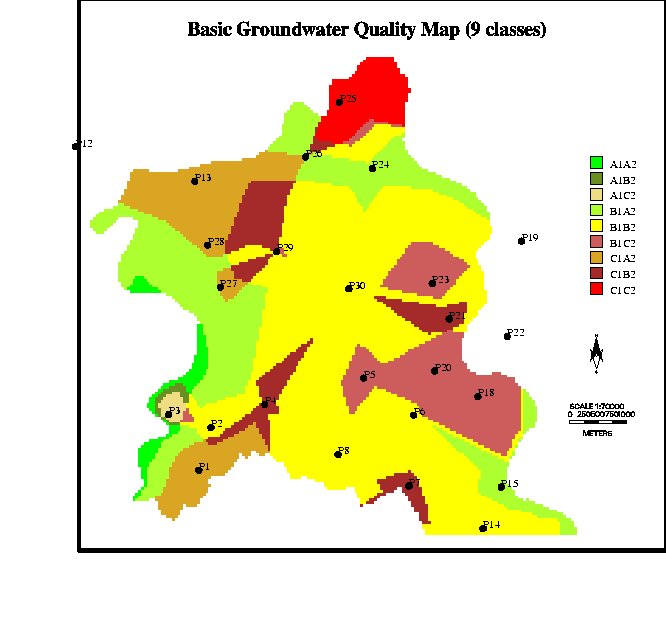 Figure 4 - Basic Groundwater Quality Map (9 ranges)
Many of these domestic water supply sources are therefore exposed to a high contamination load.
The usual mesh was applied to the final synthesis coverage and
it was reclassified to obtain only 3 quality classes ( Optimal,
Medium and Poor).
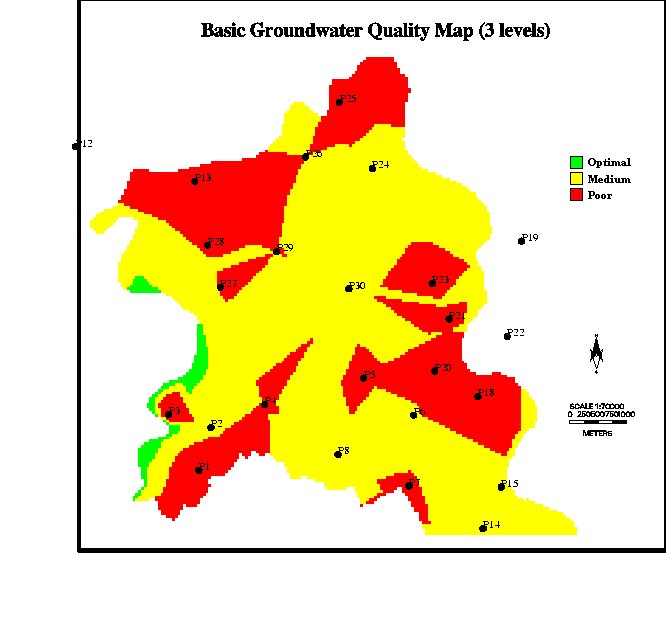 Figure 5 - Basic Groundwater Quality Map (3 Levels)
4.4. DCI MAP
The DCI map was obtained through the digitization of all the potential contaminating sources, (punctual and diffused). In particular, the areas with the same hazard index in relation to livestock activity, civil and agricultural activities were identified and mapped. The thus obtained elaboration was imported into ArcInfo and the topology was build.
The usual mesh was applied to the thus generated coverage in ArcInfo
and the DCI grid was obtained. In this case the automatic application
of the grid procedure to the polygonal coverage was not considered
to be suitable. This application in fact attributes to each cell
the DCI of the largest area present in the covering. This necessitated
the definition of an opportune weight file to attribute the highest
DCI present in the covered area to the cell. This precautionary
choice is suitable as it extends the dimension of the areas to
high DCI before those of lower DCI. The grids obtained with and
without the use of the weight file are shown with non weighted
DCI in Figure 6 and with weighted DCI in Figure 7.
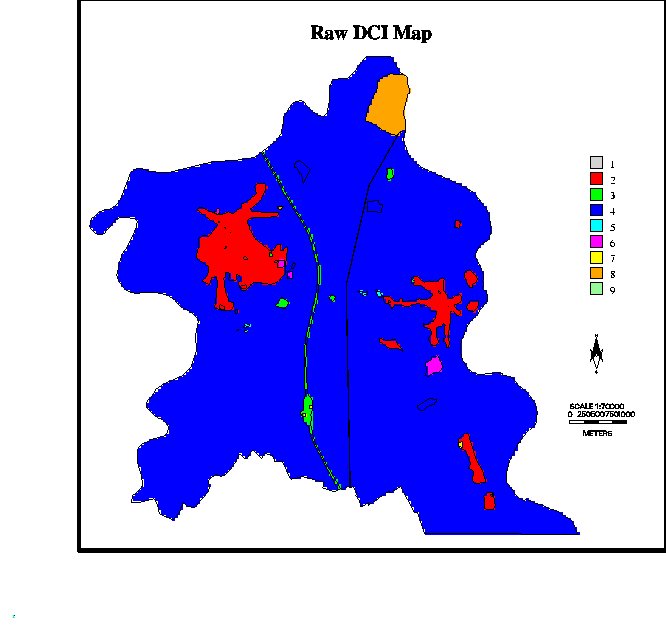 Figure 6 - Raw DCI Map.
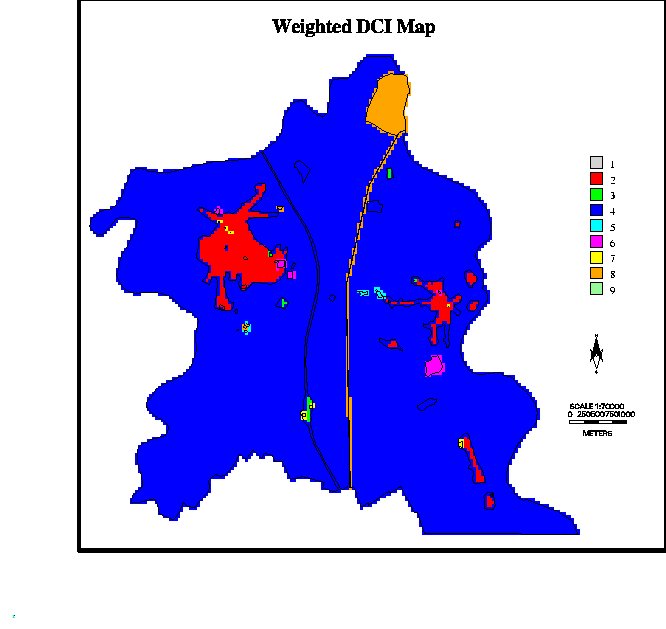 Figure 7 - Weighted DCI Map.
4.5 GROUDWATER FLOW DIRECTION MAP
The flow direction map was obtained in an automatic way. ArcInfo
offers the user the availability of a command (FLOWDIRECTION)
which generates a grid of the flow directions from an input grid.
The procedure is a cell by cell that considers a surrounding (33
cell) for each cell and assigns a numerical value to this cell
in function of the 8 possible flow direction. The 8 direction
are relative to the fact that there are 8 adjacent cell to which
the flow can go. More precisely, the procedure analyses the values
of the input grid around each cell, identifies the minimum value
and assigns a numerical value in relation to the position of the
minimum value.
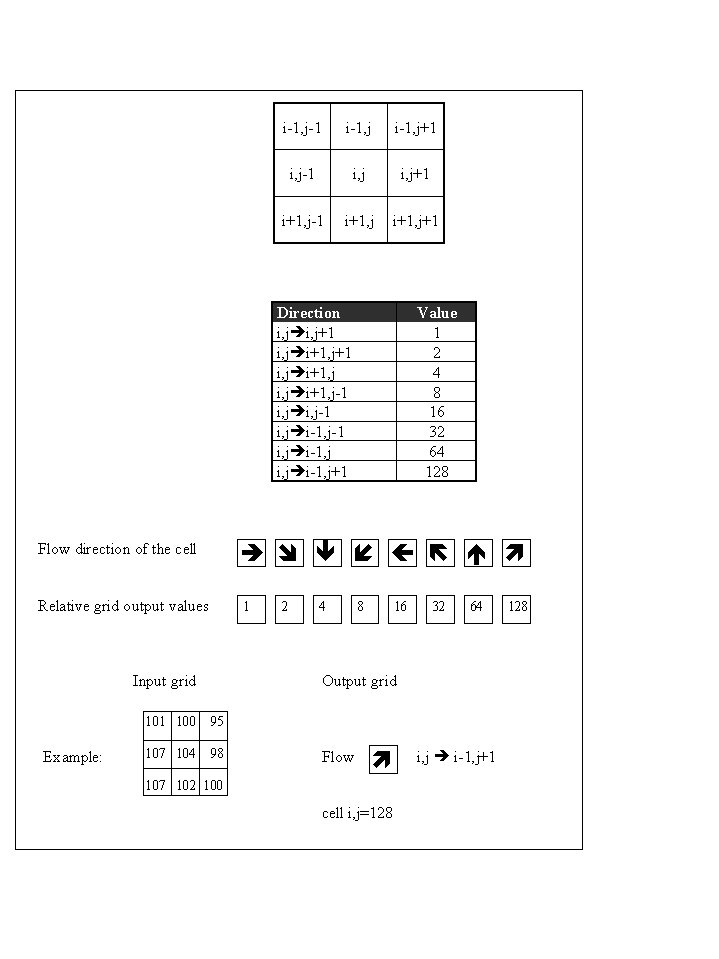 Figure 8 - Construction of the flow direction from an input
GRID.
Figure 8 - Construction of the flow direction from an input
GRID.
The flow direction grid was obtained using the piezometric contour
lines map. The flow directions, for the same characteristics of
the FLOWDIRECTION command procedure, results to be approximate
as they operate on the grids. They however result to be discretized
in intervals of 45°. This approximation is however acceptable
as in this case a land discretization of 5050 m was used.
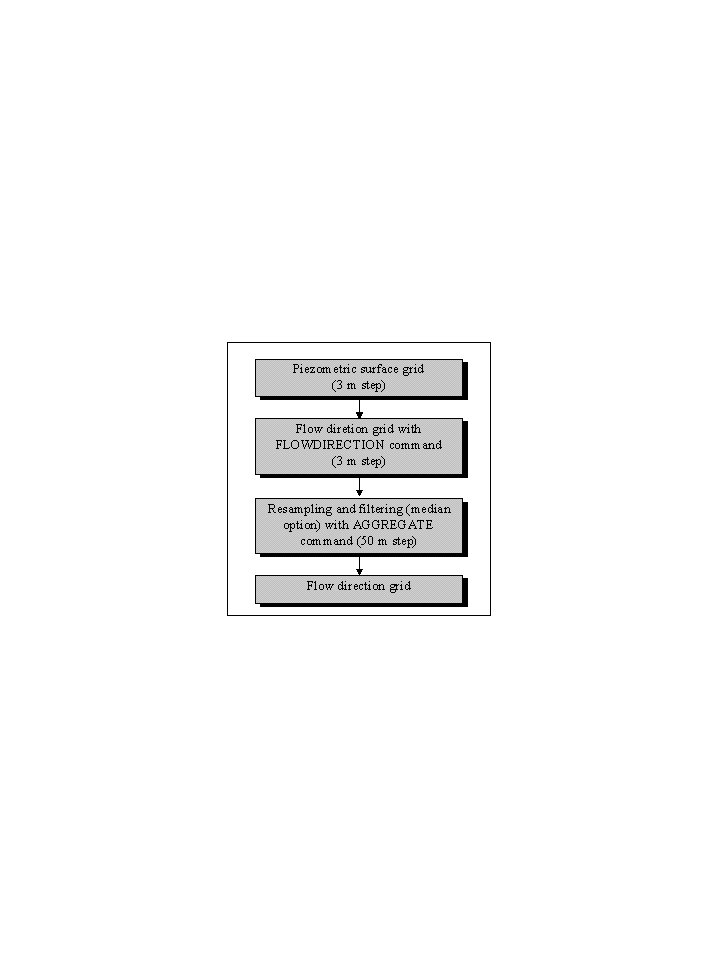 Figure 9 - Flow chart of the flow direction map
The described procedure however creates many border problems. In these situations, in fact, as the cell on the outside of the studied area are identified by NODATA that in ArcInfo procedure assumes zero value.
In many cases this determines the attribution of direction values
that are absolutely wrong. To avoid this problem the FLOWDIRECTION
command was applied to an opportune piezometric grid which was
created with a 5 m mesh. Trying to eliminate the border errors,
the thus obtained grid was then resampled to 50 m and he data
was contemporality filtered with median operator. This permitted
the attribution of the highest frequency flow value of the 100
corresponding cells to each 50 m side cell. The flow chart is
shown in Figure 9.
4.6 GWR CONTAMINATION RISK MAP
The contamination risk map, which is the main objective of this work, is made on the basis of the entrance grids: VuSAR, VSAR e DCIMAX.
The VuSAR grid, which shows the (VuSAR)
vulnerability levels, is obtained from the crossing between the
normalised intrinsic vulnerability grid and the exposure level
grid. The cell by cell procedure, foresees the reclassification
of the vulnerability grid using according to Table 2 and the attribution,
in function of the values read by the grid in input, of the values
deduced from Table 4 to VSAR (Figure 10)
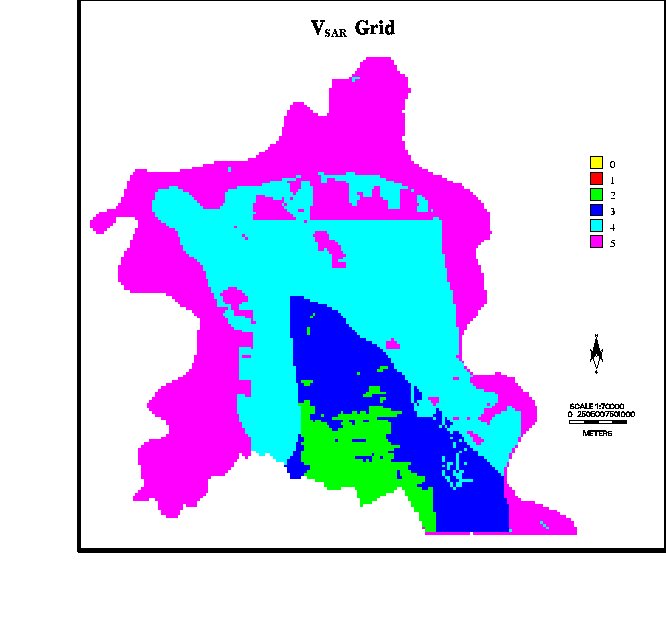 Figure 10 - VSAR Grid
The VaSAR grid shows the GWR (VaSAR),
value levels, intended as the subject at risk. These there are
obtained, in conformity with Table 5, by crossing the basic quality
grid and the social economic value of work of Table 6. The procedure
is analogous with that relative to VSAR (Figure 11).
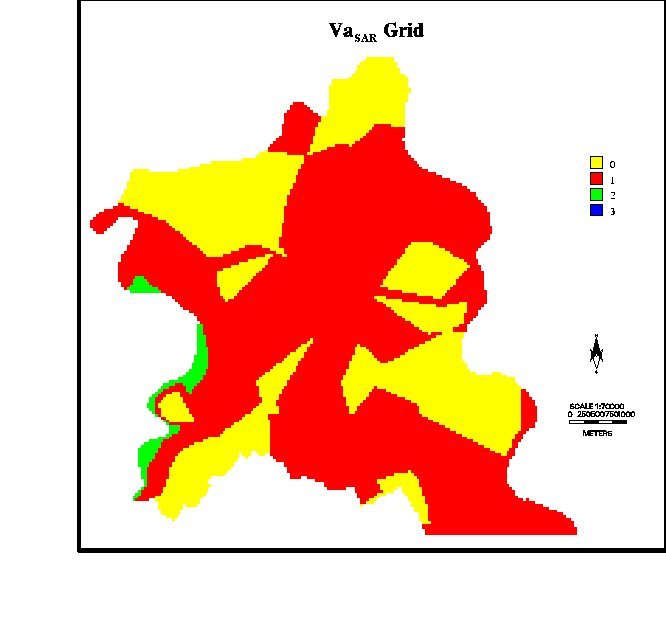 Figure 11 - VaSAR Grid
The DCIMAX grid is instead created in a more complex manner. The first part of this identifies an opportune Kernel to use in the successive elaboration, on the basis of the values of the flow direction grid, cell by cell.
A Kernel is a n*m matrix made up of 0 and 1. This, applied to the cell which must be processed, defines a surrounding with the purpose of identifying the cells which must be considered for the successive elaborations. These cells are found in correspondence to the 1's of the Kernel. The cell that correspond to 0 are, instead, excluded.
The dimension of the Kernel is given by the value of the exposition level. The position of the 1's is, instead, a function of the flow direction.
The cell that is applied is always the central cell. The Kernels
for the exposition and flow direction indexes are here shown for
the groundwater. The whole case history has not been shown as
the Kernels that have not been shown are obtained through symmetry
with the basic ones.
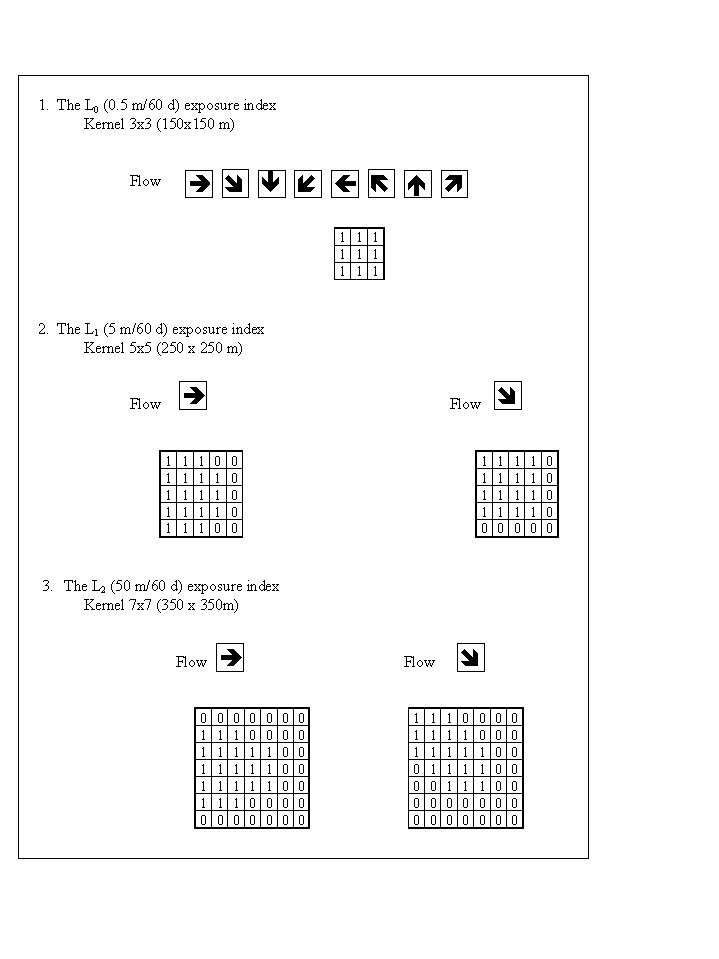 Figure 12 - Explanation of used Kernels: case 1, 2, 3.
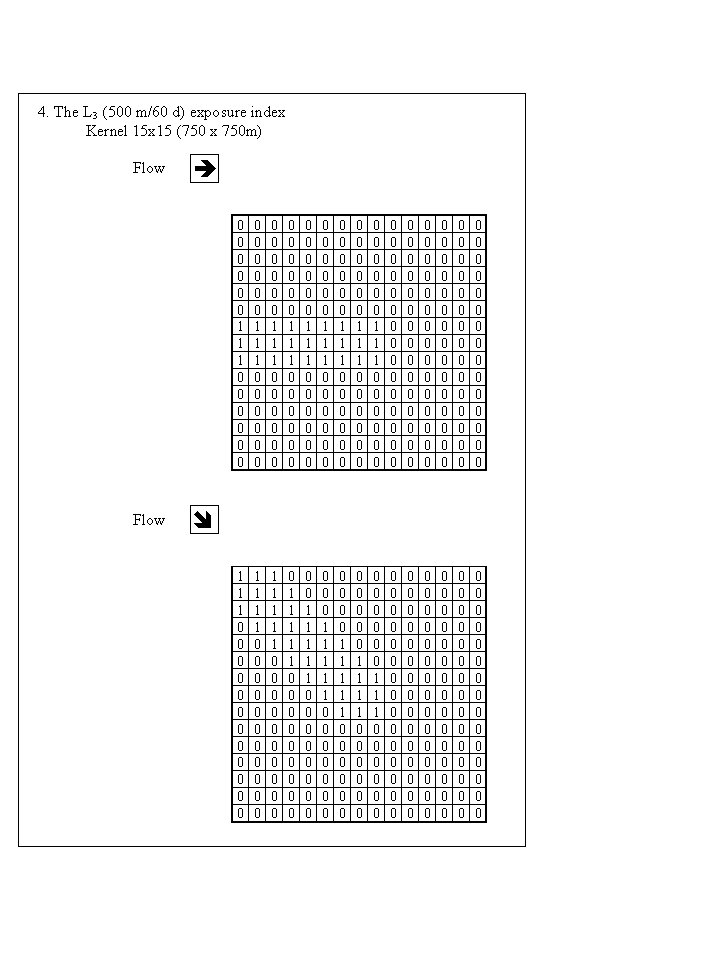 Figure 13 - Explanation of used Kernel: case 4
The second part of the procedure assigns the maximum value of
the DCI grid of the surroundings identified by the Kernel which
was chosen using the previously mentioned criteria, to each cell
of the DCIMAX grid (Figure 14).
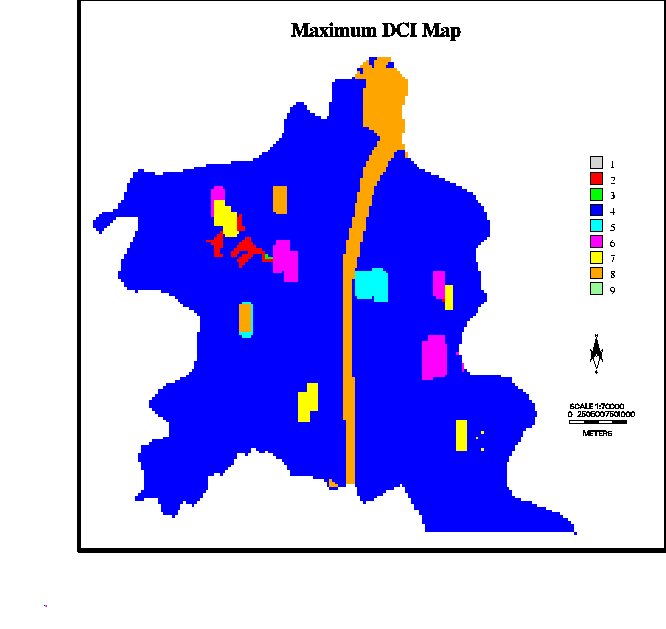 Figure 14 - Maximum DCI Map
The risk map (Figure 15) is obtained through an AML procedure
which identifies, cell by cell, the VSAR, VaSAR
e DCIMAX values and by opertunely crossing them in a function
of the matrix of Table 8 which assigns the relative risk level
to each cell.
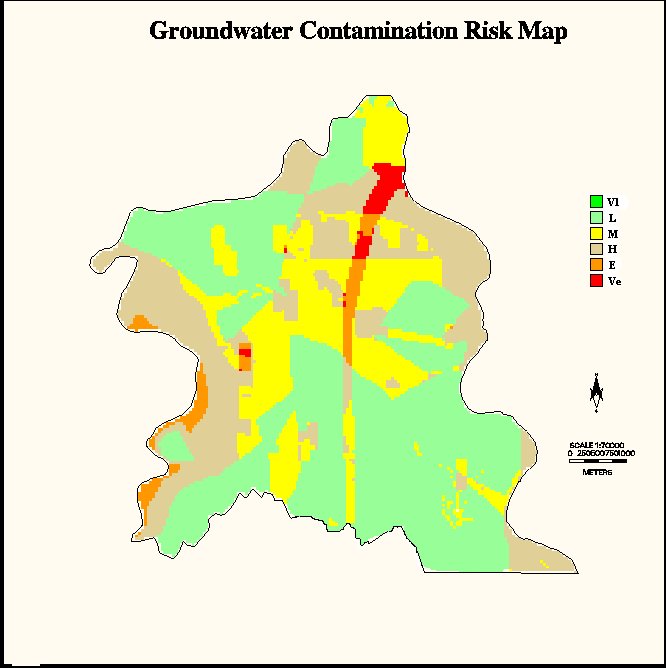 Figure 15 - Groundwater contamination risk Map.
One can notice that many risk levels are present in the same area that range from low (L) to very elevated (Ve). This is, on one hand, due to the fact that there are areas which there are no areas with very elevated DCI (area South of Casal Cermelli and South of Castellazzo) and on the other hand to the fact that the presence of elevated DCI coincides with groundwater of discrete quality determining high risk levels and others with waters of the worst quality that mitigates the effect due to the presence of the DCI. (see Basic GWR quality Map, GWR contamination risk map and Table 8).
The higher risk levels (Ve, very elevated) are found in correspondence to the north section of the oil pipe line, from the point factory S of the concentric of Castellazzo and of the underground fuel stockage (NE of Castellazzo). A very high DCI (8) has in fact been attributed to all these CSC, however the risk results to be very elevated (Ve) only in the area in which, together with an elevated level of vulnerability (E), the basic GWR quality results to be discreet. Where the groundwater quality is poor (see Basic quality of the GWR Map) the risk results to be declassed, in conformity with Table 8. A typical situation is shown in correspondence to the confluence between the Bormida a Orba rivers where the presence of an area with DCI = 8, through the level of vulnerability is elevated (E), only determines a medium risk level. The groundwater in this area are, in fact, of very poor quality.
In the central-southern zone where the vulnerability level is lower (see Integrated vulnerability Map) low risk levels (L) or medium risk levels (M). In these areas, however, it should be noted that the low risk levels are also determined by the presence, in many areas, of a poor quality of groundwater (see Basic quality of the GWR Map).
The remaining part of the studied land instead presents variations
in the risk level that are generally determined by the variations
in the quality of the groundwater as the vulnerability level is
basically uniform (Elevated, only locally High or Very elevated).
5 - FINAL REMARKS
The public tapping works (see GWR contamination risk Map) are however in different risk situation. The best situation has been identified in the area of the well used as an integrative supply for the aqueduct of Casal Cermelli (Porta Nuova suburb) as the contamination risk results to be low (L) even though in the presence of a discreet quality of groundwater.
Different considerations must be made for the well field of the Castellazzo aqueduct and for the Casal Cermelli aqueduct supply well which is situated in the concentric.
In these areas, the basic quality of the groundwater is, in fact, surely at the limit between discrete and poor. However, while the Castellazzo well is situated in a medium risk area (M) or at the most high (H), the Castellazzo well field is in a elevated risk area (E). On the basis of this study, the local administration is planning to build a new withdrawal point built to effectively exclude the first aquifer. It can resolve, however, not only the problems connected to the quality of the water but also those connected to the contamination risk of the aquifer.
For as the domestic wells are concerned the simulation of GWR contamination risk shows that the areas in which the groundwater are not only poor but are even non drinkable are surely not suitable for water supplying for human consumption. It would not be sensible to use the GWR contamination risk map as a discriminating element as the contamination is not potential but is already current. The drinkable use of the groundwater in these areas should always be opportunely advised against or at last, forbidden.
Furthermore, it is not by chance that the only areas in which the quality of groundwater is discreet are classified as elevated risk areas (areas N of Casal Cermelli and SW of Castellazzo) given that the vulnerability of the aquifer is very elevated. No mitigation by the system in the case of a contamination event will be expected . Only a small area close to p15 (see Basic GWR quality map and GWR contamination risk map) which presents a discrete basic quality, is classified with a low risk (L) or medium risk (M).
The studied area presents, in many parts, a vulnerability level
that is so high that only the presence of groundwater of poor
quality permits to delineate level of limited contamination risk.
This would not occur, even in the presence of poor punctual contamination
sources, if the GWR quality should be good.
6 - REFERENCES
Aller L, Bennet T., Lehr J.H., Petty R.J., Hackett G. (1987) - DRASTIC: A standardized system for evaluating ground water pollution potential using hydrogeologic settings. NWWA/EPA Ser., EPA600/287035. 455 p. 11 Maps (with references).
Civita M. (1987) - La previsione e la prevenzione del rischio d'inquinamento delle acque sotterranee a livello regionale mediante le Carte di Vulnerabilità. Proc. Conv. "Inquinamento delle Acque Sotterranee: Previsione e Prevenzione", Mantova.
Civita M. (1990.a) - La valutazione della vulnerabilità degli acquiferi. Proc. 1° Conv. Naz. "Protezione e Gestione delle Acque Sotterranee: Metodologie, Tecnologie e Obiettivi", 3, Marano sul Panaro, 20-22/09/1990.
Civita M. (1990.b) - Legenda unificata per le Carte della vulnerabilità dei corpi idrici sotterranei/ Unified legend for the aquifer pollution vulnerability Maps. Studi sulla Vulnerabilità degli Acquiferi, 1 (Append.), Pitagora Edit. Bologna. 13 p.
Civita M. (1994) - Le Carte della vulnerabilità degli acquiferi all'inquinamento: Teoria & Pratica. Pitagora Editrice, Bologna, 325 p. (with refereces).
Civita M. (1995) - Sul rischio di inquinamento delle risorse idriche sotterranee. Proc. 2° Conv. Naz. "Protezione e Gestione delle Acque Sotterranee: Metodologie, Tecnologie e Obiettivi", Nonantola (Modena), 4, pp. 103-119 (with references).
Civita M., Dal Prà A., Francani V., Giuliano G., Olivero G., Pellegrini M., Zavatti A. (1993) - Proposta di classifica sintetica e mappatura della qualità di base delle acque sotterranee. Inquinamento, 35, 12. p. 8-17.
Civita M., De Maio M. (1995) - L'analisi per scenari dinamici di situazioni ambientali a rischio multiplo di degrado delle acque destinate a scopi potabili. Boll. GEAM 32, 4 (1995), p. 233-238.
Civita M., De Maio M. (1997) - SINTACS: Un sistema parametrico per la valutazione e la cartografia della vulnerabilità degli acquiferi all'inquinamento. Metodologia & Automatizzazione. Pitagora Editrice, Bologna, (in press)
Foster H.D. (1980) - Disaster Planning. Springer & Verlag. New York. 275 p.
Foster S.S.D., Hirata R. (1988) - Groundwater pollution risk assessment. A methodology using available data. Pan Amer. Cent. for Sanit. Engin. and Envir. Scienc. (CEPIS). Lima. 81 p.
Fuller W.H. (1986) - Site selection fundamentals for land treatment.Wat.Res. Symp. N. 13, Land Treat., Hazard. Waste Manag. Altern., Lochr & Malina Edit., pp. 87-99.
Haimes Y.Y. (1987) - Risk assessment for the prevention of groundwater contamination. N.C.R. Stud. in Geophys. - Groundwater Contamianation. 14. p. 166-169.
Kaplan S., Garrik B.J. (1981) - On the quantitative definition of risk. Risk Analysis. 1. p.11-27.
Legrand H.E. (1964) - System for evaluating the contamination potential of some waste sites. Amer. Wat. Works Assoc. Journ. 56, 8. p. 959-974.
Legrand H.E. (1965) - Patterns of contaminated zones of water in the ground. Wat. Res. Research. 1, 1. p. 83-95.
Legrand H.E. (1983) - A standardized system for evaluating waste disposal sites. Nat. Wat. Well Assoc. Wortinghton, Ohio. 2a edizione. 49 p.
Mazurek J. (1979) - Summary of the modified Legrand method. NCGWR Report, Norman (OKL.).
OFRNARA (Office of the Federal Register National Archives and Records Administration) (1994) - Chapter I - Environment Protection Agency - Appendix A: The Hazard Ranking System. Code of Federal Regulation, Protection of Environment, 40 CFR 300.A1, 497 p.
Pfannkuch H.O. (1990) - Application of risk assessment to evaluate groundwater vulnerability to non-point and point contamination sources. Atti 1° USA/URSS Joint Conf. on Envir. Hydrol. and Hydrogeol. Am. Inst, Hydrol. p. 158-168.
Silka L.R., Swearingen T.L. (USEPA) (1978) - A manual for evaluating contaminant potential of surface impoundments. USEPA, GWPB, ODW, 74 p.
USEPA (United States Environmental Protection Agency) (1978) - Surface impoundment's and their effects on ground water quality in the United States A preliminary survey. EPA 570/978004, Office of Drinking Water. 275 p.
Vrba & Zaporozec [Edit.] (1995) - Guidebook on mapping
groundwater vulnerability. IAH, Int. Contrib. to Hydrogeol.,
16 (1994), Heise, Hannover, 131 p.
M.V. Civita full professor of Applied Geology and Hydrogeology at the Polytechnic of Turin, Head of research Line "Aquifer Vulnerability Assessment" National Research Group for the Defence Against the Hydrogeologic Disaster (GNDCI). CNR - DIGET Polytechnic of Turin (Fax: 39 - 11 - 5647643). E-mail: civita@polito.it
M. De Maio Doctorate in Environmental - Geologic Engineering
at Polytechnic of Turin, Research Unit 4.1 GNDCI - CNR - Polytechnic
of Turin (Fax: 39 - 11 - 5647643). E-mail: mdemaio@athena.polito.it.