Introduction |
 |
Christophe Durand, Lionel Loubersac, Jacques Massť, IFREMER, France
ABSTRACT
This paper introduces Ifremer, the French oceanographic research institute and
describes various GIS projects conducted by the institute. Two operational applications
using Esri software are presented in detail : the management of environmental
factors and bivalve aquaculture on the Marennes-Olťron pilot site on the Atlantic coast
of France, and the FishView program used for the evaluation of fisheries resources on
board the oceanographic vessel " Thalassa ".
Based on the experience supplied by these projects, specialized Ifremer teams can now
provide technical, methodological and thematic support to current and future projects
: GIS applications in Ifremer coastal centres, coastal GIS data library,
deepsea exploration survey offline processing.
Introduction
Two operational applications described in detail :
Technical and methodological support to GIS projects
Other GIS projects
Conclusion, references, related links and annexes
Ifremer (Institut FranÁais de Recherche pour l'Exploitation de la MER) is a governmental agency with both industrial and commercial vocations. Ifremer is responsible to the French Government for the promotion of advanced scientific research, technological and industrial development related to oceanic resources and environmental protection, and is particularly concerned with :
the management of large projects requiring close cooperation with universities, research institutes and industries,
the leadership of research and development projects within its own fields of competence,
the management of the national oceanographic fleet and the development of new equipment, techniques and land-based facilities for the French oceanographic community,
international co-operation and promotion of French industry abroad. IFREMER is thus entitled to sign international cooperation agreements on behalf of the French Government and acts as an industrial consultant to private firms.
Fields of activity
|
Budget & personnel
|
Research centres
|
Research vessels and equipment
|
for more information see http://www.ifremer.fr/anglais
Ifremer teams have been using georeferenced data for 20 years with various sources and tools : modelling, cartography, multi-beam sonars, fishing echo sounders, remote sensing data, photographs and video tapes...
Recent developments of Geographical Information Systems (GIS) technology now make it possible to integrate data from several sources. GIS on workstations and moreover on desktop PCs have democratized and standardized the georeferenced data manipulation tools. Data can be managed, analyzed, processed and results presented as thematic syntheses within a geographical referential. Over the past few years, the tools have been used for diagnosis and decision support in many cases involving management of a complex situation.
This type of application meets a growing institutional and social demand for synthetic representation facilities which can present several scenarios for coastal zone planning and management problems. It is an efficient interface between scientific studies and analyses and decision making.
The following operational directorates are involved in GIS projects :
Improved knowledge of ecosystems, the ability to model interactions and the relevance of cost/profit analyses should enable integrated multidisciplinary projects to come together on topics such as:
These approaches require that data be standardized, syntheses be drawn up and that coherent representations of coastal territories be implemented. They also require development of original methods to provide an information system architecture for the coastal area.
Ifremer started using Esri software in 1992 and is now operates 5 ArcInfo licences and more than 40 ArcView GIS licences on Unix and PC.
A dedicated structure has recently been set up to provide technical and methodological support to GIS projects teams
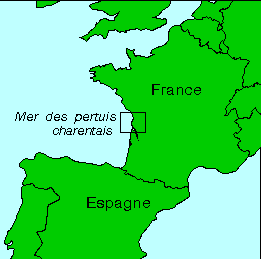
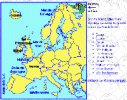
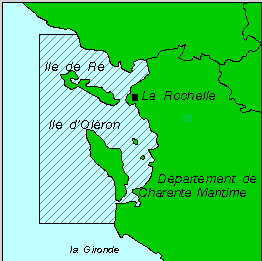
The area of Marennes-Olťron was selected in 1994 as a pilot site for an integrated coastal management project lead by Ifremer : the Sillage project. Three years later, this project led to operational implementation of GIS techniques for environmental factors and bivalve aquaculture management.
ContextThe site of the Marennes Olťron basin was selected because it combines the following elements in a single region:
The main activities in exploiting living resources are found there: top-ranking zone
for oyster farming in Europe, top-ranking zone for mussel-farming in France, development
of new aquaculture techniques on lines and in pools on land, a coastal and estuarine
fisheries zone, zone for catching bivalve spats, spawning grounds for fin-fish species and
fish nurseries. |
|
This area contains the receiving waters for the Charente and SŤvre rivers, as well as
part of the Gironde, whose qualities and quantity have been deeply altered by the
development of farming and industrial activities over the watersheds.
Last but not least, the area is the number one touristic region on the French Atlantic
coastline. Coastal urbanisation, water sports, sailing, bathing and other recreative
activities are growing and increase the potential conflicts with other marine activities.
The goal of the project was to demonstrate the potential of tools and methods using GIS in order to improve the capacity of local Ifremer teams to advise officials and oyster farmers and participate in regional coastal management projects to maintain the ecological balance of the environment.
The Charente-Maritime coastal zone in France has a leading
position in oyster culture production. Yet, it is being jeopardized by a number of
problems such as overstocking, inadequate distribution of culture types, wild stock in
excess, strong siltation processes and potential water contamination risks. Some of these
problems spring from a lack of communication and awareness within the professional
community, others from obsolete management tools.
For more information see [Loubersac
L., Populus J., Durand C., Prou J., Kerdreux M., Lemoine O.]
Data management
The first task has been to identify and evaluate the various sources of information
available from more than 15 organisations involved in coastal data production.
The following table lists the main sources of data
used by the project :
Data name |
Source |
Themes |
Objects types |
Digital |
Projection |
Scale |
BD Carto |
land use, roads, hydrology, Toponymy, administrative limits |
points, arcs, polygons |
yes |
Lambert |
1/100.000 |
|
BD Sigma |
bathymetry, coast line, balisage, wrecks, regulations |
points, arcs |
yes |
Mercator |
1/50.000 |
|
BD PS (photogrametric) |
Detailed tidal zone use |
points, arcs, polygons |
yes |
Lambert |
1/10.000 |
|
Corine Land Cover |
European Union via IFEN |
Land use |
polygons |
yes |
Compatible with IGN |
1/100.000 |
Corine Erosion CŰtiŤre |
European Union via IFEN |
coastline type, defence works |
arcs |
yes |
Compatible IGN |
1/25.000 |
IPLI |
detailed land use |
points, arcs, polygons |
yes |
Lambert |
1/25.000 |
|
Oyster farms cadastre |
leased parcels (CM4) |
polygons and arcs on paper maps |
no |
Local coordinates |
1/5.000 or more |
|
Environment quality networks |
Ifremer |
RNO, REMI, REPHY water quality monitoring networks |
points |
yes (Quadrige) |
geographic |
none |
Protected Zones (ZNIEFF) |
Museum National d'Histoire Naturelle |
ZNIEFF 1 & 2 domain |
polygons |
yes |
Lambert |
1/100.000 |
Bathymetry |
sounds |
points |
yes |
Lambert |
1/20.000 |
|
Halieutic surveys |
Ifremer |
trawls, prospection data |
arcs |
yes |
geographic |
less than 1/100.000 |
Nautical instructions |
navigation regulations publications |
polygons & arcs on paper maps and text |
partial |
Mercator |
variable |
|
Data name |
Source |
Themes |
Objects types |
Digital |
Projection |
Scale |
Fishing and marine aquaculture Regulations |
regulations publications |
polygons & arcs on paper maps and text |
no |
various |
variable |
|
Sea bottom nature |
bio-sedimentary nature of bottoms |
polygons & arcs paper maps and text |
no |
SHOM maps |
1/200.000 |
|
BD LINEN |
granulometry et sediment composition |
points |
yes |
geographic |
variable |
|
Shallow waters sonar |
Ifremer |
bathymetry, imagery |
isolines and images |
yes |
Lambert |
compatible 1/100.000 |
Bio sediments et competitors |
CREOCEAN |
sedimentology and fauna |
interpretation of sonar data |
yes |
Mercator |
1/100.000 |
Hydrodynamics, hydrosediments, hydrobiology |
Ifremer |
modelling data |
grids |
yes |
gťographic |
1/100.000 |
Wetland Atlas |
Ifremer |
land use in wetlands |
paper maps and text |
no |
Lambert |
1/25.000 |
SMVM Sea Blue book |
uses by zones |
polygons & arcs paper maps and text |
part |
IGN maps |
1/100.000 |
|
Aerial photography |
low tide detailed observation |
positives or prints |
both |
none |
1/5.000 to 1/20.000 |
|
Images SPOT |
middle scale observation |
pixels |
yes |
Lambert |
1/100.000 |
|
NOAA data |
CMS Lannion |
sea surface temperature |
pixels |
yes |
stereopolar |
1/1.000.000 |
One of the main issues to resolve for the project was which mapping projection to use. The French national hydrographic and oceanographic authority (SHOM) uses the Mercator projection, commonly used in most marine navigation applications. However, considering the potential users of the system and the links with other data sources, the team opted for the Lambert II projection, even though most of the area being mapped was classed as sea rather than land. Lambert is used by the French National Geographic institute (IGN) and the Ministry of Transportation for its dredging and harbour maintenance activities, particularly for depth surveys.
Other data fed into the database included topographic data at 1:25,000 and 1:100,000-scale geographic object sets (both supplied by IGN), hydrographic data from marine charts, 1:10,000-scale photogrammetric data transformed to the Lambert projection, aerial photography and remotely sensed data.
A large part of the data was only available in paper form and had to be specifically processed :
Various methods and tools were used to combine the data and answer specific coastal management questions.
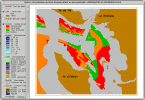
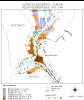
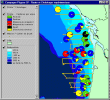
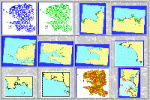
New aquaculture site selection
| By combining geo-referenced data concerning the environment, uses and
regulations, various spatialized indices were used for the preselection of open sea
shellfishfarming areas. The figure shows the areas selected. Experimental farming was
started in 1997 and GIS information is used and collected at the regular site inspections.
For more information, contact Brigitte.Guillaumont@ifremer.fr and read [Durand H., Guillaumont B., Loarer R., Loubersac L., Prou J., Heral M] |
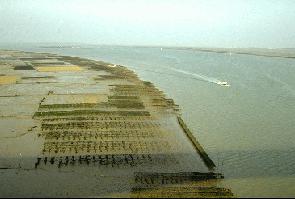
Improved fieldwork
| Fieldwork to monitor the basin has
been improved with the introduction of an ArcView GIS-based data acquisition and
geographic visualisation system aboard the oyster barge that plies the basin. The boat is
fitted with GPS positioning equipment and a depth sounder, which feed real-time data into
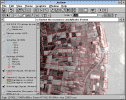
the system as well as user triggered events. Detailed orthophotos, scanned maps,
bathymetry and cadastral parcels can be displayed and a tidal model estimates
the water level in real time. For more information, contact Olivier.Le.Moine@ifremer.fr |
Oyster parcels management system
| Cadastral and orthophotographic data
can be combined to allow stock levels to be assessed for particular areas, and staff can
monitor the leases. Stock assessment is a major issue in this area and Ifremer wants to be
able to identify particular areas using the same cultivation methods. A combination of
black-and-white aerial photography and oyster biomass samples can be analysed to obtain an
overall picture of cultivation in the area. For more information, contact Jacques.Populus@ifremer.fr |
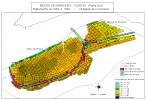
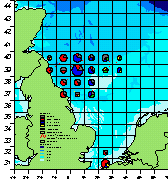
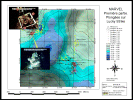
Erosion and sedimentation
| Cadastral data is also
used in conjunction with bathymetric information to calculate the average depth of the
water in each lease parcel. Using data from the system, Ifremer teams have been able to
assess the progress of sedimentation over a ten-year period from 1985 to 1995 (see figure 4). For more information, contact Jacques.Populus@ifremer.fr and read [Populus J., Loubersac L., Prou J., Kerdreux M., Lemoine O.] |
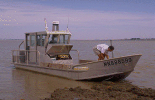
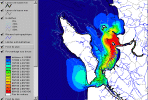
Estimates of dredging operations
| In 1997, local authoritites have funded dredging operations carried out by
contractors under supervision of the local Harbour Maritime Service in the Perquis de
Ronce (see figure 5). The idea was to improve the flush effect of the ebb tide through
channels surrounding some of the banks. The work site width was 50 metres, which meant all
parcels intersecting this corridor had to be removed and their owners granted equivalent
leases in the vicinity. The dredging corridor width itself was only 20 metres. GIS was used to calculate the sediment volume between the present elevation and the projected one. |
For more information, contact Jacques.Populus@ifremer.fr
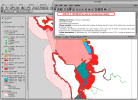
Synthesis of coastal regulations
This activity aims to generate an
information base summarizing all regulations concerning access to resources, areas and
protection of the natural environment. Its objectives are:
|
The current prototype developed for the Pertuis zone in Charente Maritime deals with two cases:
An extension to protection zones (Znieff, ZPS, ZICO, Natura 2000, etc.) is underway on the same site, using the same scales.
For more information, contact Brigitte.Guillaumont@ifremer.fr
FishView : evaluation of fisheries resources on board the oceanographic vessel "Thalassa" |
 |
The division of Living Resources (DRV)
is involved in all scientific studies covering sea fisheries activities.
Research laboratories are located along the French coast and overseas. Their
objective is to collect commercial catch data (landings, size, age, biological data, etc.)
in order to produce the best expertise on stocks and advice for management considerations.
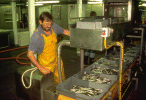
| In 1996, IFREMER launched a new fisheries research vessel : Thalassa. It mainly cruises the Atlantic ocean and the Mediterranean sea. Several new technologies have been chosen to ensure optimal acoustic performances for the ship. | 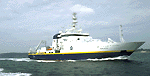 |
Ifremer entirely redesigned the real time data processing software as well as the post processing components aboard Thalassa. The FishView project was a part of this effort, and started in 1996 with the following objectives :
For bottom trawl surveys (North Sea, English Channel, Mediterranean sea, etc.) the area is divided into statistical rectangles in which one or several systematic hauls are carried out. The biomass calculations are performed taking into account the specific catches of each haul.
- automatic importing and display of data acquired during an assessment survey,
- processing the data and producing synthesis results and maps,
- reliance on an "off the shelf" product : ArcView GIS from Esri,
- ease of operation, directly on board or in the laboratory.
During acoustic surveys, fish is quantified along pre-defined transects by measuring the number and intensity of fish echoes, this data is crossed with that from experimental trawls. The total backscattered energy is converted into fish biomass according to specific capacity of reflection. It is therefore necessary to identify echoes by pelagic hauls to estimate the relative proportion of different species. Fishing operations are generally performed each time typical echo-traces are observed [Massť J., RetiŤre N.].
Because of the difficulty in splitting up the total acoustic energy by species, the classification of fish schools or species assemblages has always been a predominant concern. Since classification can't be systematically reliable, trawl samples are still used for mixed populations.
During the survey the following data is acquired on board and processed by FishView :
Fishing data
| The catch is collected in a trunk and processed in an
automated fish room. The fish is weighed and all or part of it is sorted by species and
measured. FishView imports the following information from the ship sensors : |
 |
Planktonic nets are also used to evaluate eggs and larvae as well as nutrient abundance in the areas studied.
Acoustic data
| Acoustic data is acquired using echo-sounders and processed with an
Ifremer specialized software called Movies+. FishView imports the following information from Movies+ files :
|
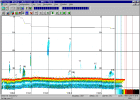 figure 7: Movies+ screen |
Hydrographical measurements :
| During the cruise, salinity and temperature measurements and samples are
taken at different locations. Usually the water column is sampled every metre. Thalassa also operates a thermo-salinometer which measures the surface temperature and salinity, every 10 seconds. |
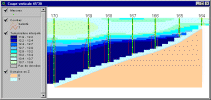 figure 8 : temperature and salinity vertical profiles |
Mission description data :
An electronic scientific logbook called CASINO is used to store all the cruise information. It runs the following functionnalities:
- automatic acquisition of relevant parameters for the cruise,
- automatic acquisition of events sent by the bridge electronic logbook,
- acquisition of the events entered by scientific operators,
- visualization in real time of the acquired data,
- recording of events on magnetic disk (UNIXģ file),
- post-processing editing to delete, modify or add records,
- translation into Microsoft EXCELģ format of all or part of the scientific logbook.
On Thalassa, more than 60 parameters can be recorded : ship position and bearing, meteorology, physical parameters, trawl geometry, winches... This data can be loaded as a point theme in FishView and these attributes used to map specific events or parameter evolution.
FishView is implemented as two ArcView GIS Extensions : FishView and FishView Spatial which requires Spatial Analyst and can be used to performed data interpolation. These extensions add new menus and buttons to the ArcView interface.
FishView fonctions are grouped into four families :
Data importing :
A single button activates automatic importing of the new data acquired by the cruise. This function provides easy updating of synthesis maps as the cruise progresses. Dtat is converted into tables and geographic coverages in ArcView Shapefile format.
Data display :
FishView can display cruise data in interactive views and automatically handles the creation of links and joints between tables when necessary.
Data processing :
Many "push-button" processing fonctions have been adapted to scientists' needs and integrated into FishView :
Fishing
|
Bathysonder
|
Echo-integration
|
General
|
Cartographic outputs :
FishView relies on standard ArcView functions to produce printed maps including legends, scales and comments.
Preliminary versions of FishView were used in May 1997 during the Pegase 97 survey in
the Bay of Biscay, and in February 1998 during the IBTS 98 cruise in the North Sea.
The final version of FishView will be used during the Pegase 98 survey in the Bay of
Biscay from May 20th to June 9th 1998.
PEGASE 97
The PEGASE survey used acoustic methods to analyse the horizontal and vertical distribution of adult pelagic fish in order to understand how anchovies share space with other pelagic species by describing aggregation strategies. Anchovy adults and larvae were collected in order to compare their physiological state with the environmental conditions. The objective was to analyse factors which could be responsible for recruitment variability.
Acoustic data was collected along systematic parallel transects perpendicular to the French coast. The length of the ESDU (Elementary Sampling Distance Unit) was 1 mile and the length of the transects depended on the fish distribution detected by acoustics and fishing. Transects were usually uniformly spaced every 10 nautical miles.
A midwater trawl was used to identify echo-traces each time they changed.
| FishView was used during the survey to produce daily survey maps, process echo-integration data and finally to produce biomass estimates per species. |
|
For more information about PEGASE 97, contact the survey
supervisor Jacques.Masse@ifremer.fr
and read [Massť J.]
IBTS 98
This cruise was part of the International Bottom Trawl Survey (IBTS) program whose objectives are :
The North Sea has been divided into rectangles of 30 minutes of latitude and one degree of longitude. The haul duration is constant (30 minutes), the gear is standardized and each square is sampled by two or three participating countries.
| The results are sent to the International Councils for the Exploration of
the Sea (ICES) and are widely used in the assessments of several North Sea fish species
and for various other purposes. FishView was used during the survey to produce cruise maps including pie-charts of fish catches, temperature and salinity, as well as the distribution of fragments of garbage (plastic, glass, ropes, etc.) collected during the trawls. |
|
For more information about IBTS98, contact the survey supervisor Yves.Verin@ifremer.fr
The GIS projects have highlighted the need for both methodological and technical support for teams. This was originally achieved by combining thematic specialists and GIS technical staff on the same teams.
Since late 1997, based on the experience acquired in these projects, specialized Ifremer teams from the "Operational Application Service" of the Coastal Environment Directorate (see http://www.ifremer.fr/delao) and the Engineering, Technology and Information Directorate (DITI) can now provide methodological, thematic and technical support to current and future projects :
An Intranet WWW site dedicated to GIS has been recently created. It contains information and links for :
Methodology research has been mostly maintained on the original pilot site of Marennes-Olťron where environmental quality issues are being explored. This includes various data information layers such as :
| The communication between these databases and those produced by
hydrodynamic models will help identify potential risks and environmental impact, useful
for decision makers. for more information see http://ifremer.fr/delao - Illiade project |
|
Over the past three years, GIS projects have been developing rapidly. The following projects are a selection of the latest GIS-related activities.
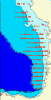
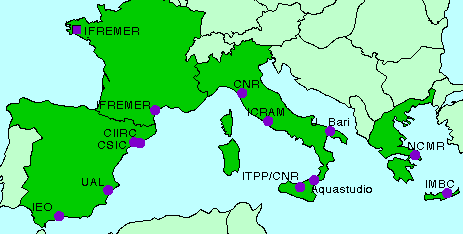
GIS applications in Ifremer coastal laboratoriesThe 17 Ifremer laboratories located on the French coast provide advice some 300 times per year to the community of actors and users of the coastal zone : local and state administrations, professional syndicates... They rely on bio-physical information, modelling, as well as land uses and regulation data. Their needs range from a fast data base query to the production of simple or more advanced maps. The initial challenge of this project is to gather a coherent and easy to use data base including classic coverage from IGN and SHOM as well as data created by Ifremer about inter-tidal zones and shallow waters. The second challenge is to bring GIS tools into operational use in these small
structures. ArcView has been selected as the GIS software package and will equip all the
sites soon. Support measures include training sessions on ArcView, GIS and mapping, remote
user assistance and further sessions on site. for more information see http://ifremer.fr/delao
- Pastis project |
figure 11 : coastal laboratories locations |
FIGIS - FAIR european projectThis project is essentially aimed at developing the space and time analysis of
resources exploited by Mediterranean fisheries. It focuses on two approaches which give
priority to the spatial component: interactions between resources and environmental
factors and interactions between fishing fleet dynamics and the policy system. Contact : Gildas.le.Corre@ifremer.fr |
Partners of the SPAIN FRANCE ITALY GREECE |
Coastal GIS data libraryMany users at Ifremer need geographical reference data to map their research results. An intranet service was set up by the SISMER service in 1996 to distribute coastline and bathymetric data in various graphical formats. This service has been recently extended and now distributes coastal zone data produced by Ifremer and market data from IGN, US-NGDC, IFEN and SHOM for which global user licences have been negociated by SISMER. the SISMER service (SystŤmes d'Informations Scientifiques pour la Mer (http://brest.ifremer.fr/sismer) designs and operates scientific information systems and databases for national and international projects in the marine domain Ifremer also operates an Intranet photographic library containing more than 10,000 pictures. Contact : Michel.Bellouis@ifremer.fr |
|
Deepsea exploration surveys post-processingThe goal of this project is to provide tools to help scientists display and process
data gathered during the dives of two underwater vehicles operated by Ifremer : Victor 6000 and Nautile. All these tools will be available at sea during field trips. This means data can be worked on immediately following a dive. The tools will also be available in scientific labs and it is thus possible to work on the complete cruise data and video set. Contact Fabrice.Lecornu@ifremer.fr |
|
This paper covered a brief presentation of Ifremer's GIS activity which is growing steadily. Support teams, training sessions on ArcView, mapping and methodology will facilitate GIS development at Ifremer.
However, the number of projects should not mask the obstacles ahead : GIS projects are still viewed as being too complex. They do not require just data, computers and tools, but also skilled personnel, organizing, methods and above all : Time.
[Diner N.,Marchand P.], 1995 - Acoustique et PÍche maritime - Editions IFREMER
[Durand H., Guillaumont B., Loarer R., Loubersac L., Prou J., Heral M], 1994 " An example of GIS potentiality for coastal zone management : pre-selection of submerged oyster culture areas near Marennes Olťron (France)". EARSEL Workshop on Remote Sensing and GIS for Coastal Zone Management. Delft, The Netherlands, 24 - 26 oct. 1994, 10 p.[Loubersac L., Populus J., Durand C., Prou J., Kerdreux M., Lemoine O.], 1997. " SystŤme d'Information ŗ Rťfťrence Spatiale et gestion d'un espace de production ostrťicole : le cas du bassin de Marennes Olťron. International symposium " BORDOMER 97" Coastal Environnement Management and Protection. Bordeaux 27-29 oct 1997. Actes du colloque Tome 2, pp 186 - 197.
[Massť J.], 1996. Acoustics observation in the Bay of Biscay : schooling, vertical distribution, species assemblages and behaviour. Scientia Marina, 60, suppl. 2, 227-234.
[Massť J., RetiŤre N.], 1995. - "Effect of the number of transects and identification hauls on acoustic biomass estimate under mixed species conditions". Aquat. Living Resour., 1995, 8, 195-199.
[Mac Lennan D.N, E.J.Simmonds], 1992. Fisheries acoustics. Chapman and Hall, London, 325 p.
[Populus J., Loubersac L., Prou J., Kerdreux M., Lemoine O.], 1997. Geomatics for the management of oyster culture leases and production. CoastGIS'97, Second International Symposium on GIS and Computer Mapping for Coastal Zone Management, Edited D. Green, G. Massie, University of Aberdeen, Aug. 29-31, 1997.
| BRGM | Bureau de recherche gťologiques et miniŤres | http://www.brgm.fr |
| CNES | Centre National d'Etudes Spatiales | http://www.cnes.fr |
| DDE | MinistŤre de l"ťquipement | http://www.equipement.gouv.fr |
| ESA | European Space Agency | http://www.Esrin.esa.it/ |
| Fishing administration | MinistŤre de l'Agriculture et de la pÍche | http://www.agriculture.gouv.fr/index.stm |
| GťoVariances | Geostatistics specialist | http://www.geovariances.fr |
| IFEN | Institut franÁais de l"environnement | http://www.ifen.fr |
| IGN | Institut Gťographique National | http://www.ign.fr |
| Maritimes Affairs | Affaires Maritimes - serveur France Ocťan | http://www.equipement.gouv.fr/france.ocean/ |
| SHOM | Service Hydrographique et Ocťanographique de la Marine | http://www.shom.fr |
| UBO | Universitť de Bretagne Occidentale | http://www.univ-brest.fr/ |
Authors:
Christophe Durand, (Christophe.Durand@ifremer.fr),
GIS engineer, Engineering, Technology and Information Directorate
Direction de l'ingťnierie, de la Technologie et de l'Informatique
Service Dťveloppement de SystŤmes Informatiques
29280 PLOUZANE, France
Tel : (33 2) 98 22 47 00
Fax : (33 2) 98 22 45 46
WWW : http://www.ifremer.fr/ditidsiw3
Lionel Loubersac, (
Lionel.Loubersac@ifremer.fr), GIS project manager, Coastal Environment Directorate
Direction de l'Environnement Littoral
Service Applications Opťrationnelles
29280 PLOUZANE, France
Tel : (33 2) 98 22 44 95
Fax : (33 2) 98 22 45 46
WWW : http://www.ifremer.fr/delao
Jacques Massť, (Jacques.Masse@ifremer.fr),
Fisheries biologist, Living Ressources Directorate
Direction des Ressources Vivantes
Laboratoire d'Ecologie Halieutique
BP 21105
44311 NANTES Cedex 03
Tel : (33 2) 40 37 41 69
Fax : (33 2) 40 37 40 75
|
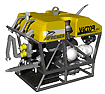
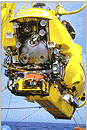
Victor 6000 is a remotely operated deep water vehicle, capable of meeting the requirements of :
Furthermore, the ROV can be used on other missions such as wreck inspection Victor 6000 consists of specific equipments and facilities :
|
Technical characteristics : |
|
NAUTILE is a manned submersible designed to explore and investigate up to 6000 m
(exploration of specific zones, physical measurements, sampling, monitoring, wreck search,
...). |
Technical characteristics : |