Timo Widbom, Olli Rantanen & Mikael Lindholm
Forecasting plant production: Accurate GIS-based on-line yield estimates
Abstract
The management of agricultural and its environmental resources and the origin of foods will become more and more important agricultural factors nowadays. Forecasting harvest is crucial for food production industry. Using accurate meteorological on-line data and radar images it is possible to make accurate yield estimates for grain and its quality. Also real time geographical information and forecasts are shown via WWW. A user can make a query about a specific variety of grain, soil type and sowing day and thus obtain information about current yield estimates in a specific location.
1 Introduction.
Monitoring food production at the agricultural level entails management of a wide variety of data. The basic geographically referenced data elements are: air temperature, humidity, rainfall, solar radiation, soil type, surface-water flow, fertilizers and pesticides used etc. When these are known and proper tools are available pests and their activity can be monitored and forecast or yield estimates made for a desired variety of grain. Much effort has been put into developing monitoring systems. In addition improved simulation models for pest management and yield estimates have been published. Geographical information systems (GIS) are powerful tools for linking models to real world data. GIS-based analytical data processing and visualization are illustrative and easy-to-understand means of presenting complicated calculations and forecasts not only to advisers but also to ordinary farmers. Thus, GIS contribute to better decision making on plant protection and yield planning (Tiilikkala et al, 1996).
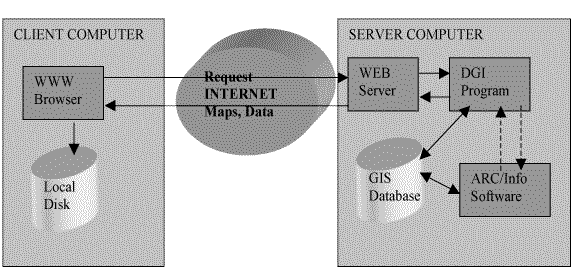
Distributed geographic information (DGI) use is growing, providing organizations with new ways of communicating and sharing geographic information (Plewe 1997). DGI is the widespread distribution of geographic information and applications range from simple, pre-drawn maps on a Web page to network-based collaborative GIS. Also advances in the capabilities of the Web language , HTML, and the implementation of new technology such as JAVA, have made it possible to include animation, and interactive GIS elements in web sites. These developments have brought new flexible possibilities to the GIS world. The DGI is one solution for interactive mapping and GIS use in the WWW. Web authors now have tools for building custom GIS applications and spatially-enabled Web sites that serve a variety of needs via the Internet. The DGI provides the framework for requests and for delivering information to Web browsers from a GIS application on a WWW server. The result is ready access to maps and information anywhere on the Internet.
Figure 1. Client/Server Model of DGI services
2 Techniques and materials
We present here MTT’s latest results in monitoring and visualizing yield estimates using GIS and WWW. We concentrate on the techniques and phases by means of which end-users throughout the food production chain (from farmer to customer) can check the quality of an agricultural product, establish the quantity and quality of crops in a certain location.
The monitoring systems are based on large databases and many years of research work. With the powerful GIS techniques, DGI, JAVA and sophisticated WWW applications now available state-of-the-art information can be distributed in real time.
In this pilot project yield estimates are based on meteorological data and extensive field work by advisers, firms and farmers. Meteorological data are received from automatic meteorological stations once a day. The data consist of the minimum and maximum temperature, air moisture, wind speed and rainfall of the day. To get more accurate estimates Doppler radar images (in 25 km2 grid) from six radar stations are also used to monitor local showers instead of using interpolated Met Pole Data,. Radar data are crucial in most cases while forecasting local yield estimates.
Once a day the data are automatically transformed into dBaseTM format. DBaseTM files are split into files for different variables in which interpolated values are calculated for every grid point (25 km2) of the mapping system by ArcInfoTM GIS software using Arc Macro Language (AML) scripts. The interpolated values are adjusted for the altitude of the grid points, the long-term average temperatures (Tiilikkala et al, 1996) and classified radar images. The long-term meteorological and radar data are obtained from the Finnish Meteorological Institute.
The Interpolated data (about 8000 grids) are automatically translated into the SASTM system for complicated statistical operations, which forms the database for final visualization. The final results are visualized in ArcInfoTM software.
2.1 Using GIS in estimating Barley yields
Barley is the oldest cereal crop cultivated in Finland. Barley is commonly grown in Finland between latitudes 60� and 66� N. Because of restrictions imposed by the climate, only spring barley can be grown in Finland (Mukula 1998). In this presentation yield estimates have been made only between latitudes 60� and 62�, where weather and radar data for our purposes were available and valid. In figures 2, 3, 4 and 5 can be seen how climate has an crucial effect on yield estimates: Finnish barley cultivars need 80-95 days to ripen and in cool climate barley needs more time and higher Effective Temperature Sum (ETS) to ripen. Also late summer night frosts usually damage barley in northern and central Finland. Instead early summer droughts in the south result in losses frequently (Mukula 1988).
In the figures can be seen that yield estimates for Finnish Barley cultivars sowed late spring are usually considerably weaker than ones sowed during early days in May.
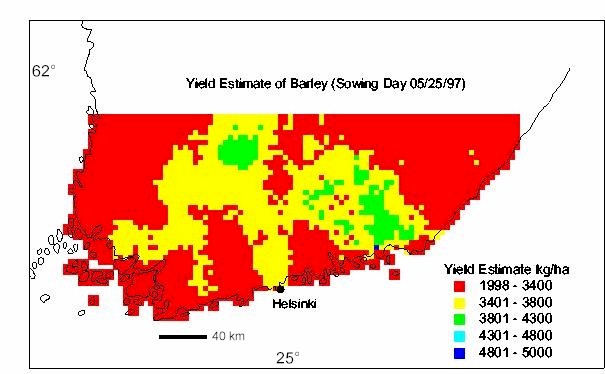
Figure 2. Yield Estimate of Barley (Sowing Day 05/25/97)
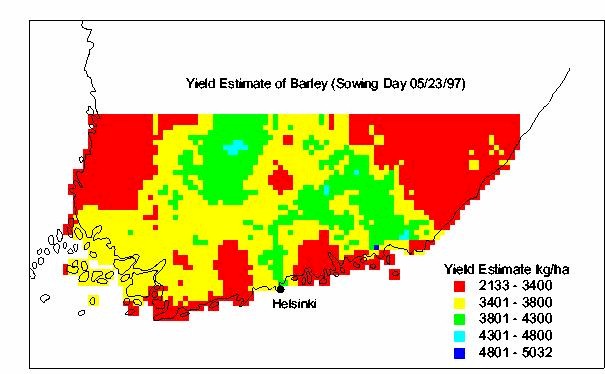
Figure 3. Yield Estimate of Barley (Sowing Day 05/23/97)
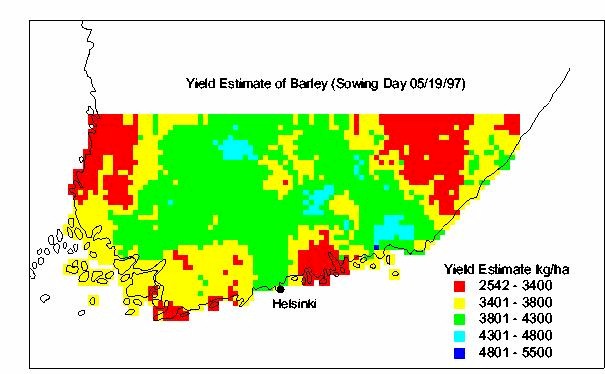
Figure 4. Yield Estimate of Barley (Sowing Day 05/19/97)
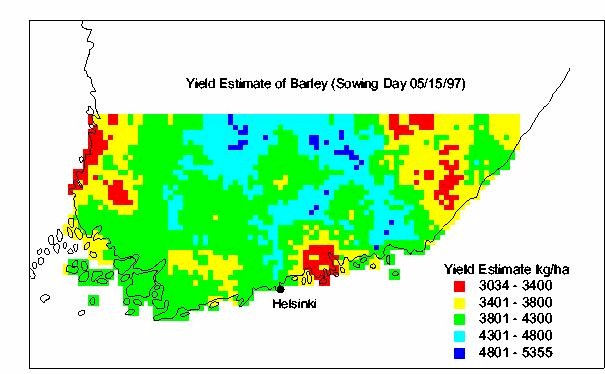
Figure 5. Yield Estimate of Barley (Sowing Day 05/15/97)
2.1 Out-of-the-box DGI Solution
Research institutes and information distributers who want to deliver computer-based information and services are increasingly turning to the WWW as their development and delivery platform, for both intranets and applications aimed at the public at large. In the case of MTT, the DGI Server will provide interactive WWW applications meeting the needs of users. This means that users can choose the information and maps best suited to their purpose and thus make decisions for further actions.
In the project, once the polygon coverages are built the batch program transfers the polygons to the DGI Server, which converts the information so that it is available for Web Browsers.
With the Web browsers’ GUI (Graphical User Interface), the user can make a query about a specific variety of grain, soil type and sowing day and thus obtain information about current yield estimates in a specific location. The browser makes a request via the Internet Map server into the GIS data (Figure 1.) The Internet Map server translates queries using CGI scripts, and final maps and results are shown on the user’s WWW browser. The DGI techniques used at MTT were developed by the Finnish National Land Survey and MTT.
Final results are translated into DGI of Finnish Land Survey for WWW requests (see: www.mtt.fi/gis/satoennuste/)
3 Conclusions
The importance of GIS in agriculture is unquestionable. GIS tools permit the display of crop yield data and factors which may affect crop yield, e.g. soil fertility data, soil types, insect infestations, weed locations, rainfall distributions and the terrain elevation. The GIS tools can also be used in planning to eliminate yield-limiting factors or to prevent accumulation of agricultural chemical waste by avoiding unnecessary applications of pesticides or fertilizers. For such decision-making purposes interactive DGI users can take advantage of the benefits of the Web based on non-propietary, flexible and scaleable 24-hour everywhere accessible standards. Information will also be timely and up-to-date because the info is "live".
4 References.
Mukula, Jaakko. The effects of climatic variations on agriculture in Finland; The effects on barley yields. In: (M.L. Parry, T.R. Carter & N.T. Konijin (eds.)): The Impact of cimatic variations on agriculture. Volume 1: Assessments in cool temperate and cold regions). Kluwer Academic Publishers.1988
Plewe, Brandon. GIS Online. Information retrieval, mapping, and the Internet. OnWord Press.1997
Rantanen, Olli. The effects of climatic variations on agriculture in Finland; The effects on Sping Whear Yields. In: (M.L. Parry, T.R. Carter & N.T. Konijin (eds.)): The Impact of cimatic variations on agriculture. Volume 1: Assessments in cool temperate and cold regions). Kluwer Academic Publishers.1988
Tiilikkala, Kari & Olli Rantanen Timo Widbom & Hannu. Ojanen. GIS-based forecasting and monitoring of pests in Finland. In: (B.J.M Secher & J. Frahm (eds.)) Proceedings of the workshop of decision systems in crop protection. SP report no. 15. 97-103. Danish Institute of Plant and Soil Science. Tjele.1996
Widbom, T & M. Lindholm. Monitoring food production with GIs via the Internet: In: edited by H. Kure, I. Thysen, A. R. Kristensen. First European conference for information technology in agriculture : proceedings, the Royal Veterinary and Agricultural University, Copenhagen, Denmark, 15-18 June 1997. EFITA. p. 243-245. 1997
Authors
Timo Widbom
GIS Manager, Agricultural Research Center of Finland, Data and Information Services
FIN-31600 Jokioinen Finland. Email: timo.widbom@mtt.fi
Olli Rantanen
Senior Researcher, Agricultural Research Center of Finland, Institute of Plant Husbandry
FIN-31600 Jokioinen Finland. Email: olli.rantanen@mtt.fi
Mikael Lindholm
GIS Analyst, Agricultural Research Center of Finland, Data and Information Services
FIN-31600 Jokioinen Finland. Email: mikael.lindholm@mtt.fi